. 2020 Jan 27:9:e51503.
doi: 10.7554/eLife.51503.

Deep learning models predict regulatory variants in pancreatic islets and refine type 2 diabetes association signals

Affiliations

Deep learning models predict regulatory variants in pancreatic islets and refine type 2 diabetes association signals

Agata Wesolowska-Andersen et al. Elife. .

Abstract

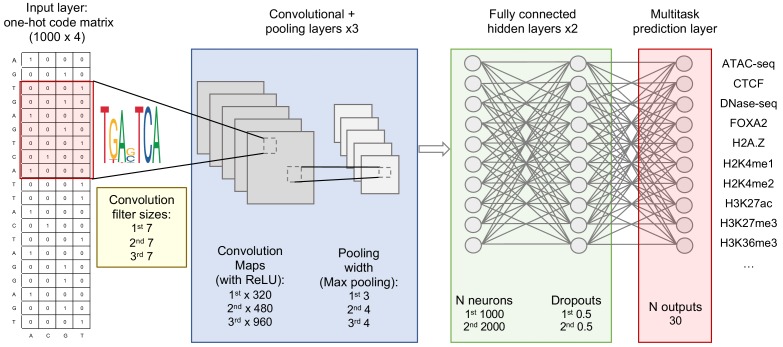
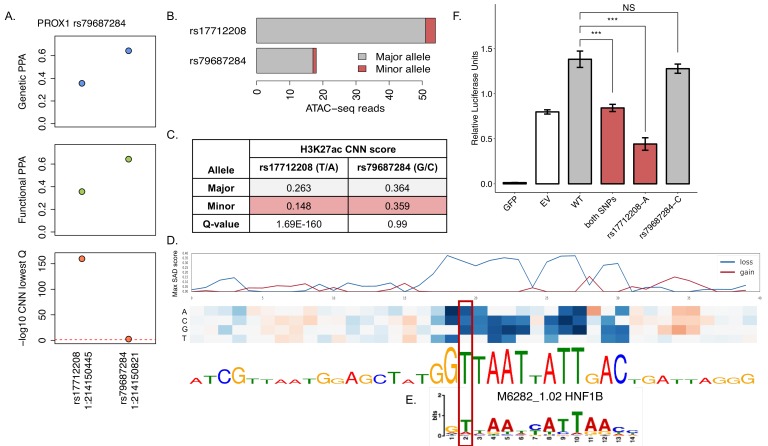
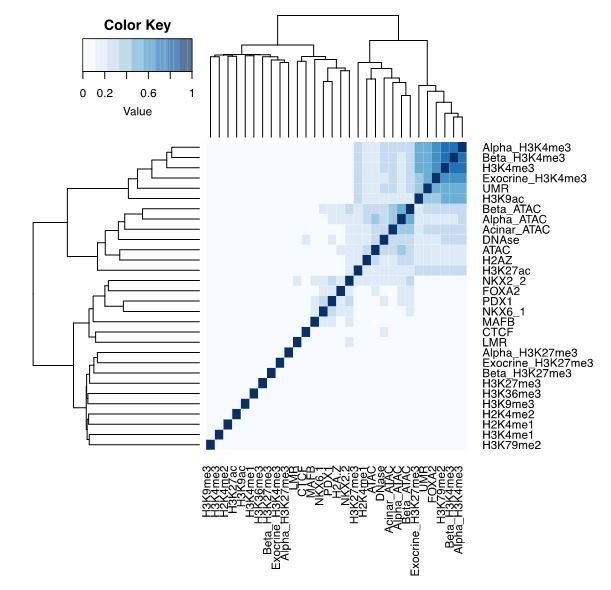
Genome-wide association analyses have uncovered multiple genomic regions associated with T2D, but identification of the causal variants at these remains a challenge. There is growing interest in the potential of deep learning models - which predict epigenome features from DNA sequence - to support inference concerning the regulatory effects of disease-associated variants. Here, we evaluate the advantages of training convolutional neural network (CNN) models on a broad set of epigenomic features collected in a single disease-relevant tissue - pancreatic islets in the case of type 2 diabetes (T2D) - as opposed to models trained on multiple human tissues. We report convergence of CNN-based metrics of regulatory function with conventional approaches to variant prioritization - genetic fine-mapping and regulatory annotation enrichment. We demonstrate that CNN-based analyses can refine association signals at T2D-associated loci and provide experimental validation for one such signal. We anticipate that these approaches will become routine in downstream analyses of GWAS.

Keywords: computational biology; convolutional neural networks; deep learning; epigenomics; fine-mapping; genetics; genomics; human; pancreatic islets; systems biology; type 2 diabetes.


Conflict of interest statement

AW, GZ, VN, FA, MT, JT, AM, AG No competing interests declared, MM Senior editor, eLife. MMcC has served on advisory panels for Pfizer, NovoNordisk and Zoe Global, has received honoraria from Merck, Pfizer, Novo Nordisk and Eli Lilly, and research funding from Abbvie, Astra Zeneca, Boehringer Ingelheim, Eli Lilly, Janssen, Merck, NovoNordisk, Pfizer, Roche, Sanofi Aventis, Servier, and Takeda. As of June 2019, MMcC is an employee of Genentech, and a holder of Roche stock.

Figures

Figure 1.
Figure 1.. Area under precision-recall curves (AUPRC) for 30 islet epigenomic features predicted by CNN models.
The AUPRC values were calculated based on performance on the test set formed by 1000 bp sequences from chr2, held out from training and validation. The boxplots show summary of performance across 1000 individual CNN models, and are grouped by corresponding regulatory element. As the interpretation of AUPRC values depend on how well balanced the dataset it, we denote the class imbalance (equivalent to prediction of a random model) for each feature as open circles, which corresponds to the proportion of sequences with the given feature present. Features marked as ‘a_”, ‘b_”,”e_”, and ‘aci_”, were assayed in FACS-sorted cell populations rather than whole pancreatic islets, and correspond to alpha cells, beta cells, exocrine cells, and acinar cells, respectively (Bramswig et al., 2013; Ackermann et al., 2016).
Figure 1—figure supplement 1.
Figure 1—figure supplement 1.. Schematic representation of the applied convolutional neural network architecture, with sizes and numbers of filters, and width of pooling indicated for a representative combination of tested hyperparameters.
Figure 1—figure supplement 2.
Figure 1—figure supplement 2.. Area under receiver-operator curves (AUROC) for 30 islet epigenomic features predicted by CNN models.
The AUROC values were calculated based on performance on the test set formed by 1000 bp sequences from chr2, held out from training and validation. The boxplots show summary of performance across 1000 individual CNN models, and are grouped by corresponding regulatory element. Features marked as ‘a_”, ‘b_”,”e_”, and ‘aci_”, were assayed in FACS-sorted cell populations rather than whole pancreatic islets, and correspond to alpha cells, beta cells, exocrine cells, and acinar cells, respectively (Ackermann et al., 2016; Bramswig et al., 2013).
Figure 1—figure supplement 3.
Figure 1—figure supplement 3.. Influence of the size of filters in the first convolutional layers on filters’ annotation and filter’s influence on predictions.
Boxplots represent summary of 100 individual CNN models differing in the size of convolutional filters of the first layer. Informative filters represent filters with standard deviation of filter activation >0, indicating filters helping with the final CNN predictions of regulatory features, while annotated filters represent filters which could be annotated to match any known TF binding motifs. In grey are shown all the informative filters, and in white a subset of these filters which were not annotated to match any known TF binding motifs. The number of informative filters decreases with increasing filter size. Red boxplots show increasing number of annotated filters with increasing filter size.
Figure 2.
Figure 2.. Functional characterization of CNN-predicted regulatory variants.
(A) Distribution of CNN-predicted regulatory variants (q < 0.05) in the six broader CNN feature groups. (B) Enrichment of variants predicted to affect the CNN feature groups within variant list ranked by eQTL result p-value from the InsPIRE study (Viñuela et al., 2019). Enrichment was calculated with R package gage (Luo et al., 2009), red bars indicate gene-set enrichment at the top (and blue at the bottom) of the eQTL p-value -ranked list of variants. (C) Predicted regulatory variants reside in regulatory elements they are predicted to affect. For each variant we found the lowest CNN q-value among feature groups corresponding to different regulatory elements (promoters, enhancers, open chromatin, active regions, TF binding, repressed regions) predicted from genomic sequence, and we ranked all variants according to these six q-values. We then tested whether variants residing in each of the 15 pancreatic islet chromatin states (Thurner et al., 2018) were enriched at the top or bottom of these ranked lists using gene-set enrichment analysis implemented in the R package gage (Luo et al., 2009). Colours in the heatmap represent the strength of the enrichment expressed as log10-transformed enrichment q-values, with red colours representing enrichments at the top (enrichment), and blue at the bottom of the ranked lists (depletion). For plotting purposes all -log10(p-values) below −50, or above 50 were truncated to these values. Stars denote significant enrichments: *<0.05, **<0.01 and ***<0.001. Variant level functional annotations and CNN predictions for the credible set variants are available as Figure 2—source data 1.
Figure 3.
Figure 3.. Convergence between CNN regulatory predictions and fine-mapping approaches for functional variant prioritization.
(A) Regulatory variants (black) are enriched among variants with highest genetic PPAs (gPPAs) over permuted background (blue). (B) Regulatory variants (black) are enriched among variants with highest functional PPAs (fPPAs) generated with FGWAS over permuted background (blue). (C) Regulatory variants (black) are enriched among variants with top PPA ranks within 99% sets of credible variants over permuted background (blue), as well as at top ranks of signals acting through insulin secretion (red) over insulin action (purple) mechanisms.
Figure 3—figure supplement 1.
Figure 3—figure supplement 1.. Comparison of CNN regulatory predictions made with the islet-specific CNN ensemble to predictions made with the publicly available DeepSEA model.
(A) Comparison of -log10-transformed q-values from the islet CNN ensemble with functional significance scores generated by the omni-tissue DeepSEA model (B) Comparison of -log10-transformed q-values from the islet CNN ensemble with -log10-transformed E-values for the ENCODE PanIslet DNase generated by the DeepSEA model. In scatterplots variants predicted to be regulatory with both approaches are shown in red, variants predicted as regulatory only by DeepSEA are shown in blue, and variants predicted as regulatory only by islet CNNs are shown in green. (C) Enrichment of regulatory variants among variants at the top ranks of T2D GWAS 99% credible sets (black) predicted by the omni-tissue DeepSEA model over the permuted background (blue). Purple line shows the signals acting through insulin action mechanisms, while red line shows the signals acting through insulin secretion (pancreatic islet-mediated) mechanisms. (D) Enrichment of regulatory variants among variants at the top ranks of T2D GWAS 99% credible sets (black) predicted by the single-tissue DeepSEA model based on ENCODE PanIslet DNase dataset over the permuted background (blue). Purple line shows the signals acting through insulin action mechanisms, while red line shows the signals acting through insulin secretion (pancreatic islet-mediated) mechanisms.
Figure 4.
Figure 4.. Examples of T2D-association signals where integration of CNN regulatory variant prediction downstream of functional fine-mapping refines the association signals to single candidate variants.
Genetic PPAs (gPPAs) are shown in the top panels as blue points, functional PPAs (fPPAs) are shown in the middle panels as green points, and -log10-transformed q-values from CNN predictions are shown in the bottom panels as red points.
Figure 5.
Figure 5.. CNN regulatory predictions help refine the association signal at PROX1 locus, previously fine-mapped to only two variants: rs17712208 and rs79687284.
(A) Genetic PPA (gPPA), functional PPA (fPPA) and -log10(q-value) of the CNN islet regulatory predictions for both variants. (B) Allelic imbalance in open chromatin across four pancreatic islets heterozygous for the variants. Allele counts for the major (grey) and minor (red) alleles are shown for both variants. (C) Table summary with CNN predictions for the H3K27ac mark for both variants. (D) In silico saturated mutagenesis for 40nt flanking sequence around the rs17712208 variant for the H3K27ac predictions. The line plots in the upper panel indicate the SAD (SNP accessibility difference) scores corresponding to absolute highest values from the heatmap below, with blue line indicating loss of function, and red – gain of function changes. Blue fields in the heatmap indicate that a given nucleotide substitution would result in decrease in prediction values for H3K27ac, while red field indicate increase in the predictions. The height of letters in the sequence below the heatmap indicated the relative importance of each nucleotide in the final predictions. (E) Matched HNF1B binding motif is shown below. (F) Luciferase reporter assays confirmed that the A allele of rs17712208 resulted in significant repression of enhancer activity, while no effect was observed for the rs79687284 variant. GFP = green fluorescent protein (negative control), EV = empty vector (baseline). Source file with luciferase intensity values is available as Figure 5—source data 1.
Author response image 1.
Author response image 1.. Pairwise Jaccard distances for the pancreatic islet epigenomic datasets used in CNN training.

References

    1. Ackermann AM, Wang Z, Schug J, Naji A, Kaestner KH. Integration of ATAC-seq and RNA-seq identifies human alpha cell and beta cell signature genes. Molecular Metabolism. 2016;5:233–244. doi: 10.1016/j.molmet.2016.01.002. - DOI - PMC - PubMed
    1. Battle A, Brown CD, Engelhardt BE, Montgomery SB, GTEx Consortium. Laboratory, Data Analysis &Coordinating Center (LDACC)—Analysis Working Group. Statistical Methods groups—Analysis Working Group. Enhancing GTEx (eGTEx) groups. NIH Common Fund. NIH/NCI. NIH/NHGRI. NIH/NIMH. NIH/NIDA. Biospecimen Collection Source Site—NDRI. Biospecimen Collection Source Site—RPCI. Biospecimen Core Resource—VARI. Brain Bank Repository—University of Miami Brain Endowment Bank. Leidos Biomedical—Project Management. ELSI Study. Genome Browser Data Integration &Visualization—EBI. Genome Browser Data Integration &Visualization—UCSC Genomics Institute, University of California Santa Cruz. Lead analysts: Laboratory, Data Analysis &Coordinating Center (LDACC): NIH program management: Biospecimen collection: Pathology: eQTL manuscript working group: Genetic effects on gene expression across human tissues. Nature. 2017;550:204–213. doi: 10.1038/nature24277. - DOI - PMC - PubMed
    1. Bernstein BE, Stamatoyannopoulos JA, Costello JF, Ren B, Milosavljevic A, Meissner A, Kellis M, Marra MA, Beaudet AL, Ecker JR, Farnham PJ, Hirst M, Lander ES, Mikkelsen TS, Thomson JA. The NIH roadmap epigenomics mapping consortium. Nature Biotechnology. 2010;28:1045–1048. doi: 10.1038/nbt1010-1045. - DOI - PMC - PubMed
    1. Bhandare R, Schug J, Le Lay J, Fox A, Smirnova O, Liu C, Naji A, Kaestner KH. Genome-wide analysis of histone modifications in human pancreatic islets. Genome Research. 2010;20:428–433. doi: 10.1101/gr.102038.109. - DOI - PMC - PubMed
    1. Bramswig NC, Everett LJ, Schug J, Dorrell C, Liu C, Luo Y, Streeter PR, Naji A, Grompe M, Kaestner KH. Epigenomic plasticity enables human pancreatic α to β cell reprogramming. Journal of Clinical Investigation. 2013;123:1275–1284. doi: 10.1172/JCI66514. - DOI - PMC - PubMed

Publication types