. 2020 Jan 27:9:e51754.
doi: 10.7554/eLife.51754.

Loss of Kat2a enhances transcriptional noise and depletes acute myeloid leukemia stem-like cells

Affiliations

Loss of Kat2a enhances transcriptional noise and depletes acute myeloid leukemia stem-like cells

Ana Filipa Domingues et al. Elife. .

Abstract

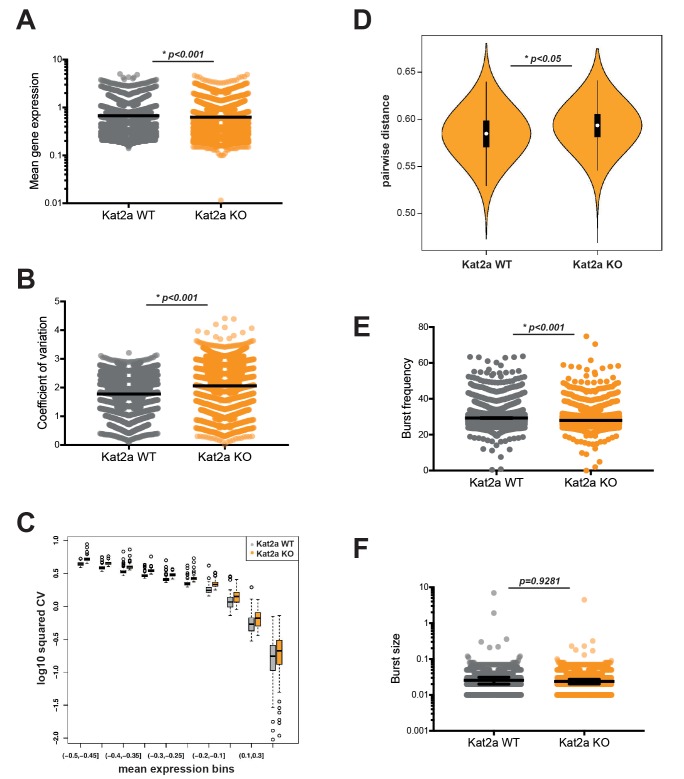
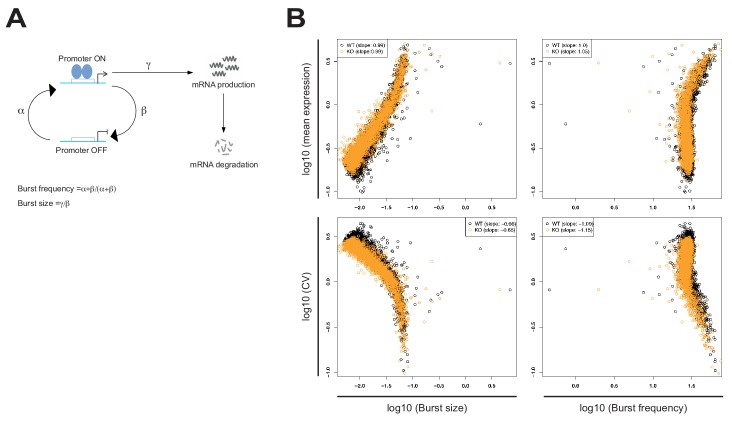
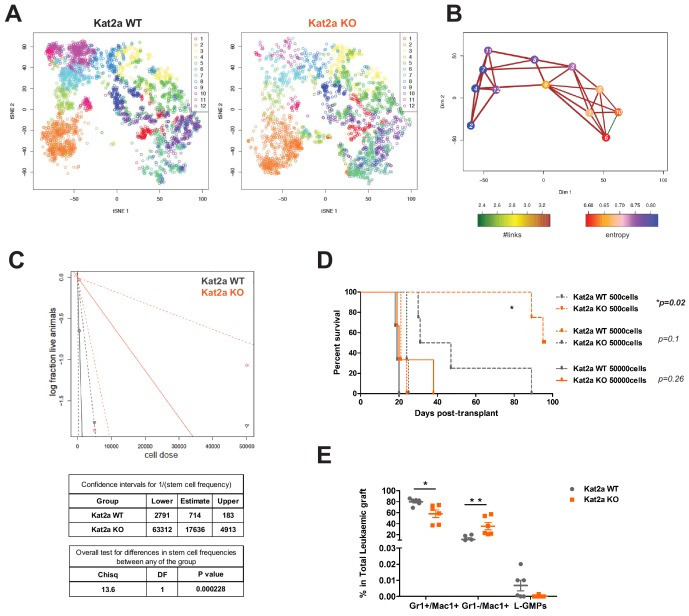
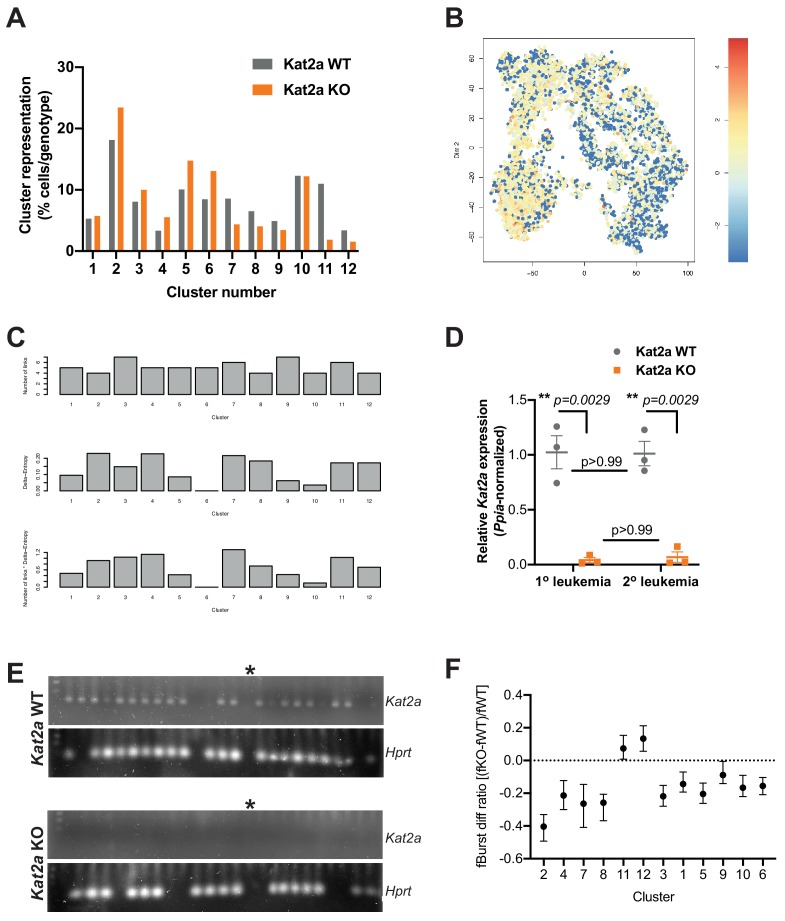
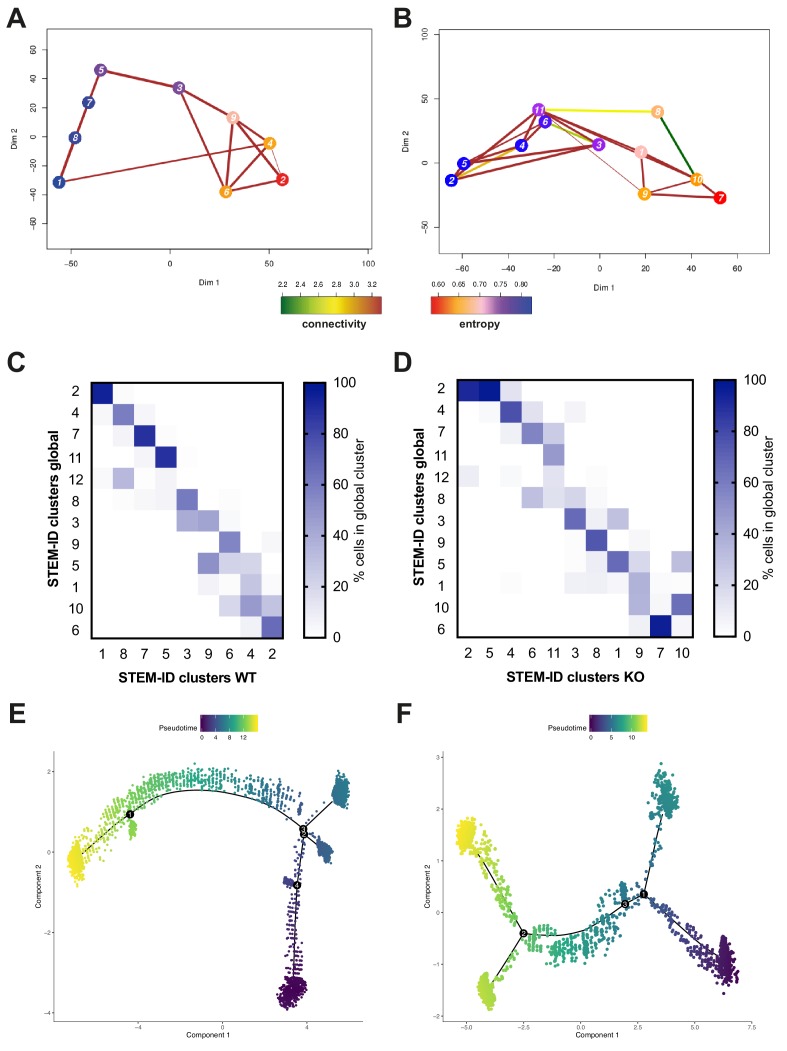
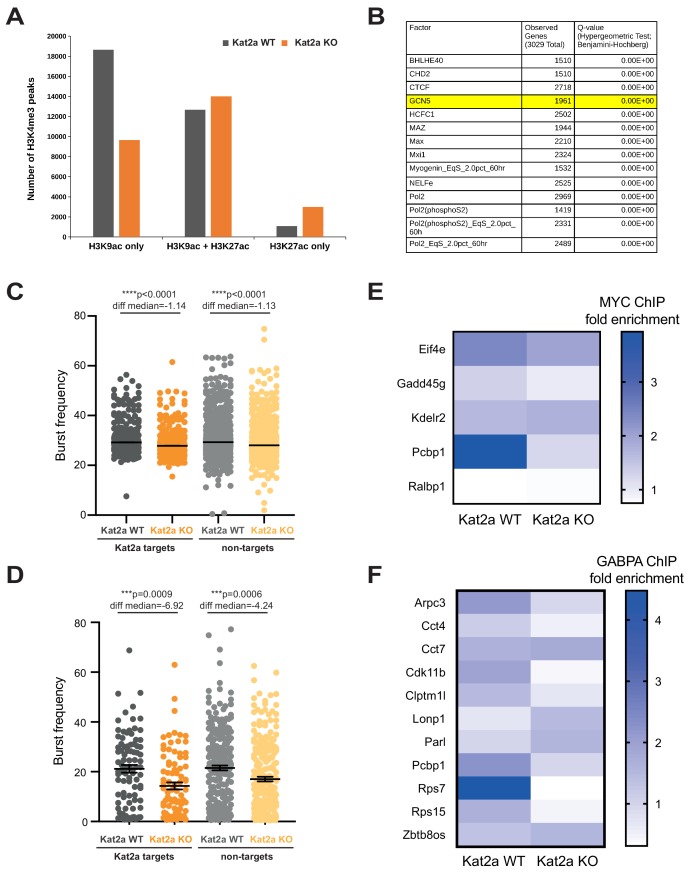
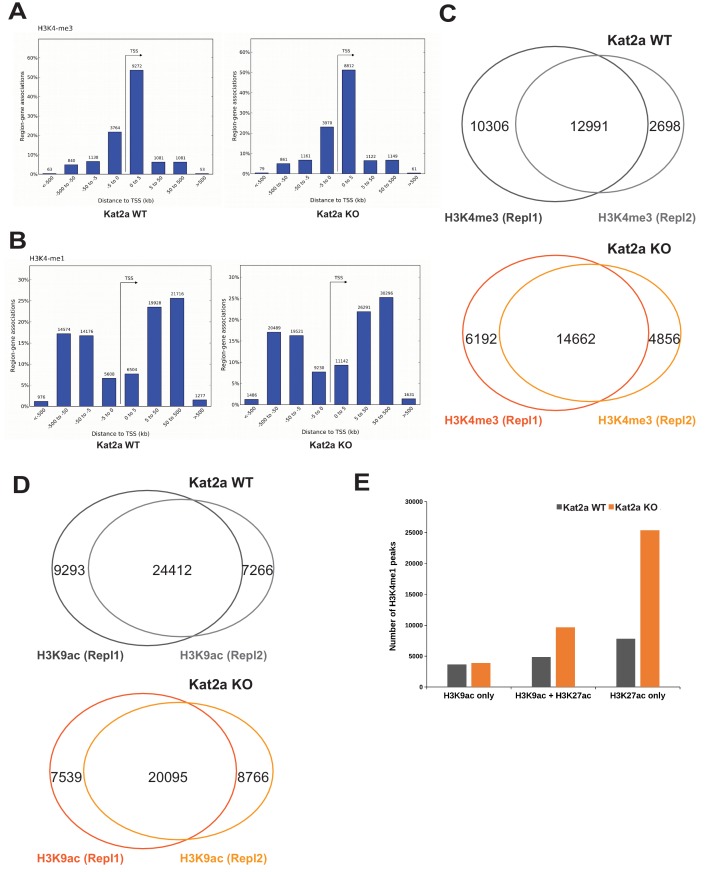
Acute Myeloid Leukemia (AML) is an aggressive hematological malignancy with abnormal progenitor self-renewal and defective white blood cell differentiation. Its pathogenesis comprises subversion of transcriptional regulation, through mutation and by hijacking normal chromatin regulation. Kat2a is a histone acetyltransferase central to promoter activity, that we recently associated with stability of pluripotency networks, and identified as a genetic vulnerability in AML. Through combined chromatin profiling and single-cell transcriptomics of a conditional knockout mouse, we demonstrate that Kat2a contributes to leukemia propagation through preservation of leukemia stem-like cells. Kat2a loss impacts transcription factor binding and reduces transcriptional burst frequency in a subset of gene promoters, generating enhanced variability of transcript levels. Destabilization of target programs shifts leukemia cell fate out of self-renewal into differentiation. We propose that control of transcriptional variability is central to leukemia stem-like cell propagation, and establish a paradigm exploitable in different tumors and distinct stages of cancer evolution.

Keywords: Kat2a; Single-cell RNA seq; acute myeloid leukaemia; cancer biology; chromosomes; epigenetics; gene expression; mouse; transcriptional bursting; transcriptional heterogeneity.

Plain language summary

Less than 30% of patients with acute myeloid leukaemia – an aggressive cancer of the white blood cells – survive five years post-diagnosis. This disease disrupts the maturation of white blood cells, resulting in the accumulation of immature cells that multiply and survive but are incapable of completing their maturation process. Amongst these, a group of cancer cells known as leukemic stem cells is responsible for continually replenishing the leukaemia, thus perpetuating its growth. Cancers develop when cells in the body acquire changes or mutations to their genetic makeup. The mutations that lead to acute myeloid leukaemia often affect the activity of genes known as epigenetic regulators. These genes regulate which proteins and other molecules cells make by controlling the way in which cells ‘read’ their genetic instructions. The epigenetic regulator Kat2a is thought to ‘tune’ the frequency at which cells read their genetic instructions. This tuning mechanism decreases random fluctuations in the execution of the instructions cells receive to make proteins and other molecules. In turn, this helps to ensure that individual cells of the same type behave in a similar way, for example by keeping leukaemia cells in an immature state. Here, Domingues, Kulkarni et al. investigated whether interfering with Kat2a can make acute myeloid leukaemia less aggressive by allowing the immature white blood cells to mature. Domingues, Kulkarni et al. genetically engineered mice to remove Kat2a from blood cells on demand and then inserted a mutation that causes acute myeloid leukaemia. The experiments showed that the loss of Kat2a delayed the development of leukaemia in the mice and progressively depleted leukaemia stem cells, causing the disease to become less aggressive. The results also showed that loss of Kat2a caused more fluctuations in how the white blood cells read their genetic code, which resulted in more variability in the molecules they produced and increased the tendency of the cells to mature. These findings establish that loss of Kat2a causes leukaemia stem cells to mature and stop multiplying by untuning the frequency at which the cells read their genetic instructions. In the future, it may be possible to develop drugs that target human KAT2A to treat acute myeloid leukaemia.


Conflict of interest statement

AD, RK, GG, SG, LV, LA, EF, MK, RA, AJ, ST, KZ, BH, SP, CP No competing interests declared

Figures

Figure 1.
Figure 1.. Conditional knockout of Kat2a promotes differentiation of MLL-AF9-transformed cells in vitro.
(A) Serial re-plating of colony-forming cell (CFC) assays of MLL-AF9 transformed cells, mean ± SEM, n = 3. (B) Excision efficiency was evaluated by qPCR during re-plating of MLL-AF9 transformed cells, mean ± SEM, n = 2–3, *p<0.01 and **p<0.001. (C) Proportion of Compact-type colonies in MLL-AF9 transformed cells on Kat2a WT or KO background, mean ± SEM, n = 3, *p<0.01 and **p<0.001. (D) Representative photograph of a Compact-type colony. (E) Flow cytometry analysis of the colony in (D). (F) Proportion of Mixed-type colonies in MLL-AF9 transformed cells on Kat2a WT or KO background, mean ± SEM, n = 3, *p<0.01 and **p<0.001. (G) Representative photograph of a Mixed-type colony. (H) Flow cytometry analysis of the colony in (G). Two-tailed t-test was performed in (A), (B), (C) and (F).
Figure 1—figure supplement 1.
Figure 1—figure supplement 1.. Loss of Kat2a does not affect normal hematopoiesis.
(A) Diagram of conditional Kat2a floxed (WT) and Kat2a-excised (KO) alleles, including excision detection strategy and diagrams of the transcript and protein generated upon Kat2a locus excision. Kat2a IN (In11, within excised region) and Kat2a OUT primers (Out18, downstream of excised region) used in qPCR analysis of genomic DNA. Amplicons generated by primer pairs Ex1−2/Ex2 (red), Ex2/Ex18(2) (blue) and Ex18 (green) distinguish WT from KO transcript. (B) Excision efficiency quantified by qPCR in mouse BM samples, mean ± SEM, n = 4, **p<0.01. (C) Quantitative RT-(q)PCR analysis of Kat2a transcript levels in BM LMPP and GMP; mean ± SEM, n = 4, **p<0.001. (D) RT-qPCR analysis of red, blue and green amplicons in A for diagnosis of Kat2a WT and KO AML samples, mean ± SEM, n = 4. (E) Flow cytometry analysis of stem and progenitor BM composition in Kat2a WT and KO young mice (6 weeks after pIpC treatment), mean ± SEM, n = 3’ *p<0.05. (F) Colony-forming assays of progenitor populations (left to right: HSC, MPP, GMP and MEP) isolated from Kat2a WT and KO BM 4–6 weeks after excision, mean ± SEM, n = 4–5, *p<0.05. (G) Flow cytometry analysis of stem and progenitor BM composition in Kat2a WT and KO old mice (>4 months after pIpC treatment), mean ± SEM, n > 5. (H) Flow cytometry analysis of donor-derived BM stem and progenitor cells in a long-term hematopoietic reconstitution assay. Irradiated recipients were transplanted with Kat2a WT or KO cells and analyzed 16–20 weeks later; mean ± SEM, n = 4–5. Two-tailed t-test was performed in (B), (C), (E) and (F).
Figure 1—figure supplement 2.
Figure 1—figure supplement 2.. Loss of Kat2a promotes differentiation of MLL-AF9 leukemia cells in vitro.
(A) Representative image of compact colonies obtained from lineage-depleted BM cells transduced in vitro with a retrovirus encoding the leukemic MLL-AF9 fusion genes and plated serially through three methylcellulose-based colony-forming assays. (B) Flow cytometry plot of the colonies in (A). (C) Representative image of a mixed colony obtained from lineage-depleted BM cells transduced in vitro with a retrovirus encoding the leukemic MLL-AF9 fusion genes and plated serially through three methylcellulose-based colony-forming assays. (D) Flow cytometry plot of the colonies in (C). (D) CFC assay frequency, mean ± SEM, n = 3, **p<0.001. (E) Proportion of colony types in CFC assays from clonal liquid cultures initiated with Kat2a WT vs KO cells transformed in vitro by MLL-AF9-expressing retroviral particles, mean ± SEM, n = 3, *p<0.01 and **p<0.001. (F) Mean fluorescence intensity of Mac1 in Kat2a WT and KO cells obtained from clonal liquid cultures, mean + SEM, n = 3, ***p<0.0001. Two-tailed t-test was performed in (E) and (F).
Figure 2.
Figure 2.. Kat2a loss impairs establishment of MLL-AF9 leukemia in vivo.
(A) Survival curve of animals transplanted with MLL-AF9 transformed Kat2a WT or KO cells. N = 5 animals/genotype; log rank test, p=0.05. (B) Relative expression (quantitative RT-PCR) of Kat2a in MLL-AF9 primary leukemia BM cells from Kat2a WT and KO backgrounds, mean ± SEM, n = 3, **p<0.001, 2-tailed t-test. (C) Flow cytometry analysis of BM cellularity of primary Kat2a WT or KO leukemias: shown are late (Mac1+Gr1+) and early (Mac1+Gr1-) differentiated populations and Gr1-Mac1-cKit+Sca1-CD34+FcgR+ candidate stem-like L-GMP cells, mean ± SEM, n = 4–5; 2-tailed t-test performed.
Figure 2—figure supplement 1.
Figure 2—figure supplement 1.. Primary Kat2a WT and KO MLL-AF9 leukemias have similar disease burden.
(A–B) Analysis of leukemia burden at terminal point: liver and spleen weights (A) and peripheral blood hematological parameters (B), namely white and red blood cell (respectively, WBC and RBC) counts and hemoglobin concentration, mean ± SEM, n = 5. Two-tailed t-test did not detect significant differences.
Figure 3.
Figure 3.. Loss of Kat2a increases transcriptional heterogeneity of primary MLL-AF9 leukemias.
(A) Mean gene expression levels in Kat2a WT and KO primary leukemia cells. Median and 95% CI of mean gene expression levels for the 2588 genes in the Robust gene set, across 7360 cells Kolmogorov-Smirnov (KS) non-parametric test, p-value<0.01. (B) Gene expression CV in Kat2a WT and KO primary leukemia cells. Data as in (A) : KS non-parametric test, p-value<0.01. (C) Binned gene expression CV across the distribution of gene expression averages for Kat2a WT and KO primary leukemia cells, KS non-parametric test, p-value<0.05 for all bins. (D) Pair-wise distance measure between any two genes across Kat2a-WT and KO primary leukemia cells. The top 500 most variable genes in the Robust gene set for each genotype, as determined by distance to the mean CV, were used, as previously described (Mohammed et al., 2017). Welch t-test for comparison of means *p-value<0.01. (E) Distribution of burst frequencies for the Robust gene set in Kat2a WT and KO primary leukemias, as calculated by the D3E algorithm. KS non-parametric test, * p-value<0.0001. (F) Distribution of burst sizes for the Robust gene set in Kat2a WT and KO primary leukemias, as calculated by the D3E algorithm. KS non-parametric test, non-significant.
Figure 3—figure supplement 1.
Figure 3—figure supplement 1.. Differential transcriptional heterogeneity in Kat2a WT and KO MLL-AF9 primary leukemias.
(A) Stochastic two-state promoter model of gene expression. The model depicts stochastic switching between ON and OFF promoter states, with parameterization (α, β, γ and their use for estimation of burst size and frequency) as per the published D3E algorithm. The gene is transcribed in the ON state at a given burst frequency (frequency of OFF to ON promoter switches) and produces a given number of mRNA copies per burst (burst size). (B) Multiple linear regression analysis of the relationship between mean and coefficient of variation (CV) of gene expression against burst size and burst frequency in Kat2a WT and Kat2a KO leukemias. Absolute slope values reflect extent of contribution to mean expression and CV; slope value signal indicates direction of contribution. All values are significant at p-value<0.001, as computed by multiple linear regression.
Figure 4.
Figure 4.. Kat2a loss depletes functional MLL-AF9 leukemia stem-like cells.
(A) t-SNE plot of single-cell RNA-seq data for Kat2a WT (left) and KO (right) primary leukemic cells. RACE-ID K-means clustering was used to classify cells from Kat2a WT and KO primary leukemias in combination, on the basis of the expression of the most highly variable genes from each genotype as defined in Figure 2D. Clusters are color-coded and cells of each genotype were displayed separately for easier appreciation of their non-overlapping transcriptional spaces. (B) STEM-ID trajectory plot of analysis in (A) representing combined measures of information entropy and cluster connectivity strength; clusters as in (A). (C) Extreme Limiting Dilution Analysis (ELDA Hu and Smyth, 2009) of leukemia-initiating cell frequency in Kat2a WT and KO primary leukemias. Primary leukemias of each genotype were pooled (WT-5; KO-4) and transplanted as 50K, 5K and 500 cell doses into 3–4 animals/dose group. (D) Survival curve of secondary recipients of MLL-AF9 leukemic cells from Kat2a WT and KO backgrounds; data as in (C). Log rank test for difference in survival, n = 3–4/per dose group. 50 K cells p=0.26, 5 K cells p=0.1, 500 cells p=0.02. (E) Flow cytometry analysis of BM cells from secondary Kat2a WT and KO leukemia transplant recipients (50K and 5 K cells). Cell compartments as in Figure 2C; n = 6; mean ± SEM, 2-tailed t-test, **p<0.001, *p<0.01, and L-GMPs p=0.07.
Figure 4—figure supplement 1.
Figure 4—figure supplement 1.. Kat2a WT and KO MLL-AF9 primary leukemias have distinct cluster composition and organization.
(A) Relative representation of Kat2a WT and KO cells in RACE-ID clusters of primary MLL-AF9 leukemia. (B) Expression of an MLL-associated self-renewal gene signature in individual cells along the global MLL-AF9 STEM-ID pseudo-time trajectory. Trajectory representation as in Figure 4A, with both genotypes in the same plot. Gene signature defined as per the representation of gene set GCM_MLL (MSigDB) in the Robust geneset. (C) STEM-ID parameters of connectivity (top), entropy (middle) and stemness score (bottom) in MLL-AF9 primary leukemia clusters represented in Figure 4B. The cluster stemness score is the product of the cluster entropy measure and number of links for the cluster in the network; cluster seven has the highest stemness score. (D) Quantitative RT-PCR analysis of Kat2a expression in primary (as per Figure 2B) and secondary MLL-AF9 leukemias of Kat2a WT and Kat2a KO genotypes. Primers and probe used assay exons 6 and 7, within the excised genomic region. N = 3 individual leukemias per genotype and time-point; mean ± SEM; 2-tailed t-test at significant p<0.05. (E) Representative gel electrophoresis of nested single-cell RT-PCR analysis of Kat2a expression in Lin-Kit+Sca-CD16/32+ cells obtained from secondary MLL-AF9 leukemias initiated with Kat2a WT (top) or KO (bottom) cells. Total = 88 Lin-Kit+Sca-CD16/32+ cells/genotype, two different leukemias each; detection frequency of Hprt in duplex was 83% (Kat2a WT) and 76% (Kat2a KO); * no-template control lane. We analyzed a total of 176 cells, including Lin-Kit+Sca-CD16/32+ and Lin-Kit+ cells, and observed 9% Kat2a-expressing Hprt+ KO cells (84% in WT), all of which in the Kit- population. (F) Differential burst frequency between Kat2a KO and WT primary MLL-AF9 leukemia cells in individual clusters along the STEM-ID trajectory presented in the main text Figure 4B.
Figure 4—figure supplement 2.
Figure 4—figure supplement 2.. Kat2a WT and KO MLL-AF9 primary leukemias have unique differentiation trajectories.
(A–B) STEM-ID trajectory plots of (A) Kat2a WT and (B) Kat2a KO leukemia cells representing combined measures of information entropy and cluster connectivity strength. (C–D) Relative representation of global STEM-ID clusters (Figure 4B) within (C) Kat2a WT-specific and (D) Kat2a KO-specific STEM-ID clusters, as per trajectories in (A) and (B), respectively. (E–F) Monocle pseudo-time trajectories of (E) Kat2a WT and (F) Kat2a KO leukemia cells. Cell identities at the stem-like and differentiated-like end states of STEM-ID (A–B) and Monocle (E–F) genotype-specific pseudo-time alignments were compared, with 67.8% overlap (range 39.8–88.4%) between methods.
Figure 5.
Figure 5.. Loss of Kat2a depletes H3K9ac and perturbs transcription factor-binding in a subset of regulatory gene promoters.
(A) Quantification of H3K9ac and H3K27ac ChIPseq peaks at H3K4me3 gene promoters in Kat2a WT and KO primary MLL-AF9 leukemias. (B) Top ENCODE ChIP-seq Significance Tool enrichments for H3K9ac-positive promoters exclusive to Kat2a WT primary MLL-AF9 leukemia cells. These promoters constitute Kat2a acetylation targets. (C) Distribution of burst frequencies for Kat2a acetylation targets vs. non-targets within the 2588-Robust gene set. Values as calculated by D3E with 2585 genes called differential. Mann-Whitney non-parametric test for comparison of rank medians; p<0.0001 for Kat2a WT vs. KO comparisons. WT vs KO median rank differential non-significant. (D) Distribution of burst frequencies for Kat2a acetylation targets vs. non-targets amongst cells in cluster 7; 857 genes considered as used in RACE-ID. Burst frequencies were calculated by D3E, with 332 genes called differential. Mann-Whitney non-parametric test for comparison of rank medians; p<0.001 for Kat2a WT vs. KO comparisons. (E) ChIP-quantitative PCR analysis of Myc binding in selected Kat2a acetylation target promoter peaks; mean values for 2–4 independent experiments using pooled BM or Spleen of Kat2a WT vs KO MLL-AF9 secondary leukemias. Mean enrichments: WT = 2.158, KO = 1.357, 95% CI of difference 0.01273 to 1.589; 2-way ANOVA p<0.05 for genotype contribution. (F) ChIP-quantitative PCR analysis of Gabpa binding in selected Kat2a acetylation target promoter peaks; mean values for two independent experiments using pooled BM of Kat2a WT vs KO MLL-AF9 secondary leukemias. Mean enrichments: WT = 1.775, KO = 0.9609, 95% CI of difference 0.2640 to 1.364; 2-way ANOVA p<0.01 for genotype contribution.
Figure 5—figure supplement 1.
Figure 5—figure supplement 1.. ChIP identification of regulatory regions in primary MLL-AF9 leukemia.
(A) Localization of H3K4 tri-methyl (me3) peaks relative to the transcriptional start site (TSS) in Kat2a WT and Kat2a KO primary MLL-AF9 leukemias. (B) Localization of H3K4 mono-methyl (me1) peaks relative to the transcriptional start site (TSS) in Kat2a WT and Kat2a KO primary MLL-AF9 leukemias. (C–D) Venn diagrams representing peak overlap between (C) H3K4me3 and (D) H3K9ac duplicate ChIP-seq experiments. (E) Distribution of H3K9 and H3K27 acetylation (ac) marks in H3K4me1 (enhancer) peaks in Kat2a WT and KO primary MLL-AF9 leukemias.
Figure 5—figure supplement 2.
Figure 5—figure supplement 2.. Loss of Kat2a affects transcription factor binding in a subset of loci.
(A) ChIP-qPCR analysis of relative enrichment in Gabpa binding at Kat2a target loci with reported Gabpa/Nrf2 binding in the ENCODE database; mean+ SEM of 2 independent experiments using pooled BM of Kat2a WT vs KO MLL-AF9 secondary leukemias; qPCR reactions performed in triplicate. (B) ChIP-qPCR analysis of relative enrichment in Myc binding at Kat2a target loci with reported Myc binding in the ENCODE database; mean+ SEM of 2–4 independent experiments using pooled BM or Spleen of Kat2a WT vs KO MLL-AF9 secondary leukemias; qPCR reactions performed in triplicate. (A–B) are alternative representations of the data in Figure 5E–F.
Figure 6.
Figure 6.. Kat2a regulates protein synthesis activity in MLL-AF9 leukemia stem-like cells.
(A) Expression of translation-associated gene signatures in individual cells along the global MLL-AF9 STEM-ID pseudotime trajectory. Trajectory representation as in Figure 4A, with both genotypes in the same plot. Gene signature defined as per the representation of gene sets MORF_EIF4E, MORF_EIF3S2, MORF_EIF4A2, MORF_EIF3S6 (MSigDB) in the Robust geneset. (B) Polysomal profiling of MOLM-13 cells upon overnight treatment with DMSO or the Kat2a inhibitor MB-3 (Biel et al., 2004) (200 μM); data are representative of 2 independent experiments. (C) Flow cytometry plot of OP-Puro incorporation by phenotypic L-GMP isolated from spleens of MLL-AF9 secondary leukemias WT or KO for the Kat2a gene. This pattern was observed in 2 out of 3 Kat2a KO leukemias analysed (0/3 WT). (D) Quantitation of protein synthesis rate in Kat2a WT and KO L-GMP as measured by OP-Puro incorporation. Mean ± SEM; n = 3 individual leukemia samples/genotype; *p<0.001. (E) Proportion of colonies types in CFC assays of Kat2a WT cells treated with DMSO vs. S6K1 PF4708671 inhibitor, mean + SEM, n = 3, ***p<0.001, *p<0.05. 2-tailed paired t-test performed in (D) and (E).

Similar articles

Cited by

References

    1. Ahrends R, Ota A, Kovary KM, Kudo T, Park BO, Teruel MN. Controlling low rates of cell differentiation through noise and ultrahigh feedback. Science. 2014;344:1384–1389. doi: 10.1126/science.1252079. - DOI - PMC - PubMed
    1. Ai S, Xiong H, Li CC, Luo Y, Shi Q, Liu Y, Yu X, Li C, He A. Profiling chromatin states using single-cell itChIP-seq. Nature Cell Biology. 2019;21:1164–1172. doi: 10.1038/s41556-019-0383-5. - DOI - PubMed
    1. Aizarani N, Saviano A, Sagar, Mailly L, Durand S, Herman JS, Pessaux P, Baumert TF, Grün D. A human liver cell atlas reveals heterogeneity and epithelial progenitors. Nature. 2019;572:199–204. doi: 10.1038/s41586-019-1373-2. - DOI - PMC - PubMed
    1. Antolović V, Miermont A, Corrigan AM, Chubb JR. Generation of Single-Cell transcript variability by repression. Current Biology. 2017;27:1811–1817. doi: 10.1016/j.cub.2017.05.028. - DOI - PMC - PubMed
    1. Auerbach RK, Chen B, Butte AJ. Relating genes to function: identifying enriched transcription factors using the ENCODE ChIP-Seq significance tool. Bioinformatics. 2013;29:1922–1924. doi: 10.1093/bioinformatics/btt316. - DOI - PMC - PubMed

Publication types

Associated data