. 2020 Feb 3;219(2):e201904048.
doi: 10.1083/jcb.201904048.

IRE1β negatively regulates IRE1α signaling in response to endoplasmic reticulum stress

Affiliations

IRE1β negatively regulates IRE1α signaling in response to endoplasmic reticulum stress

Michael J Grey et al. J Cell Biol. .

Abstract

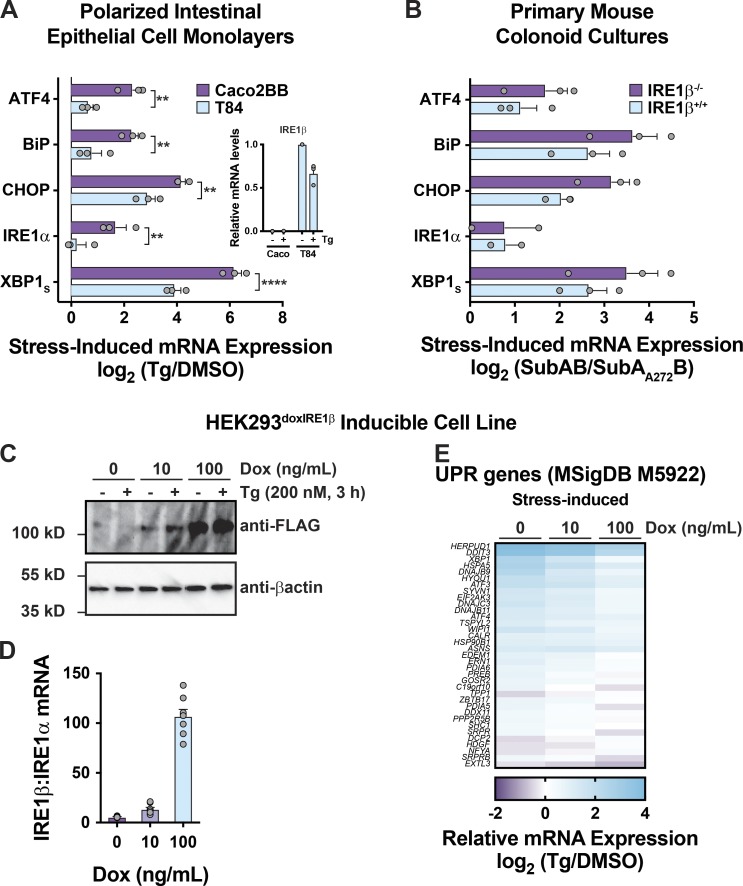
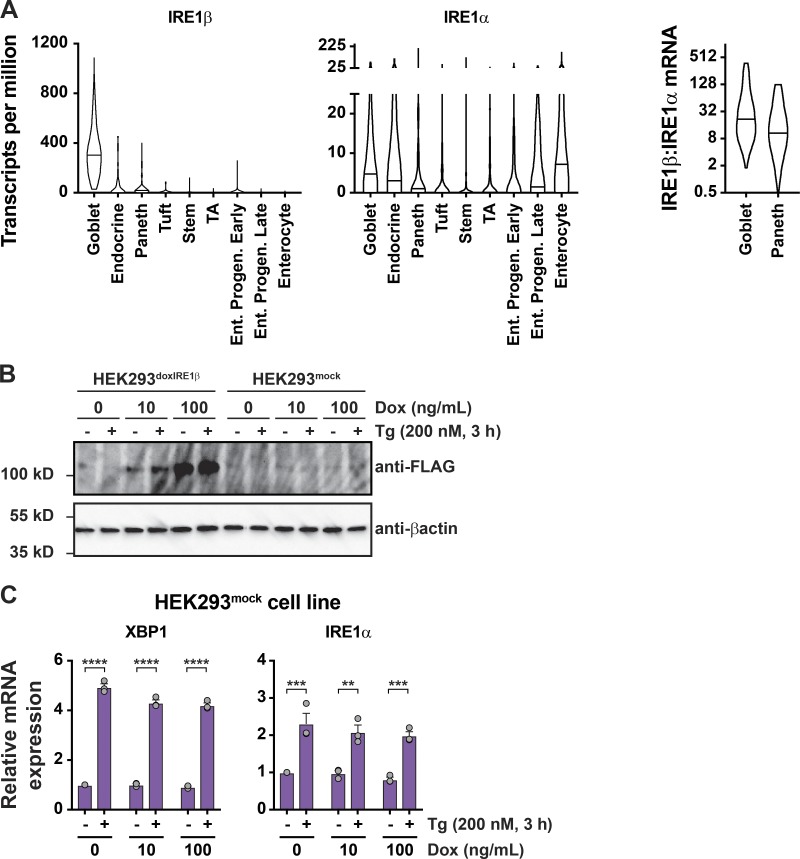
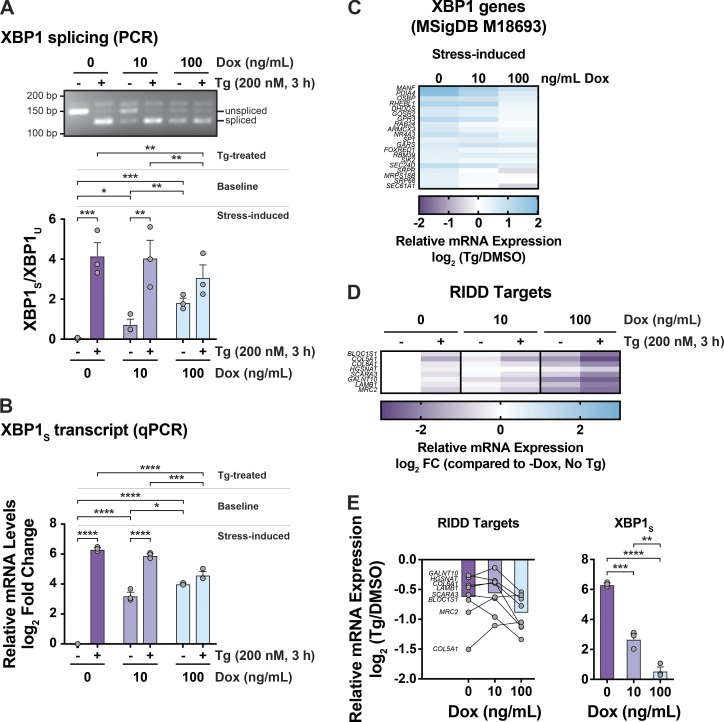
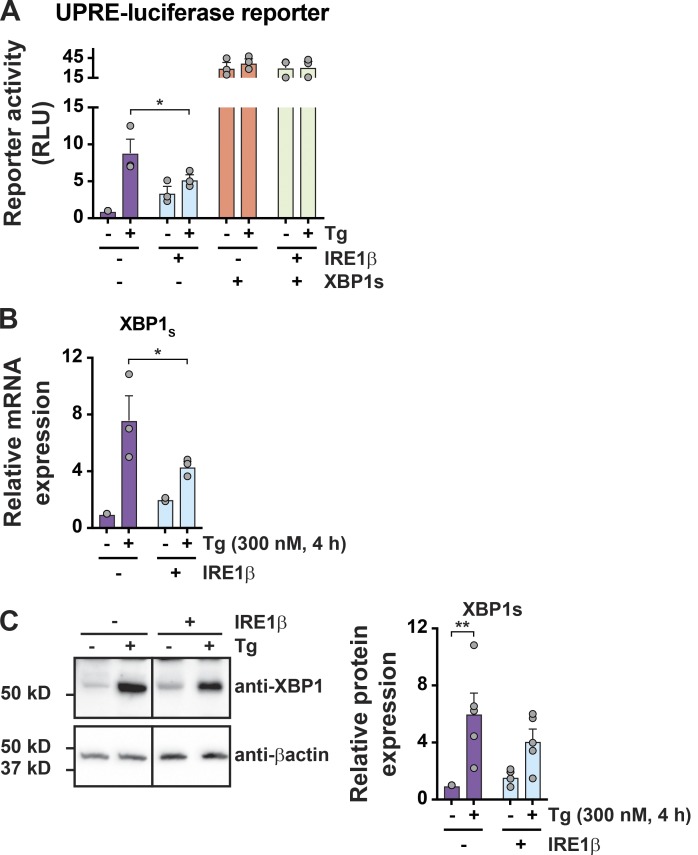
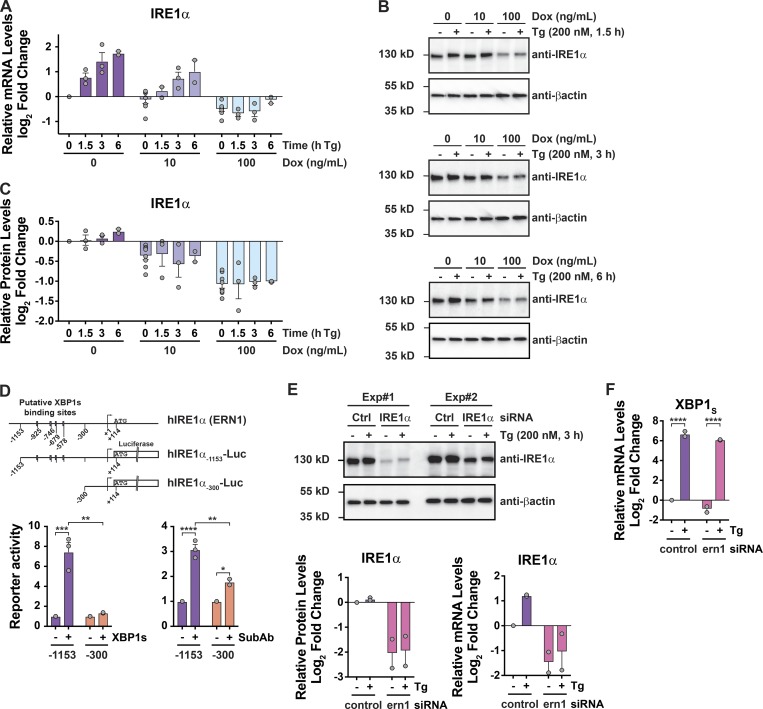
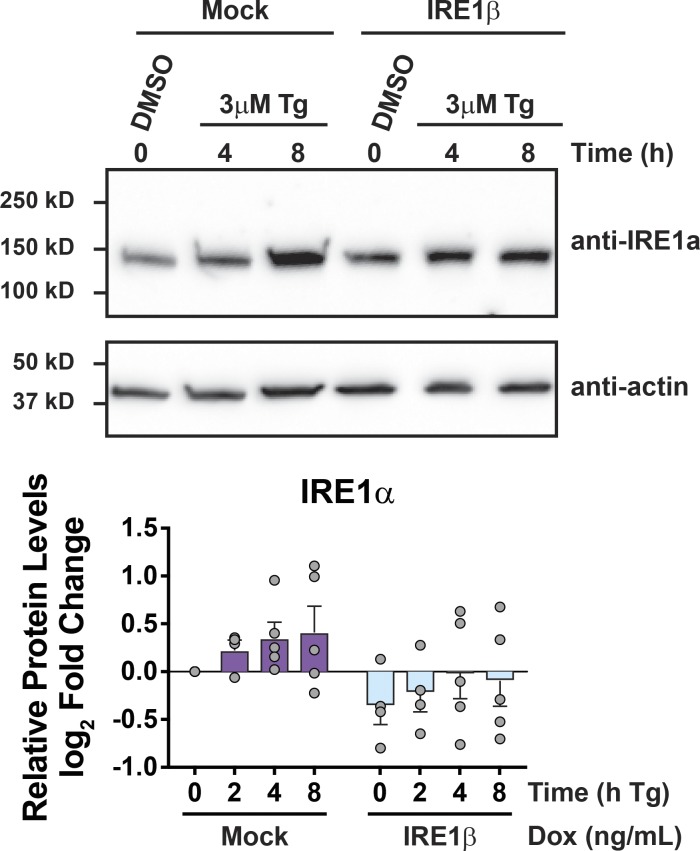
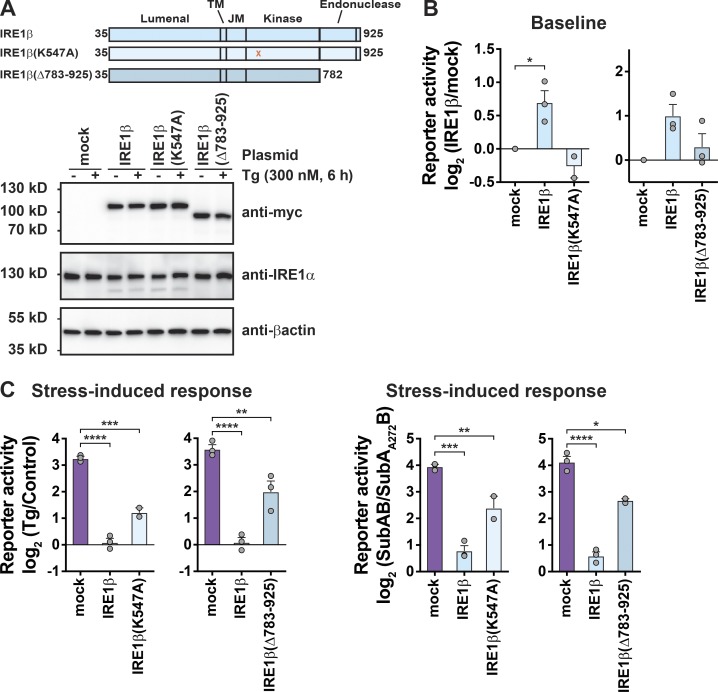
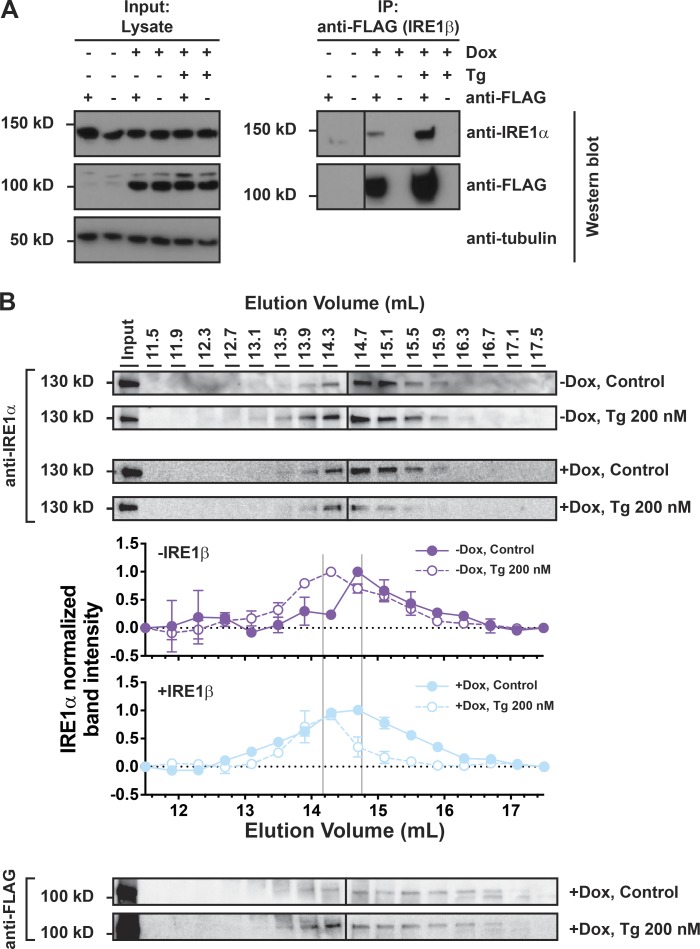
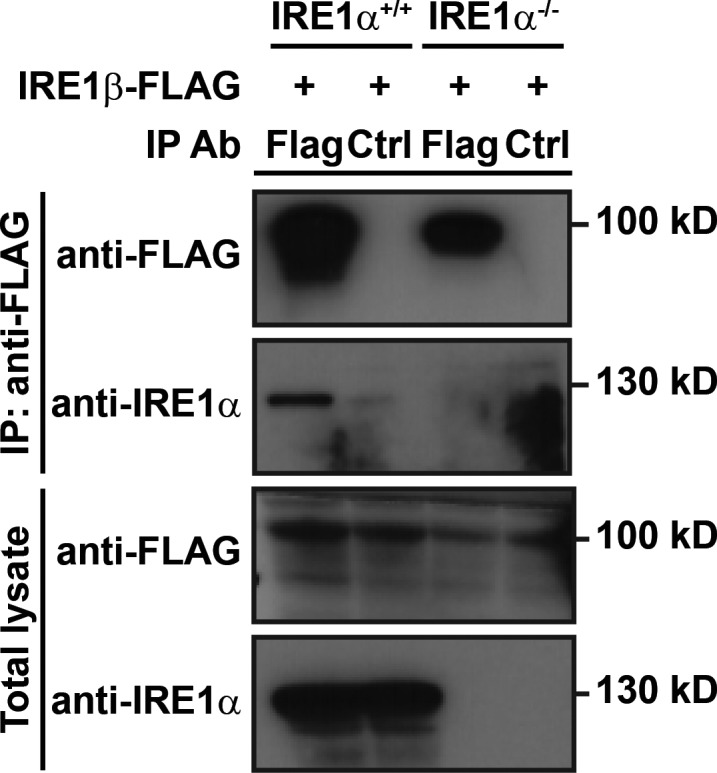
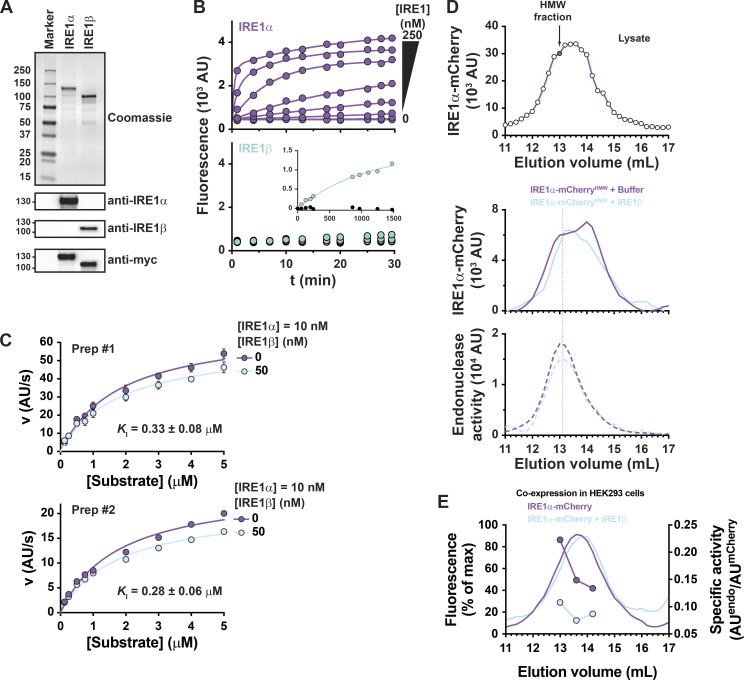
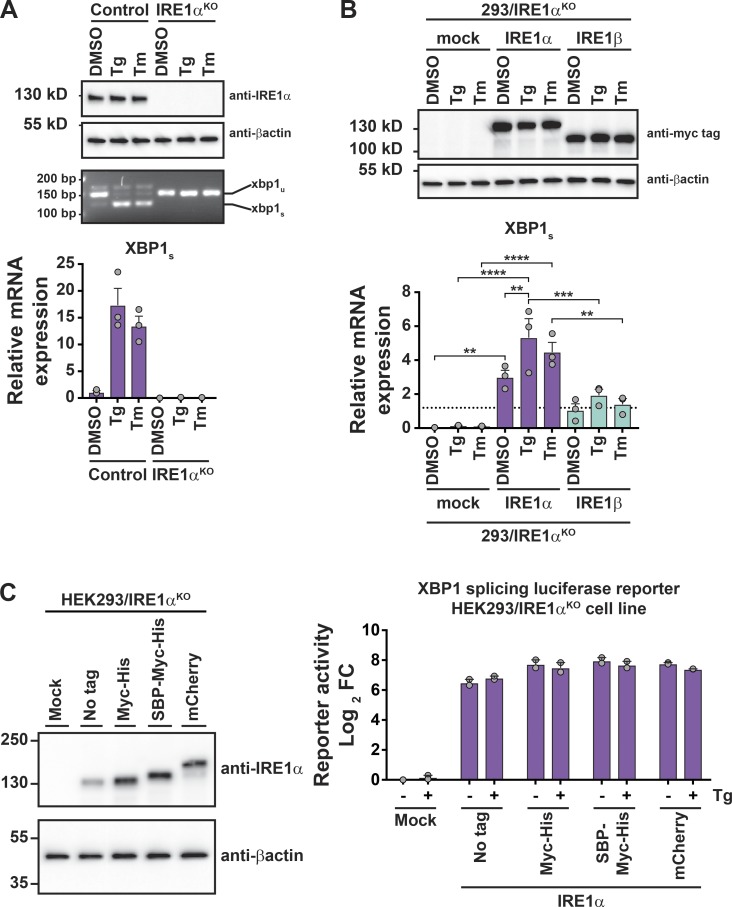
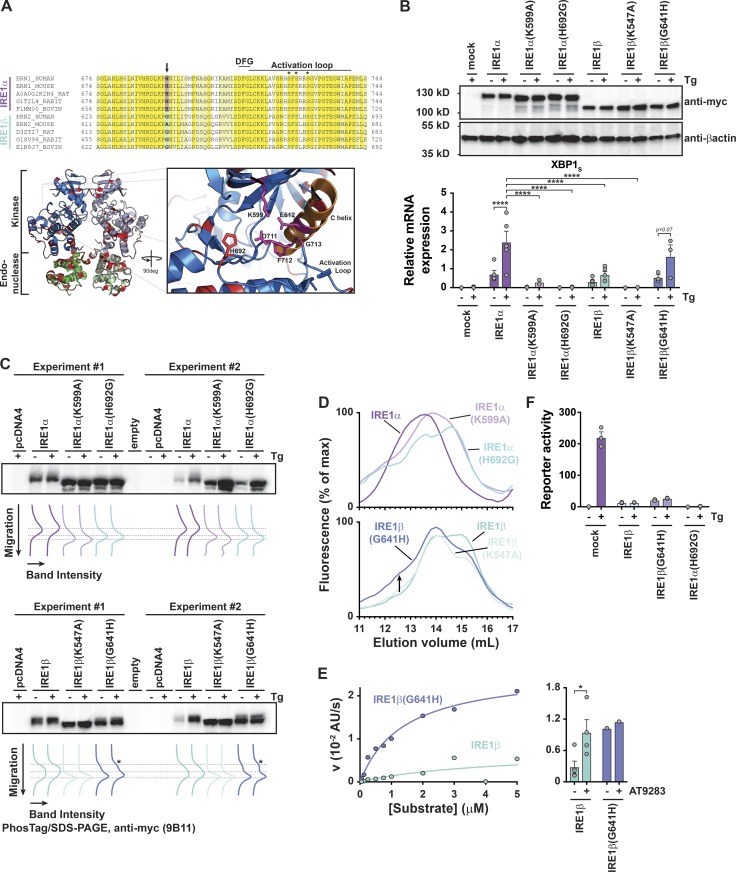
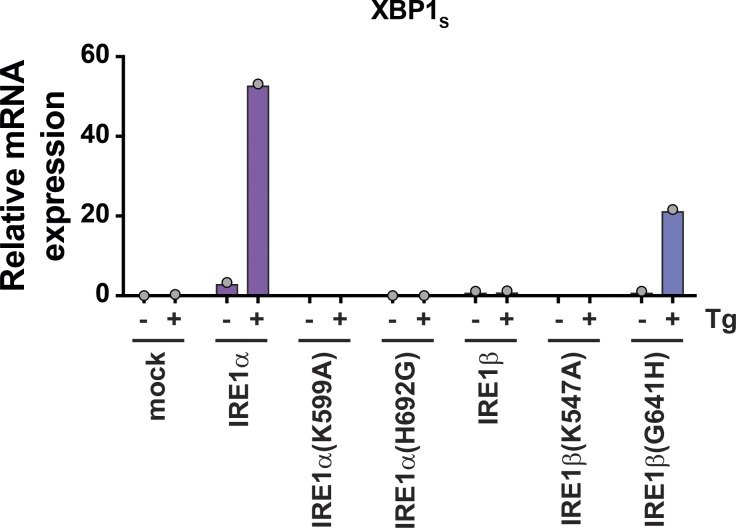
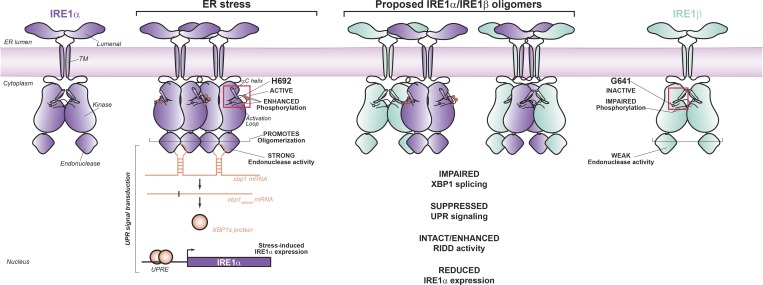
IRE1β is an ER stress sensor uniquely expressed in epithelial cells lining mucosal surfaces. Here, we show that intestinal epithelial cells expressing IRE1β have an attenuated unfolded protein response to ER stress. When modeled in HEK293 cells and with purified protein, IRE1β diminishes expression and inhibits signaling by the closely related stress sensor IRE1α. IRE1β can assemble with and inhibit IRE1α to suppress stress-induced XBP1 splicing, a key mediator of the unfolded protein response. In comparison to IRE1α, IRE1β has relatively weak XBP1 splicing activity, largely explained by a nonconserved amino acid in the kinase domain active site that impairs its phosphorylation and restricts oligomerization. This enables IRE1β to act as a dominant-negative suppressor of IRE1α and affect how barrier epithelial cells manage the response to stress at the host-environment interface.


Figures

Figure 1.
Figure 1.
Cells expressing IRE1β exhibit attenuated UPR signaling. (A) Tg-induced mRNA expression of UPR genes assayed by qPCR for polarized Caco2 and T84 monolayers (log2 [Tg-treated/DMSO control], n = 3). (B) Subtilase cytotoxin-induced mRNA expression of UPR genes assayed by qPCR for IRE1β+/+ and IRE1β−/− mouse primary colonoids (log2 [SubAB-treated/SubAA272B-treated], n = 3). (C) IRE1β expression assayed by immunoblot (representative of three experiments). (D) IRE1β/IRE1α transcript ratio assayed by qPCR (n = 8). (E) Stress-induced differential expression of UPR markers (Tg compared with DMSO) was assayed by RNA-seq for HEK293doxIRE1β cells treated with Dox and Tg as indicated (n = 3). The anti-FLAG and anti-βactin immunoblots are duplicated in Fig. S1 B and Fig. 3 B, as the same experiment was used to assess expression in mock-transduced cells (Fig. S1 B) and IRE1α expression (Fig. 3 B). Bars and error bars represent mean values ± SEM; significance is indicated by asterisks (*, P < 0.05; **, P < 0.01; ***, P < 0.001; ****, P < 0.0001).
Figure S1.
Figure S1.
Expression of IRE1β in intestinal epithelial cells and cell models. Supports Fig. 1. (A) Violin plots for expression of IRE1β and IRE1α transcripts in transcriptionally defined cell populations from mouse small intestine. Lines indicated median values. Data are from GSE92332 (Haber et al., 2017). The ratio of IRE1β/IRE1α expression for individual cells is plotted for goblet and Paneth cell populations. (B) IRE1β protein expression (top) and XBP1 and IRE1α mRNA expression for HEK293mock cell line treated Dox and Tg as indicated (bottom; n = 3). The anti-FLAG and anti-βactin blots are duplicated from Fig. 1 C to include HEK293doxIRE1β cells and HEK293mock cells from the same experiment. Bars and error bars represent mean values ± SEM; significance is indicated by asterisks (*, P < 0.05; **, P < 0.01; ***, P < 0.001; ****, P < 0.0001).
Figure 2.
Figure 2.
IRE1β suppresses IRE1α–XBP1 signaling. (A and B) XBP1 splicing was assayed by (A) PCR and gel electrophoresis to detect spliced and unspliced XBP1 or (B) qPCR to detect spliced XBP1 transcript in HEK293doxIRE1β cells treated with Dox and Tg as indicated (n = 3). (C) Same as in A, with differential expression of XBP1 genes assayed by RNA-seq. Data are shown for stress-induced expression (Tg compared with DMSO, left panel) for all genes in signature that are differentially expressed for control cells (No Dox, n = 3). (D) Same as in C for indicated RIDD targets relative to control cells (No Dox) without stress treatment (No Tg). (E) Left: Stress-induced changes in expression of RIDD targets for cells treated with indicated concentrations of Dox. Bars represent the average fold change for all targets. The symbols represent the mean fold change for an individual target gene. Right: Stress-induced fold change in spliced XBP1 transcript replotted from qPCR data in B. Bars and error bars represent mean values ± SEM; significance is indicated by asterisks (*, P < 0.05; **, P < 0.01; ***, P < 0.001; ****, P < 0.0001).
Figure S2.
Figure S2.
IRE1β suppresses XBP1 transcriptional activity. Supports Fig. 2. (A) HEK293T cells were cotransfected with UPRE-luciferase reporter and indicated plasmids, treated with Tg for 8 h, and assayed for luciferase activity. Activity is plotted relative to mock-transfected cells without Tg (n = 3). (B and C) Spliced XBP1 mRNA (B; n = 3) and XBP1 protein levels (C; n = 5) in HEK293T cells with control plasmid or IRE1β expression plasmid and treated with Tg for 4 h. Bars and error bars represent mean values ± SEM; significance is indicated by asterisks (*, P < 0.05; **, P < 0.01; ***, P < 0.001; ****, P < 0.0001).
Figure 3.
Figure 3.
Suppression of IRE1α expression does not explain how IRE1β affects the UPR. (AC) IRE1α expression was assayed by (A) qPCR for mRNA or (B) immunoblot for protein in HEK293doxIRE1β cells treated with Tg for indicated time points (immunoblots are representative of two or three independent experiments). The anti-βactin blot for the 3-h Tg treatment (fourth row down) is duplicated from Fig. 1 C, as the same experiment and membrane was used to probe for anti-FLAG (Fig. 1 C), anti-IRE1α, and anti-βactin. The actin normalized band intensities are plotted in C. For A and C, data are plotted as log2 fold change relative to 0 ng/ml Dox without Tg. Each experiment for a given time point included a control sample without Tg. (D) Top: Schematic of human IRE1α gene (ERN1) promoter region and luciferase reporter constructs. Putative XBP1 binding sites are indicated as boxes. (Bottom panel) IRE1α-Luc reporter activity in HEK293T cells (left) cotransfected with either control vector or XBP1 expression vector or (right) treated with SubAA272B or SubAB (100 ng/ml) for 8 h (n = 3). (E) IRE1α protein and mRNA levels in HEK293doxIRE1β cells transfected with IRE1α siRNA or control siRNA and treated with Tg (n = 2). (F) Same as in E for spliced XBP1 mRNA. Bars and error bars represent mean values ± SEM; significance is indicated by asterisks (*, P < 0.05; **, P < 0.01; ***, P < 0.001; ****, P < 0.0001).
Figure S3.
Figure S3.
IRE1β restricts stress-induced IRE1α expression. Supports Fig. 3. Top: IRE1α protein detected by immunoblot for HEK293T cells transiently transfected with control plasmid or IRE1β expression plasmid and treated with Tg for indicated time points. Bottom: Actin-normalized band intensities from immunoblots plotted as log2 fold change compared with untreated (no Tg) mock-transfected cells (n = 5). Bars and error bars represent mean values ± SEM.
Figure 4.
Figure 4.
IRE1β enzymatic activity is not required to suppress stress-induced XBP1 splicing. (A) Schematic of IRE1β constructs. All constructs have C-terminal Myc tag. Expression of constructs in HEK293T cells was assayed by immunoblot with anti-Myc antibody. (B and C) XBP1 splicing activity was measured using a luciferase reporter in HEK293T cells cotransfected with indicated IRE1β expression plasmids and stimulated with either Tg or SubAB. Luciferase activity is plotted (B) as the fold change relative to mock-transfected, control-treated cells at baseline or (C) as the stress-induced fold change relative to control for a given IRE1β construct (n = 3). Bars and error bars represent mean values ± SEM; significance is indicated by asterisks (*, P < 0.05; **, P < 0.01; ***, P < 0.001; ****, P < 0.0001).
Figure 5.
Figure 5.
IRE1β interacts with IRE1α. (A) IRE1α and IRE1β proteins were assayed by immunoblot with anti-IRE1α or anti-FLAG antibodies, respectively, for lysates or samples immunoprecipitated with anti-FLAG from HEK293doxIRE1β cells treated with Dox and Tg as indicated. Blots are representative of three independent experiments. (B) Oligomerization of endogenous IRE1α was assayed by gel filtration fractionation of lysates from HEK293doxIRE1β cells and immunoblot with anti-IRE1α antibody. Fraction band intensities are plotted relative to the band intensity for the input sample, which was included on each gel, and normalized to fractions with the highest relative intensity (assigned a value of 1) and lowest relative intensity (assigned a value of 0). Symbols represent mean ± range for two independent experiments.
Figure S4.
Figure S4.
IRE1β interacts with IRE1α. Supports Fig. 5. IRE1α and IRE1β protein detected by immunoblot of anti-FLAG immunoprecipitated (IP) samples or total lysates from HEK293 or HEK293/IRE1αKO cells transfected with IRE1β-FLAG expression construct. Endogenous IRE1α was detected with anti-IRE1α antibody and IRE1β was detected with anti-FLAG antibody. Blots are representative of three independent experiments.
Figure 6.
Figure 6.
IRE1β inhibits IRE1α endonuclease activity in vitro. (A) Samples of affinity-purified full-length IRE1α and IRE1β were separated on SDS-PAGE and stained with Coomassie blue or assayed by immunoblot with anti-IRE1α, anti-IRE1β, or anti-Myc antibodies. (B) In vitro endonuclease activity was assayed by monitoring cleavage of fluorescent reporter substrate (10 nM) over time for indicated concentrations of (top, purple) IRE1α or (bottom) IRE1β. Bottom, inset: Endonuclease activity monitored over 24 h for 250 nM IRE1β (light green) or buffer control (black circles). (C) Steady-state kinetics were assayed by measuring progress curves for 10 nM IRE1α or 10 nM IRE1α + 50 nM IRE1β as a function of reporter substrate concentration. Kinetic data are plotted as initial reaction velocity versus substrate concentration. Data were measured for two independent preparations of purified protein, with symbols representing mean ± SEM for three independent measures for preparation 1 (Prep#1) or values from a single measurement for preparation 2 (Prep#2). Solid lines represent best fit of a noncompetitive inhibitor model to the kinetic data. (D) Top: Gel filtration chromatogram for lysate of HEK293 cells expressing IRE1α-mCherry. A high-molecular-weight (HMW) fraction (indicated by filled symbol in top panel) was incubated with either buffer (purple traces) or purified IRE1β (100 nM, light blue traces), reinjected on gel filtration, and assayed for mCherry fluorescence (middle panel) and endonuclease activity (bottom panel). (E) Gel filtration chromatograms for lysates of HEK293 cells expressing IRE1α-mCherry alone or coexpressing IRE1α-mCherry and IRE1β-MycHis. IRE1α-mCherry elution was assayed by mCherry fluorescence (solid lines), and endonuclease activity (symbols, dashed lines) was measured for individual fractions with model XBP1 reporter substrate. Endonuclease activity is plotted as a.u. min−1 mCherry−1.
Figure S5.
Figure S5.
Expression and XBP1 splicing activity of IRE1 constructs. Supports Fig. 6. (A) IRE1α protein was assayed by immunoblot (top), spliced and unspliced XBP1 transcript was assayed by PCR and gel electrophoresis (middle), and spliced XBP1 transcript was assayed by qPCR (bottom) for HEK293 or HEK293/IRE1αKO cells treated with DMSO, Tg, or tunicamycin (Tm; n = 3). (B) IRE1 protein expression was assayed by immunoblot (top), and spliced XBP1 transcript was assayed by qPCR (bottom) for HEK293/IRE1αKO cells transfected with indicated expression vector and treated with DMSO, Tg, or tunicamycin (n = 3). (C) XBP1 splicing luciferase reporter activity for IRE1α constructs transfected in HEK293/IRE1αKO cells. Activity is plotted relative to the untreated (no Tg), mock-transfected cells. Bars represent mean of two independent experiments. Bars and error bars represent mean values ± SEM; significance is indicated by asterisks (*, P < 0.05; **, P < 0.01; ***, P < 0.001; ****, P < 0.0001).
Figure 7.
Figure 7.
IRE1β has impaired phosphorylation and does not form higher-order oligomers. (A) XBP1 splicing luciferase reporter activity measured for HEK293T cells cotransfected with reporter and control vector or IRE1α(K599A) expression vector. Bars and error bars represent mean values ± SEM; significance is indicated by asterisks (*, P < 0.05; **, P < 0.01; ***, P < 0.001; ****, P < 0.0001). (B) Gel filtration chromatograms for lysates of HEK293 cells transfected with IRE1α-mCherry or IRE1α-mCherry + IRE1α(K599A). IRE1α elution was monitored by mCherry fluorescence (solid lines) and endonuclease activity was measured for indicated fractions (symbols and dashed lines). (C) In vitro kinase activity measured for purified full-length IRE1α and IRE1β using ADP-Glo luciferase assay. Bars represent values from a single experiment. Results are representative of two independent experiments that have variable baseline (buffer control) luminescence (RLU, relative luminescence). (D) Schematic of IRE1α and IRE1β kinase domains illustrates positions of phosphorylation sites detected by mass spectrometry. Indicated sites were detected in two independent preparations of purified protein. (E) Gel filtration chromatograms for lysates of HEK293 cells transfected with IRE1α-mCherry or IRE1β-mCherry expression vectors, with IRE1 elution monitored by mCherry fluorescence. Chromatograms are representative of more than five independent experiments. Elution positions of proteins with known molecular weight are indicated above chromatogram. Schematic of putative IRE1 oligomerization states are shown below chromatograms. (F) Same as in E for expression and analysis IRE1α-mCherry, IRE1α(K599A)-mCherry, IRE1β-mCherry, and IRE1β(K547A)-mCherry constructs.
Figure 8.
Figure 8.
A nonconserved amino acid in the kinase domain active site regulates IRE1 endonuclease activity. (A) Top: Sequence alignment for IRE1α and IRE1β active site and activation loop residues. Conserved sequences are colored yellow (identical) and light yellow (similar). Bottom, left: Ribbon diagram of human IRE1α kinase and endonuclease domains (PDB 5HGI; Feldman et al., 2016). Residue positions that are not conserved between IRE1α and IRE1β are colored red. Bottom, right: Cartoon illustrates close-up view of kinase domain active site and position of H692 side chain. (B) IRE1 expression was assayed by immunoblot (anti-Myc; top) and expression of spliced qPCR transcript was assayed by qPCR for HEK293/IRE1αKO cells transfected with indicated construct (bottom). (C) Samples from B (two independent experiments) were assayed for phosphorylation status by PhosTag/SDS-PAGE and immunoblot with anti-Myc antibody. Band migration position and intensity are plotted under the blot. Lines indicate the migration position of different phosphorylation species. (D) Gel filtration chromatograms for lysates of HEK293 cells transfected with indicated IRE1-mCherry constructs. Chromatograms are representative of at least two independent experiments. (E) Left: In vitro endonuclease activity measured for affinity-purified IRE1β and IRE1β(G641H) under steady-state conditions. Reaction velocities were measured as a function of substrate concentration using 10 nM enzyme. Lines show best fit of Michaelis–Menten equation with KM = 4 ± 8 µM and Vmax = 0.007 ± 0.008 a.u. s−1 for IRE1β and KM = 1.4 ± 0.2 µM and Vmax = 0.027 ± 0.001 a.u. s−1 for IRE1β(G641H). Right: In vitro endonuclease activity measured for 10 nM enzyme and 1 µM XBP1 reporter substrate in the presence or absence of 100 µM AT9283 kinase inhibitor. (F) XBP1 splicing luciferase reporter activity for HEK293 cells were transfected with indicated IRE1 constructs and treated with Tg (300 nM for 4 h, n = 3). In B, E, and F, bars and error bars represent mean values ± SEM; significance is indicated by asterisks (*, P < 0.05; **, P < 0.01; ***, P < 0.001; ****, P < 0.0001).
Figure S6.
Figure S6.
IRE1β-G641H mutant rescues XBP1 splicing. Supports Fig. 8 B. Spliced XBP1 transcript assayed by qPCR for HEK293/IRE1αKO cells transfected with indicated IRE1 constructs and treated with Tg. Bars represent a single independent experiment. These data were not included in Fig. 8 B because the response measured for IRE1α- and IRE1β(G641H)-transfected cells in this experiment was ∼10-fold greater in magnitude than any of the other experiments. Although not included in the analysis in Fig. 8 B, the results from this experiment further support the conclusion that IRE1α(H692G) abolishes XBP1 splicing and IRE1β(G641H) rescues stress-induced XBP1 splicing activity.
Figure 9.
Figure 9.
IRE1β functions as a dominant-negative suppressor of IRE1α signaling. Schematic illustrates model for IRE1β interacting with IRE1α oligomers in a manner to suppress stress-induced XBP1 splicing.

References

    1. Acosta-Alvear D., Zhou Y., Blais A., Tsikitis M., Lents N.H., Arias C., Lennon C.J., Kluger Y., and Dynlacht B.D.. 2007. XBP1 controls diverse cell type- and condition-specific transcriptional regulatory networks. Mol. Cell. 27:53–66. 10.1016/j.molcel.2007.06.011 - DOI - PubMed
    1. Amin-Wetzel N., Saunders R.A., Kamphuis M.J., Rato C., Preissler S., Harding H.P., and Ron D.. 2017. A J-Protein Co-chaperone Recruits BiP to Monomerize IRE1 and Repress the Unfolded Protein Response. Cell. 171:1625–1637. - PMC - PubMed
    1. Bertolotti A., Zhang Y., Hendershot L.M., Harding H.P., and Ron D.. 2000. Dynamic interaction of BiP and ER stress transducers in the unfolded-protein response. Nat. Cell Biol. 2:326–332. 10.1038/35014014 - DOI - PubMed
    1. Bertolotti A., Wang X., Novoa I., Jungreis R., Schlessinger K., Cho J.H., West A.B., and Ron D.. 2001. Increased sensitivity to dextran sodium sulfate colitis in IRE1beta-deficient mice. J. Clin. Invest. 107:585–593. 10.1172/JCI11476 - DOI - PMC - PubMed
    1. Calfon M., Zeng H., Urano F., Till J.H., Hubbard S.R., Harding H.P., Clark S.G., and Ron D.. 2002. IRE1 couples endoplasmic reticulum load to secretory capacity by processing the XBP-1 mRNA. Nature. 415:92–96. 10.1038/415092a - DOI - PubMed

MeSH terms