. 2020 Jan 27;15(1):e0224301.
doi: 10.1371/journal.pone.0224301. eCollection 2020.

Optogenetic mapping of feeding and self-stimulation within the lateral hypothalamus of the rat

Affiliations

Optogenetic mapping of feeding and self-stimulation within the lateral hypothalamus of the rat

Kevin R Urstadt et al. PLoS One. .

Abstract

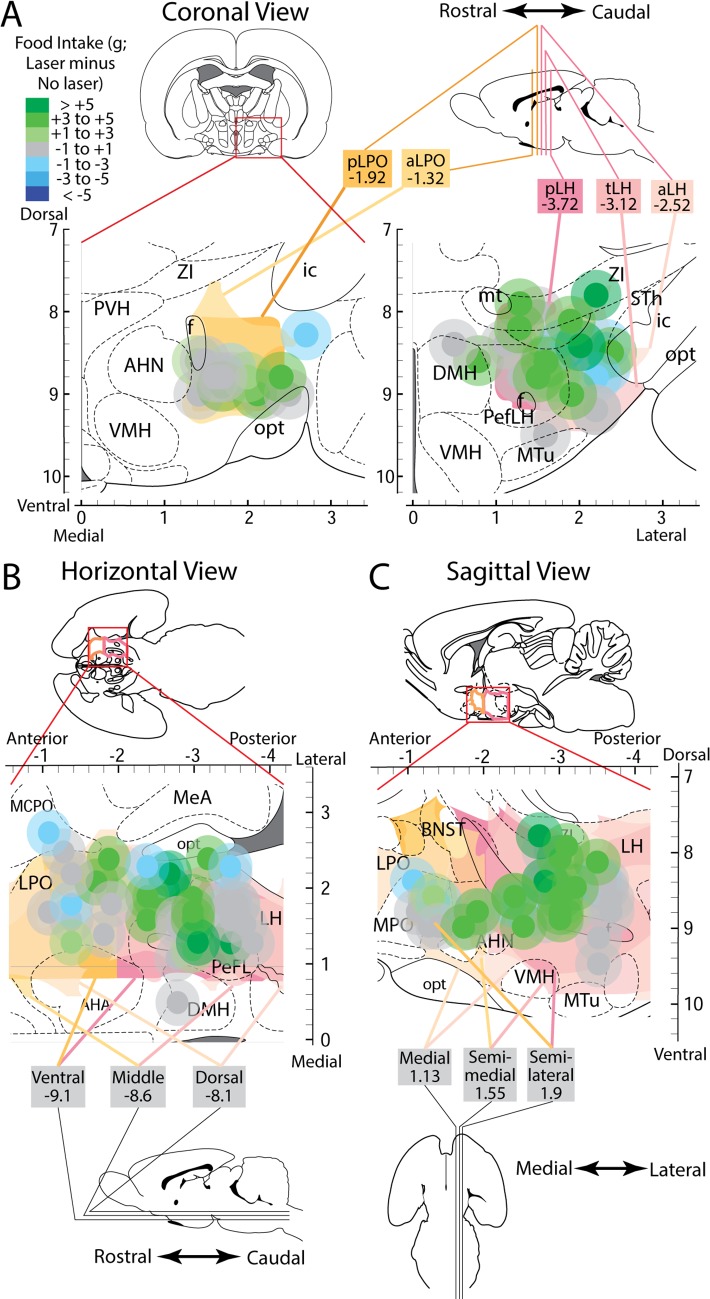
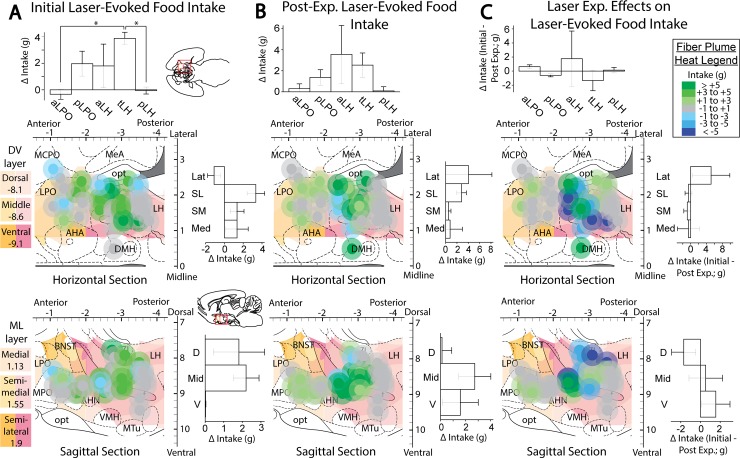
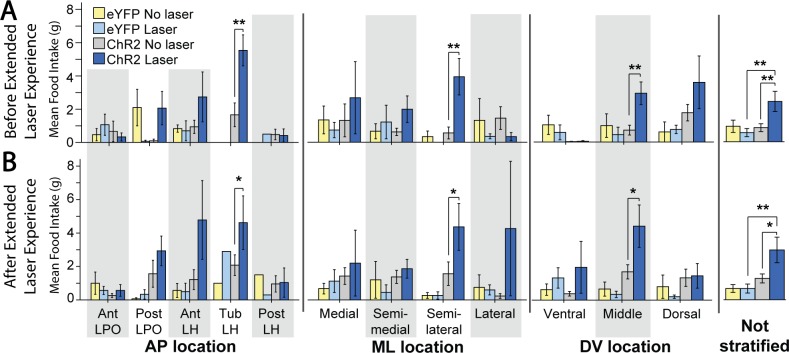
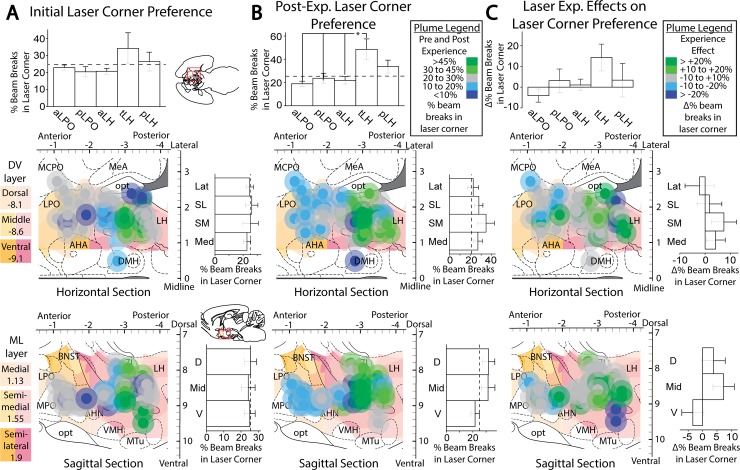
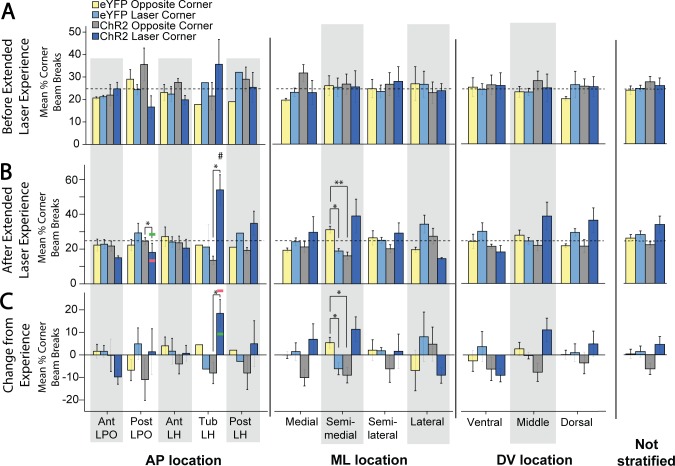
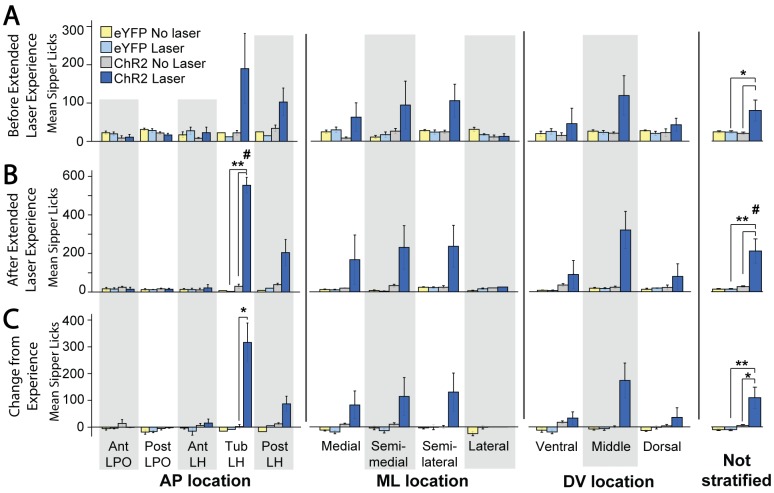
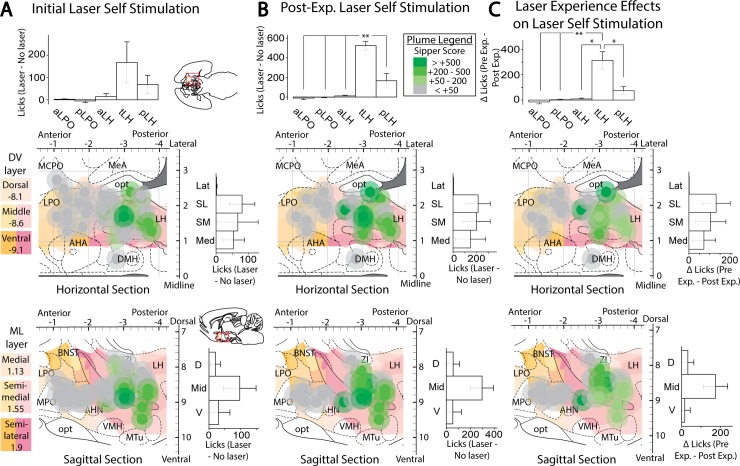
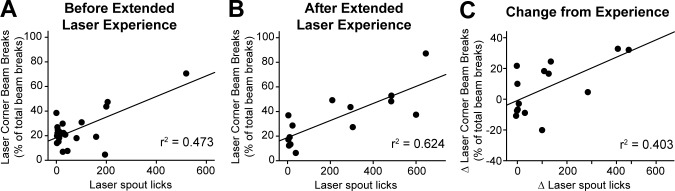
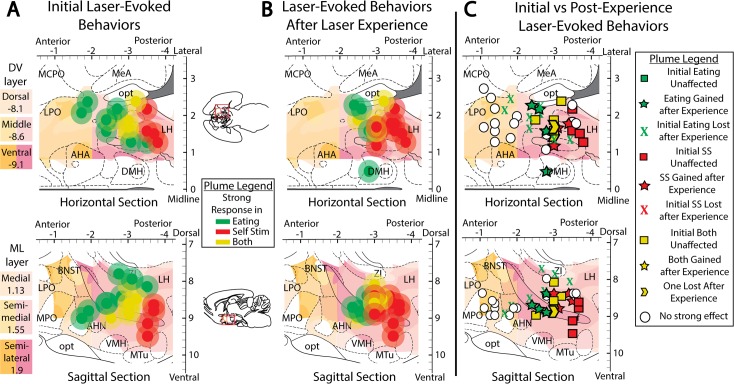
The lateral hypothalamus (LH) includes several anatomical subregions involved in eating and reward motivation. This study explored localization of function across different LH subregions in controlling food intake stimulated by optogenetic channelrhodopsin excitation, and in supporting laser self-stimulation. We particularly compared the tuberal LH subregion, the posterior LH subregion, and the lateral preoptic area. Local diameters of tissue optogenetically stimulated within the LH were assessed by measuring laser-induced Fos plumes and Jun plumes via immunofluorescence surrounding optic fiber tips. Those plume diameters were used to map localization of function for behavioral effects elicited by LH optogenetic stimulation. Optogenetic stimulation of the tuberal subsection of the LH produced the most robust eating behavior and food intake initially, but produced only mild laser self-stimulation in the same rats. However, after repeated exposures to optogenetic stimulation, tuberal LH behavioral profiles shifted toward more self-stimulation and less food intake. By contrast, stimulation of the lateral preoptic area produced relatively little food intake or self-stimulation, either initially or after extended stimulation experience. Stimulation in the posterior LH subregion supported moderate self-stimulation, but not food intake, and at higher laser intensity shifted valence to evoke escape behaviors. We conclude that the tuberal LH subregion may best mediate stimulation-bound increases in food intake stimulated by optogenetic excitation. However, incentive motivational effects of tuberal LH stimulation may shift toward self-stimulation behavior after repeated stimulation. By contrast, the lateral preoptic area and posterior LH do not as readily elicit either eating behavior or laser self-stimulation, and may be more prone to higher-intensity aversive effects.


Conflict of interest statement

The authors have declared that no competing interests exist.

Figures

Fig 1
Fig 1. Experimental timeline and design.
All subjects underwent the following process depicted here. Each new task is started the following day (denoted by a red arrow) unless a longer time elapses as stated.
Fig 2
Fig 2. Examples of virus expression (green) and Fos-like immunoreactivity (red) in different treatment conditions.
A: Hemisection of a coronal map modified from a rat brain atlas (29). B: an inset of the lateral hypothalamus expanded out, giving an example of a robust ChR2 laser-induced Fos plume. C, D: Examples of virus and Fos expression in animals that received ChR2 virus without laser stimulation and eYFP virus with laser stimulation. E. Average intensity of Fos granules inside vs outside plumes for each experimental group and condition. Scale bars represent 100 μm unless otherwise stated. *: p < 0.05.
Fig 3
Fig 3. Fos and Jun plume measurement process.
A: Fos plume from Fig 2 overlaid with an eight radial arm set of boxes for neuronal counting. Yellow and orange outlines represent elevation in neuronal Fos expression in ChR2 brains versus eYFP brains after both receive similar laser illumination. B: Jun plume from the same brain section. C: Overlap of Fos (red) and Jun (green) expression in the same brain. Optogenetic Jun plumes overlap almost exclusively within Fos plumes. D: Photomicrograph from the same brain section but in the dorsomedial hypothalamus, showing non-overlapping Fos and Jun expression. Scale bars represent 100 μm unless otherwise stated.
Fig 4
Fig 4. Fos and Jun plume metrics.
A: Calculated average Fos plume. B: Calculated average Jun plume. C: Distance of elevated Fos and Jun expression relative to brains with inactive virus.
Fig 5
Fig 5. Fos/Jun plumes and associated laser-mediated food intake intensities localized to stereotaxic atlas maps.
Placements were localized in along the AP axis to the LPO (A, left) and LH (A, right), along the ML axis (B), and along the DV axis (C). Different anatomical levels within these axes were topographically layered and colored to show levels of the LPO in shades of orange and levels of LH in shades of pink. Plumes were colored to show magnitude of behavioral laser-elicited food intake change versus baseline intake levels, with outer plumes made translucent.
Fig 6
Fig 6. Anatomical localization of laser-mediated food intake.
Fos plume placement maps demonstrating laser effects on food intake in ChR2 subjects prior to (A), after (B), and magnitude of change due to (C) extended laser exposure. Plume locations are mapped onto horizontal and sagittal portions of stereotaxic atlas pages (29). Each dot represents one subject’s unilateral Fos plume scaled to estimated size of 200+% of baseline expression, and color represents magnitude of eating response (defined as the individual’s intake difference between laser and no laser conditions). Bilateral placements are both overlaid onto the same unilateral diagram. Bar graphs represent intake difference scores (defined as group’s average laser session intake minus average non-laser session intake, assessed separately for different anatomical levels). Bar graphs depict change in intake in grams, calculated as intake under laser stimulation minus intake without laser stimulation in panels A and B, and then post-experience change in intake minus pre-experience change in intake in panel C. Brain area abbreviations: AHA—anterior hypothalamic area; BNST–bed nucleus of stria terminalis; DMH–dorsomedial hypothalamus, HDB–horizontal diagonal band of Broca; LH–lateral hypothalamus; LPO–lateral preoptic area; MCPO–magnocellular preoptic area; MeA–medial amygdala; opt–optic tract; VP–ventral pallidum; ZI–zona incerta. Bar graph labels: Lat–lateral; SL–semi-lateral; SM–semi-medial; Med–medial; D–dorsal; Mid–middle; V–ventral. *: p < 0.05, **: p < 0.01.
Fig 7
Fig 7. Laser-elicited intake comparisons between groups.
Food intake for each virus group with or without laser, subdivided into AP, ML, or DV axis subgroups or for entire LH groups combined. A: Intake amounts prior to extended laser exposure. B. Intake amounts after extended laser exposure. *: p < 0.05, **: p < 0.01.
Fig 8
Fig 8. Anatomical localization of place-based self-stimulation.
Fos plume maps demonstrating place-based laser self-administration in ChR2 subjects prior to (A), after (B), and due to (C) induction. Data depict percent of total entries or movements in laser-delivering corner versus other corners; dotted lines represent levels due to chance. Figure conventions and abbreviations are similar to previous mapping figures. Bar graphs represent laser corner entries for different anatomical subregions. *: p < 0.05, **: p < 0.01.
Fig 9
Fig 9. Place-based laser self-administration comparison between groups.
These data depict percent of entries into laser-delivering corner compared to alternative corners, comparing ChR2 rats versus eYFP control rats. These data are subdivided into AP, ML, or DV axis levels, or presented for entire LH group combined. A: Corner preferences prior to extended laser exposure. B. Corner preferences after extended laser experience. C: Changes in corner preferences due to extended laser exposure. *: p < 0.05; **: p < 0.01; #: comparison of tLH ChR2 laser corner preference after vs before extended later experience, p < 0.05; green and pink horizontal bars represent male and female mean scores in that group.
Fig 10
Fig 10. Active laser self-administration on spout-touch task, compared between groups.
These ChR2 versus eYFP data are subdivided into AP, ML, or DV axis subgroups, or presented for entire LH group combined. A: Spout contacts prior to extended laser exposure. B. Spout contacts after extended laser exposure. C: Changes in spout contacts due to extended laser exposure. *: p < 0.05; **: p < 0.01; #: comparison of ChR2 laser corner preference after vs before extended later experience, p < 0.05.
Fig 11
Fig 11. Anatomical localization of spout-touch self-stimulation.
Fos plume maps demonstrating spout-touch laser self-administration in ChR2 rats prior to (A), after (B), and magnitude of change due to (C) extended laser exposure. Data depicts spout touch score–the difference of laser-associated spout touches minus alternative non-laser spout touches. Figure conventions and abbreviations are the same as the prior mapping figures. Bar graphs represent spout-touch difference scores (average laser licks minus average non-laser licks) for each LH site. *: p < 0.05, **: p < 0.01.
Fig 12
Fig 12. Relationship between the outcomes of two laser self-stimulation tasks.
Correlation plots showing the relationship between place-based laser self-administration and active spout-touch laser self-administration, before (A), after (B), and change due to (C) extended laser exposure.
Fig 13
Fig 13. Extended laser experience alters distribution of strong eaters vs strong self-stimulators.
Fos plume maps showing strong laser-bound eating (> 3 g) and/or strong laser self-administration (> 200 laser spout touches) in ChR2 subjects before (A) and after (B) extended laser exposure, as well as how extended laser exposure altered behaviors in each rat mapped here (C). Scores were obtained by subtracting non-laser from laser results for each experiment type. Map conventions are the same as in prior figures.
Fig 14
Fig 14. Different LH laser intensities evoke different behavioral effects.
Line graphs show behavior prior to, during, and immediately after laser stimulation at designated laser power intensities. A and B: 0.2 and 5 mW laser power effects on inactivity. C: 5 mW laser stimulates increases in eating. D: 10mW laser stimulation increases running. Brackets with asterisks denote differences between laser periods versus pre/post no-laser periods for the ChR2 subject group; *: p < 0.05, **: p < 0.01. Pound sign denotes a significant difference between ChR2 vs eYFP groups; p < 0.05.
Fig 15
Fig 15. Other behavioral effects of different LH laser intensities.
Line graphs depicting difference scores–derived by subtracting interim period counts from laser period counts–for eYFP and ChR2 groups at increasing laser power outputs. The behaviors depicted are eating (A), cage crossing (B), running (C), and doing nothing (D). A black asterisk denotes significant difference between eYFP and ChR2 groups at that laser power, whereas a pink asterisk denotes significant difference between eYFP female and ChR2 female groups; *: p < 0.05, **: p < 0.01. Pink and green symbols represent the means for female and male rats, respectively.

Similar articles

Cited by

References

    1. Elias CF, Kelly JF, Lee CE, Ahima RS, Drucker DJ, Saper CB, et al. Chemical characterization of leptin-activated neurons in the rat brain. J Comp Neurol. 2000. July 24;423(2):261–81. - PubMed
    1. Lee DJ, Elias GJB, Lozano AM. Neuromodulation for the treatment of eating disorders and obesity. Ther Adv Psychopharmacol. 2018. February;8(2):73–92. 10.1177/2045125317743435 - DOI - PMC - PubMed
    1. Herrick CJ. The morphology of the forebrain in amphibia and reptilia. J Comp Neurol Psychol. 20(5):413–547.
    1. Krieg WJS. The hypothalamus of the albino rat. J Comp Neurol. 1932;55(1):19–89.
    1. Anand BK, Brobeck JR. Hypothalamic control of food intake in rats and cats. Yale J Biol Med. 1951. November;24(2):123–40. - PMC - PubMed

Publication types