. 2020 Jan 27;15(1):e0227699.
doi: 10.1371/journal.pone.0227699. eCollection 2020.

Effect of voicing and articulation manner on aerosol particle emission during human speech

Affiliations

Effect of voicing and articulation manner on aerosol particle emission during human speech

Sima Asadi et al. PLoS One. .

Abstract

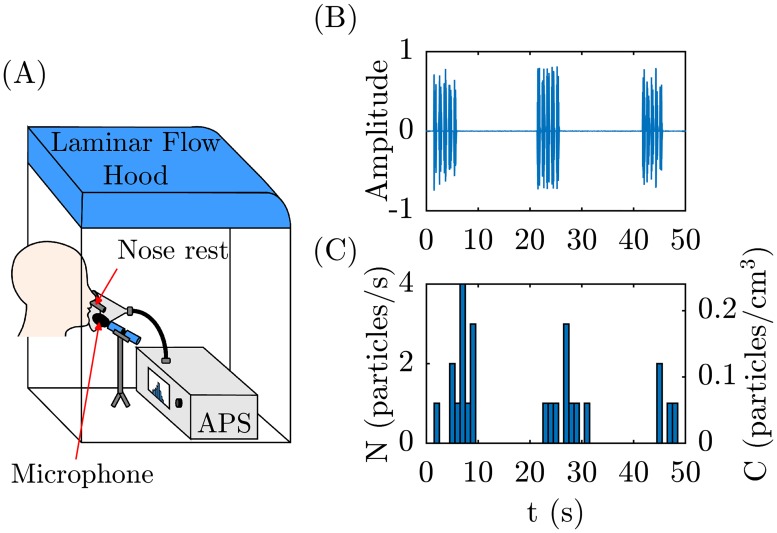
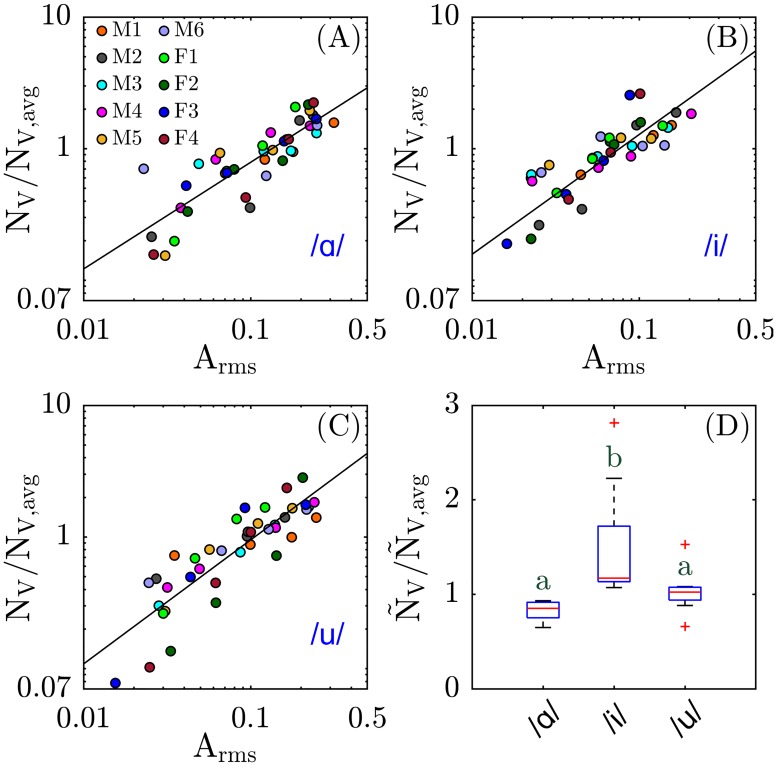
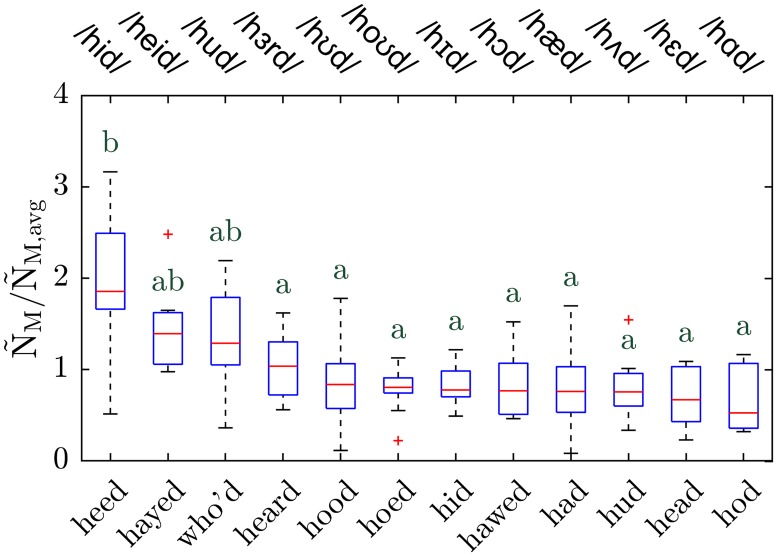
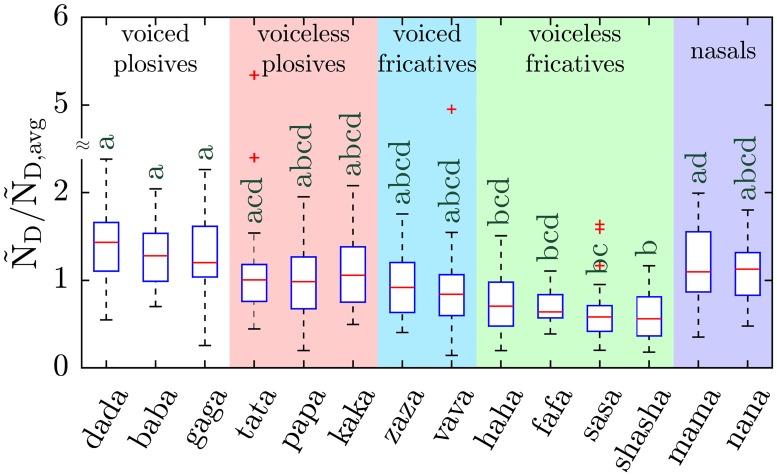
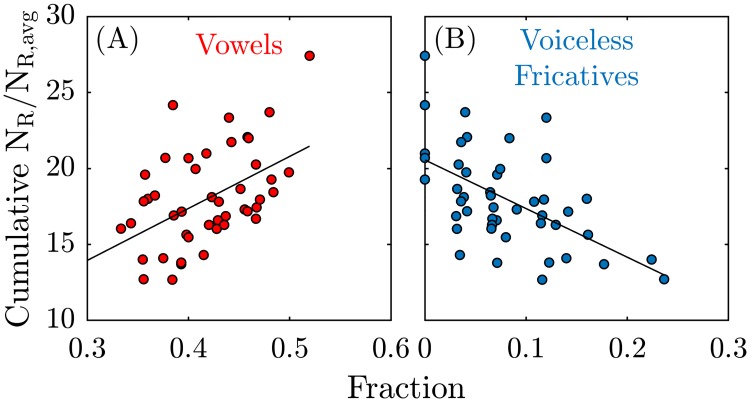
Previously, we demonstrated a strong correlation between the amplitude of human speech and the emission rate of micron-scale expiratory aerosol particles, which are believed to play a role in respiratory disease transmission. To further those findings, here we systematically investigate the effect of different 'phones' (the basic sound units of speech) on the emission of particles from the human respiratory tract during speech. We measured the respiratory particle emission rates of 56 healthy human volunteers voicing specific phones, both in isolation and in the context of a standard spoken text. We found that certain phones are associated with significantly higher particle production; for example, the vowel /i/ ("need," "sea") produces more particles than /ɑ/ ("saw," "hot") or /u/ ("blue," "mood"), while disyllabic words including voiced plosive consonants (e.g., /d/, /b/, /g/) yield more particles than words with voiceless fricatives (e.g., /s/, /h/, /f/). These trends for discrete phones and words were corroborated by the time-resolved particle emission rates as volunteers read aloud from a standard text passage that incorporates a broad range of the phones present in spoken English. Our measurements showed that particle emission rates were positively correlated with the vowel content of a phrase; conversely, particle emission decreased during phrases with a high fraction of voiceless fricatives. Our particle emission data is broadly consistent with prior measurements of the egressive airflow rate associated with the vocalization of various phones that differ in voicing and articulation. These results suggest that airborne transmission of respiratory pathogens via speech aerosol particles could be modulated by specific phonetic characteristics of the language spoken by a given human population, along with other, more frequently considered epidemiological variables.


Conflict of interest statement

The authors have declared that no competing interests exist.

Figures

Fig 1
Fig 1. Schematic of experimental setup and representative raw data.
(A) Schematic of experimental setup showing a participant talking into a funnel connected to the APS. (B) The microphone records the amplitude (arb. units) versus time for a participant saying ‘papa’ five times in rapid succession, followed by a 15 second pause, and repeated 3 times. (C) The APS simultaneously measures the time-resolved particle emission rate, N.
Fig 2
Fig 2. Particle emission rate of vowels.
Normalized particle emission rate, NV/NV,avg, versus root mean square amplitude, Arms, while saying (A) /ɑ/ (the vowel sound in ‘saw’), (B) /i/ (the vowel sound in ‘need’), and (C) /u/ (the vowel sound in ‘mood’) for 4 different amplitudes by 10 participants, 6 males (denoted as M1 to M6), and 4 females (denoted as F1 to F4). Solid lines are power law fits with exponent (A) 0.81, (B) 0.91, and (C) 0.94, correlation coefficient (A) 0.86, (B) 0.74, and (C) 0.82, and Pearson’s p value (A) 2.1×10⁻¹², (B) 5.9×10⁻⁸, and (C) 6.7×10⁻¹¹. (D) Boxplot of normalized particle emission rate calculated at Arms = 0.1, ÑVV,avg, (sample size n = 10). Scheffe groups are indicated with letters; groups with no common letter are considered significantly different (p < 0.05).
Fig 3
Fig 3. Particle emission rate of monosyllabic words.
Boxplot of normalized particle emission rate while repeating 12 monosyllabic words calculated at Arms = 0.1, ÑMM,avg (sample size n = 10). Top x-axis shows the IPA notation of each word. Scheffe groups are indicated with letters; groups with no common letter are considered significantly different (p < 0.05).
Fig 4
Fig 4. Particle emission rate of disyllabic words.
Boxplot of normalized particle emission rate while repeating 14 disyllabic words calculated at Arms = 0.1, ÑDD,avg, (sample size n = 30). Each background color represents the words including consonants which have similar voicing and articulation manner. Scheffe groups are indicated with letters; groups with no common letter are considered significantly different (p < 0.05).
Fig 5
Fig 5. Particle emission rate while reading the Rainbow passage.
Stacked bar plot of normalized particle emission rate, NR/NR,avg, for 18 participants (10 males, M7 to M16, and 8 females, F5 to F12) while reading Rainbow passage with an intermediate loudness, versus “phrase number” for 46 phrases in total. Each phrase was composed of approximately 10 syllables; see S1 Table for details.
Fig 6
Fig 6. Correlation between particle emission rate and phonetic fractions.
Cumulative normalized particle emission rate for 18 individuals, while reading the Rainbow passage, versus (A) fraction of vowels, and (B) fraction of voiceless fricatives in each phrase of the Rainbow passage. Solid lines are the best linear fit, with correlation coefficient (A) 0.48, and (B) -0.56, and Pearson’s p value (A) 6.4×10⁻⁴, and (B) 4.4×10⁻⁵.

References

    1. Tellier R. Review of aerosol transmission of influenza A virus. Emerg Infect Dis. 2006;12(11):1657–62. - PMC - PubMed
    1. Weber TP, Stilianakis NI. Inactivation of influenza A viruses in the environment and modes of transmission: A critical review. J Infect. 2008;57(5):361–73. 10.1016/j.jinf.2008.08.013 - DOI - PMC - PubMed
    1. Tellier R. Aerosol transmission of influenza A virus: a review of new studies. J R Soc Interface. 2009;6:S783–S90. 10.1098/rsif.2009.0302.focus - DOI - PMC - PubMed
    1. Gralton J, Tovey E, McLaws ML, Rawlinson WD. The role of particle size in aerosolised pathogen transmission: a review. J Infect. 2011;62(1):1–13. 10.1016/j.jinf.2010.11.010 - DOI - PMC - PubMed
    1. Tang JW. Investigating the airborne transmission pathway—different approaches with the same objectives. Indoor Air. 2015;25(2):119–24. 10.1111/ina.12175 - DOI - PMC - PubMed

Publication types