. 2020 Apr:78:108316.
doi: 10.1016/j.jnutbio.2019.108316. Epub 2019 Dec 16.

Copper modulates sex-specific fructose hepatoxicity in nonalcoholic fatty liver disease (NALFD) Wistar rat models

Affiliations

Copper modulates sex-specific fructose hepatoxicity in nonalcoholic fatty liver disease (NALFD) Wistar rat models

Austin Morrell et al. J Nutr Biochem. 2020 Apr.

Abstract

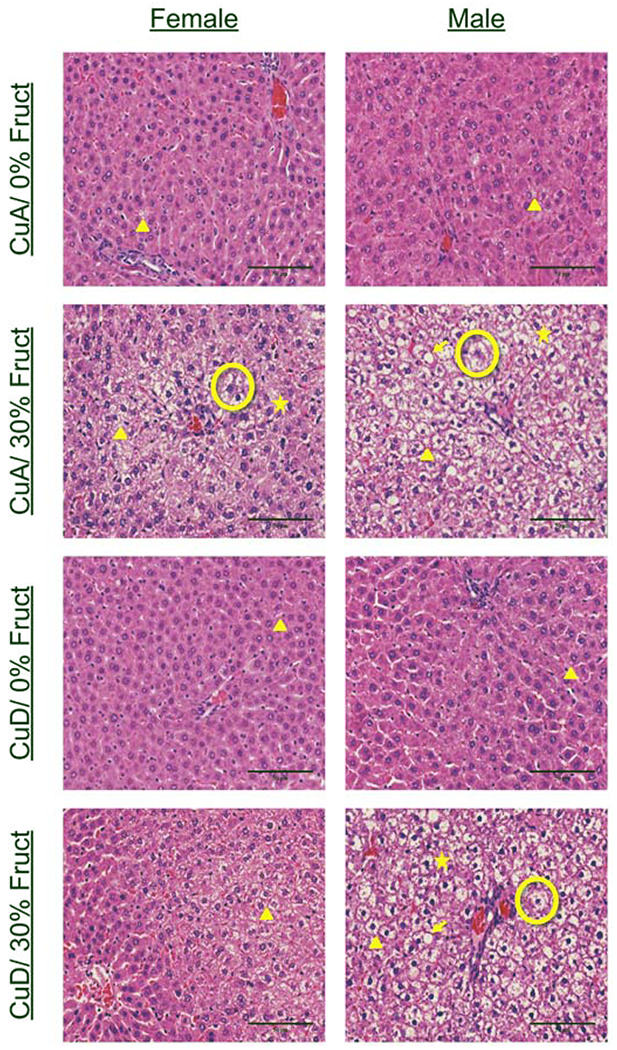
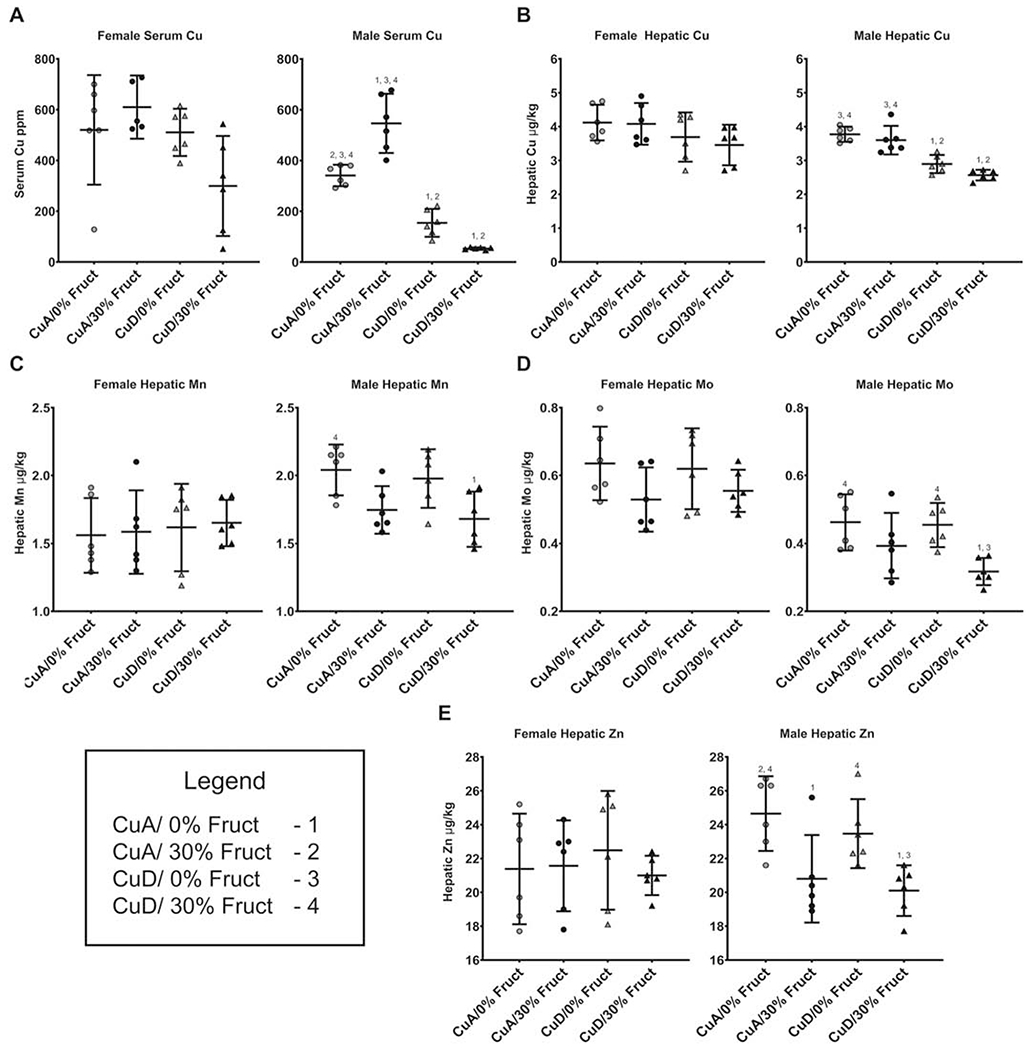
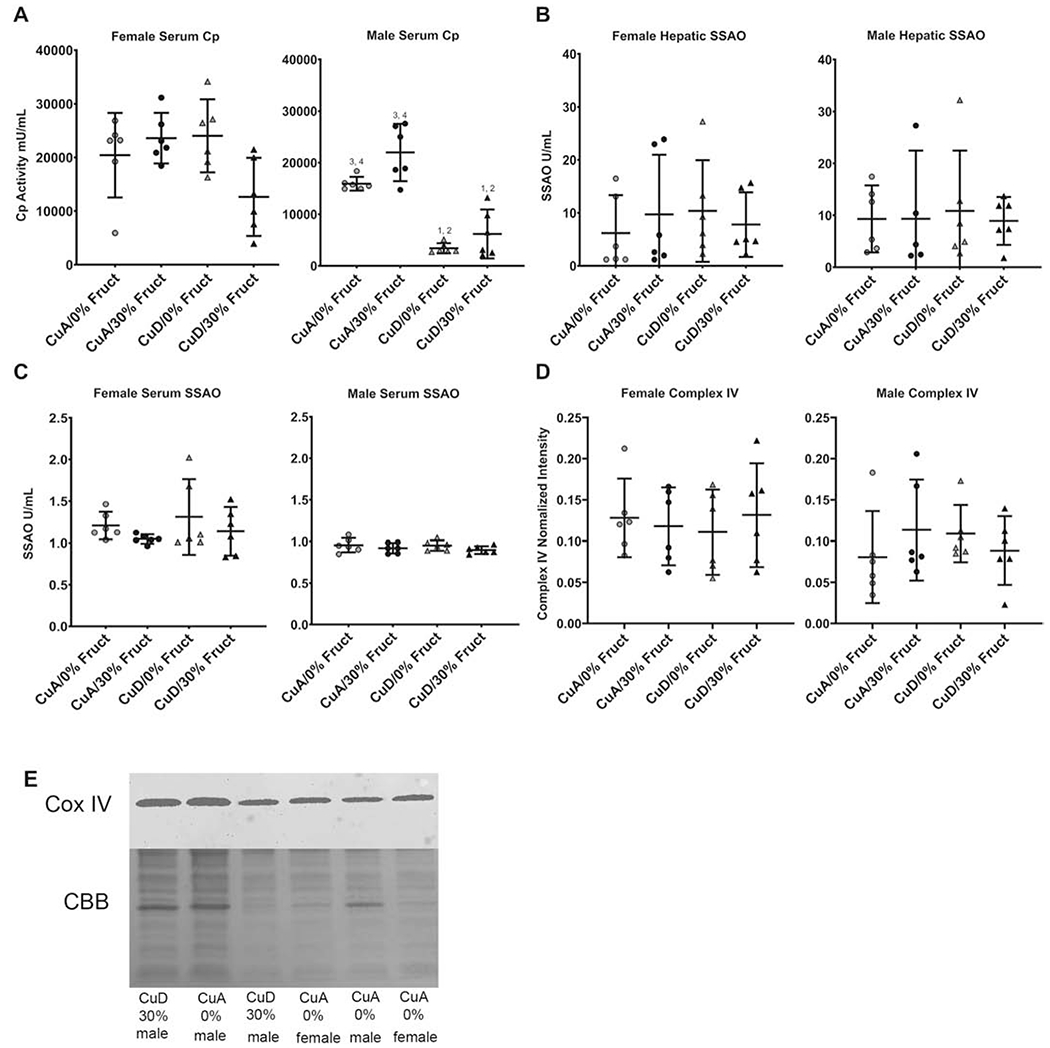
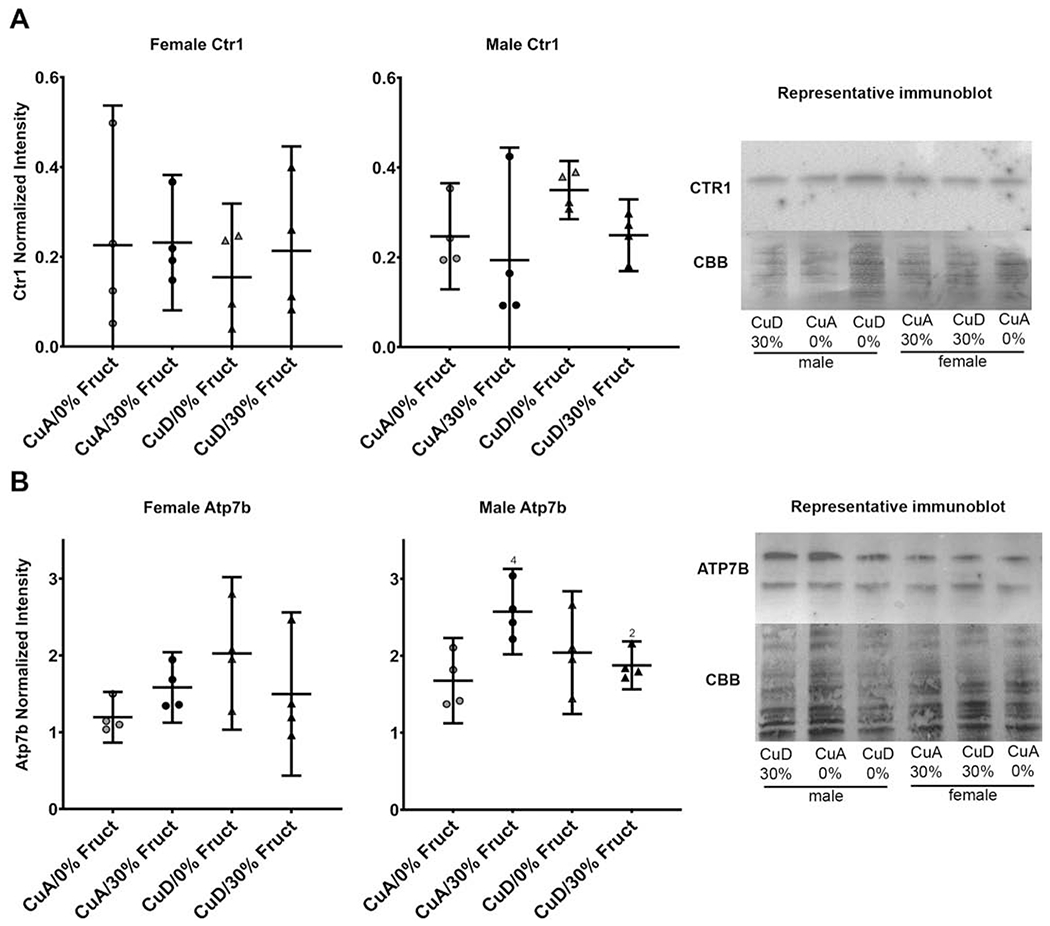
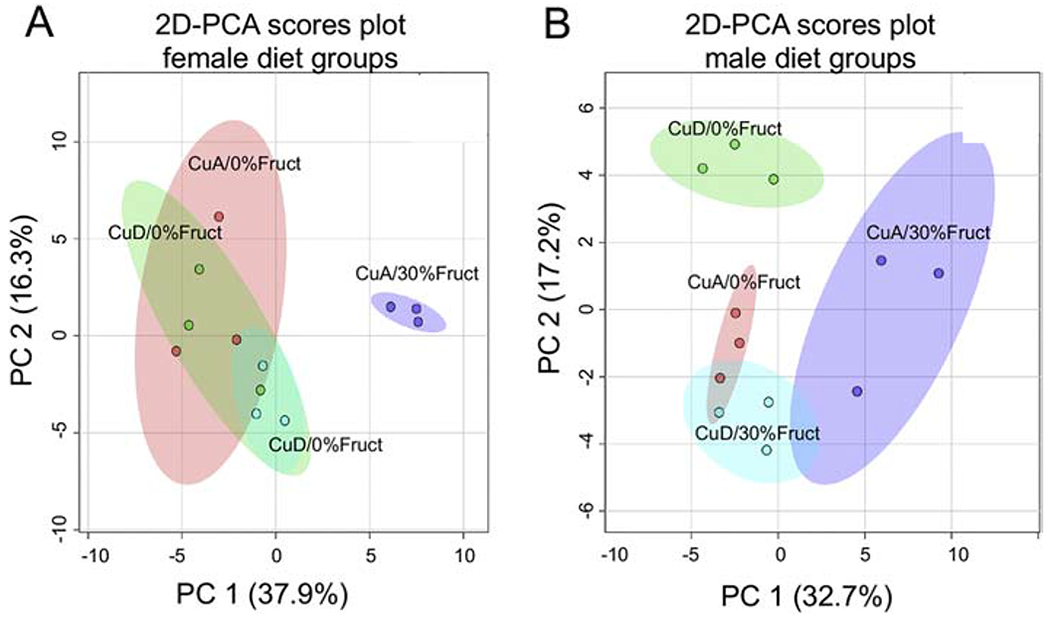
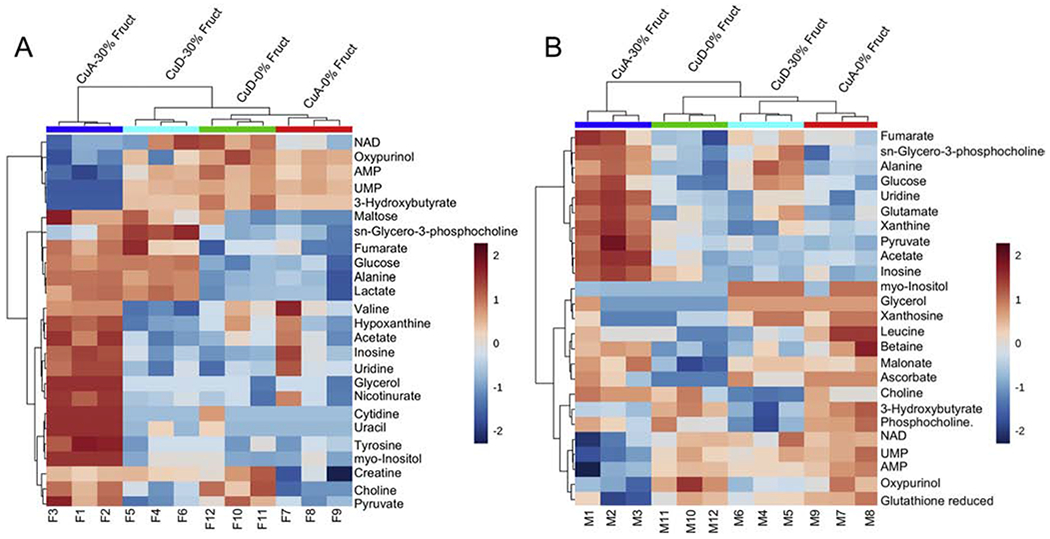
This study aimed to characterize the impact of dietary copper on the biochemical and hepatic metabolite changes associated with fructose toxicity in a Wistar rat model of fructose-induced liver disease. Twenty-four male and 24 female, 6-week-old, Wister rats were separated into four experimental dietary treatment groups (6 males and 6 females per group), as follows: (1) a control diet: containing no fructose with adequate copper (i.e., CuA/0% Fruct); (2) a diet regimen identical to the control and supplemented with 30% w/v fructose in the animals' drinking water (CuA/30% Fruct); (3) a diet identical to the control diet but deficient in copper content (CuD/0% Fruct) and (4) a diet identical to the control diet but deficient in copper content and supplemented with 30% w/v fructose in the drinking water (CuD/30% Fruct). The animals were fed the four diet regimens for 5 weeks, followed by euthanization and assessment of histology, elemental profiles and identification and quantitation of liver metabolites. Results from 1H nuclear magnetic resonance metabolomics revealed mechanistic insights into copper modulation of fructose hepatotoxicity through identification of distinct metabolic phenotypes that were highly correlated with diet and sex. This study also identified previously unknown sex-specific responses to both fructose supplementation and restricted copper intake, while the presence of adequate dietary copper promoted most pronounced fructose-induced metabolite changes.


Figures

Figure 1 -
Figure 1 -. Pathologies consistent with NAFLD were induced by high fructose and/or low copper diets in this animal rat model.
Representative H&E staining of liver tissue sections from all sexes and dietary groups. Features are marked as indicated: Triangle-microvesicular steatosis Arrow-macrovesicular steatosis Circle-ballooning hepatocyte Star- Mallory-Denke body. Pathologies consistent with NAFLD were observed in 30% CuA, 30% CuD, and 0% CuD diets, with the most severe pathologies being observed in 30% CuA groups. Pathological features such as hepatocyte ballooning, inflammation, and Mallory-Denke bodies were most common in the male 30% CuA group.
Figure 2 –
Figure 2 –. Dietary fructose and copper levels influence hepatic and serum bio-metals (ppb) for all dietary groups and sexes (n=6).
Numbers (1-4) indicate groups with means significantly different from the labeled group. A) Male rats displayed significant differences (P<0.005) in serum Cu between all dietary groups, except between the 30% CuD (mean=52.933 ppb) and 0% CuD (mean=154.382 ppb) groups (P=0.059). Female rats had no difference in circulating Cu levels between any of the dietary groups. B) Hepatic Cu levels were changed (P<0.005) in male rats by low dietary copper, while females displayed no change in hepatic Cu levels in response to either dietary fructose or copper. C) Serum Mo levels in males were significantly lower (P<0.05) in the 30% CuD group when compared to both non-supplemented groups. Changes in fructose and/or Cu did not induce changes in circulating Mo in female rats. D) Hepatic Mo levels in males were significantly lower (P<0.01) in the 30% CuD group when compared to both non-supplemented groups paralleling circulating Mo levels. No difference was seen between any of the female groups hepatic Mo levels. E) Hepatic Zn increased in male rats fed excess fructose (P < 0.05), while Zn was not impacted by dietary Cu. The male 0% CuA group had significantly higher hepatic zinc when compared to the 30% CuD group. Female rats displayed no major changes to hepatic Zn in response to dietary treatments.
Figure 3:
Figure 3:. Diet induces significant differences in key copper protein levels.
Numbers (1-4, as in Figure 2) indicate groups with means significantly different from the labeled group. A) Serum ceruloplasmin activity in male and female rats fed indicated diets. Ceruloplasmin activity was decreased in male, but not female rats fed Cu deficient diets. B) Hepatic SSAO activity was determined in homogenized liver tissue (n=6). No differences between dietary groups were observed in males or females. Males on average had higher hepatic SSAO activity, except in the 30% CuA group were females had higher SSAO activity. C) Circulating SSAO activity was determined in serum (n=6). No differences between dietary groups were observed in males or females. Females on average had slightly higher circulating SSAO activity when compared to males. D) Mitochondrial Complex IV abundance as determined by quantitative western blot (n=6). No differences in Complex IV quantity were observed across male and female models in any dietary treatment groups. E) Representative Western blot and immunodetection for Complex IV. Coomassie brilliant blue image of blot (CBB) was used for normalization.
Figure 4 –
Figure 4 –. Copper transporter expression in male, but not female rats is influenced by diet.
A) CTR1 abundance in male and female models across all dietary treatment conditions (n=4). No difference was seen between any of the dietary groups in males or females. Representative Western blot and immunodetection is shown. B) Atp7b abundance in all sexes and dietary groups across all dietary treatment conditions (n=4). Male Atp7b quantity was significantly elevated (P<0.05) in the 30% CuA group when compared to the control group. No difference was seen in female Atp7b levels between any dietary groups. Average variance was higher in females CuD groups (StDev 0.646) Atp7b levels when compared to CuA groups (StDev 0.206). Males on average had more Atp7b than females (P<0.01). Representative Western blot and immunodetection is shown (bands include known stable degradation products ~130 and 100 kDa.
Figure 5 –
Figure 5 –. 2D-PCA scores plots and 2D- Partial Least Square-Discriminant Analysis (2D-PLS-DA) scores plots for both female and male rats in their perspective diet groups.
A) 2D-PCA scores plot separating the female diet groups and indicating that only the CuA/30%Fruct dietary group separates from the other female dietary groups, with PC1 and PC2 accounting for ~ 37.9% and ~16.3% of the variance, respectively. B) 2D-PCA scores plot separating the male diet groups indicating that the four male dietary groups separate from one another according to their distinct metabolic profiles, with PC1 and PC2 accounting for ~ 32.7% and ~17.2% of the variance, respectively.
Figure 6 –
Figure 6 –. Hierarchical clustering analysis and heat map representation of the 25 most significant metabolites whose level changes contribute to the separation between the different dietary groups of the male and female rat animals.
A) Heatmap representation of the top 25 metabolites whose level changes separate the different female dietary groups into different clusters. The hierarchical clustering analysis supports results from the 2D-PCA scores plot (shown in Figure 5 panel A) indicating that the female CuA/30%Fruct dietary group is most distinct metabolically from the other female dietary treatment groups. B) Heatmap representation of the top 25 metabolites whose level changes differentiate between the different male dietary groups. Relative metabolite abundances are coded red for elevated and blue color denotes lower levels.

References

    1. NHANES - National Health and Nutrition Examination Survey Homepage n.d. https://www.cdc.gov/nchs/nhanes/ (accessed January 24, 2017).
    1. Wintergerst ES, Maggini S, Hornig DH. Contribution of selected vitamins and trace elements to immune function. Ann Nutr Metab 2007;51:301–23. 10.1159/000107673. - DOI - PubMed
    1. Tang Z, Gasperkova D, Xu J, Baillie R, Lee JH, Clarke SD. Copper deficiency induces hepatic fatty acid synthase gene transcription in rats by increasing the nuclear content of mature sterol regulatory element binding protein 1. J Nutr 2000;130:2915–21. - PubMed
    1. Morrell Austin, Tallino Savannah, Yu Lei, Burkhead Jason L. The role of insufficient copper in lipid synthesis and fatty-liver disease. IUBMB Life 2017;69:263–70. 10.1002/iub.1613. - DOI - PMC - PubMed
    1. Song M, Schuschke DA, Zhou Z, Chen T, Pierce WM, Wang R, et al. High Fructose Feeding Induces Copper Deficiency in Sprague-Dawley rats: A Novel Mechanism for Obesity Related Fatty Liver. J Hepatol 2012;56:433–40. 10.1016/j.jhep.2011.05.030. - DOI - PMC - PubMed

Publication types

MeSH terms