. 2020 Jan 27;12(2):1624-1642.
doi: 10.18632/aging.102704. Epub 2020 Jan 27.

TPGS-1000 exhibits potent anticancer activity for hepatocellular carcinoma in vitro and in vivo

Affiliations

TPGS-1000 exhibits potent anticancer activity for hepatocellular carcinoma in vitro and in vivo

Yidan Chen et al. Aging (Albany NY). .

Abstract

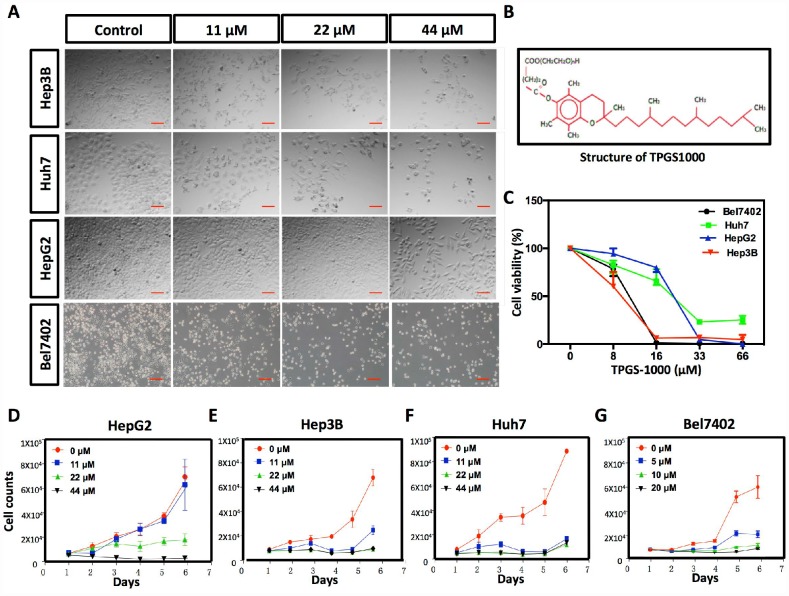
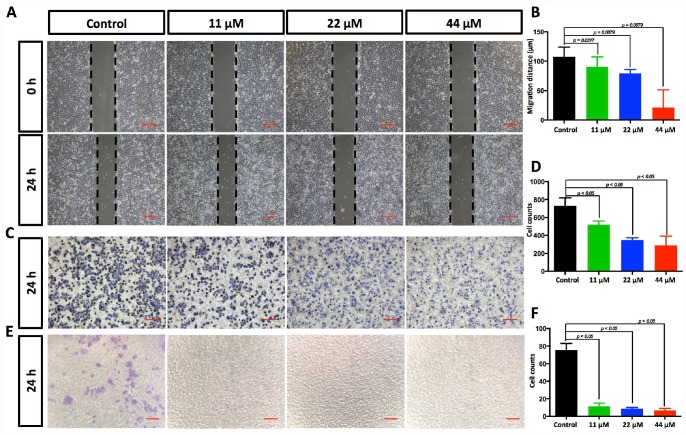
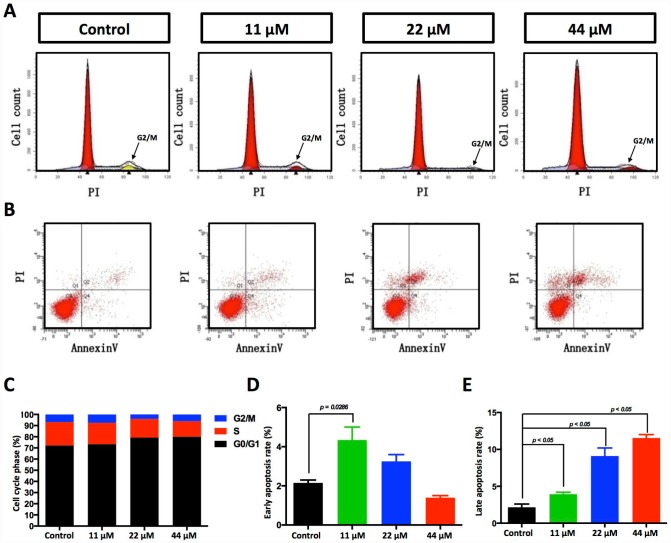
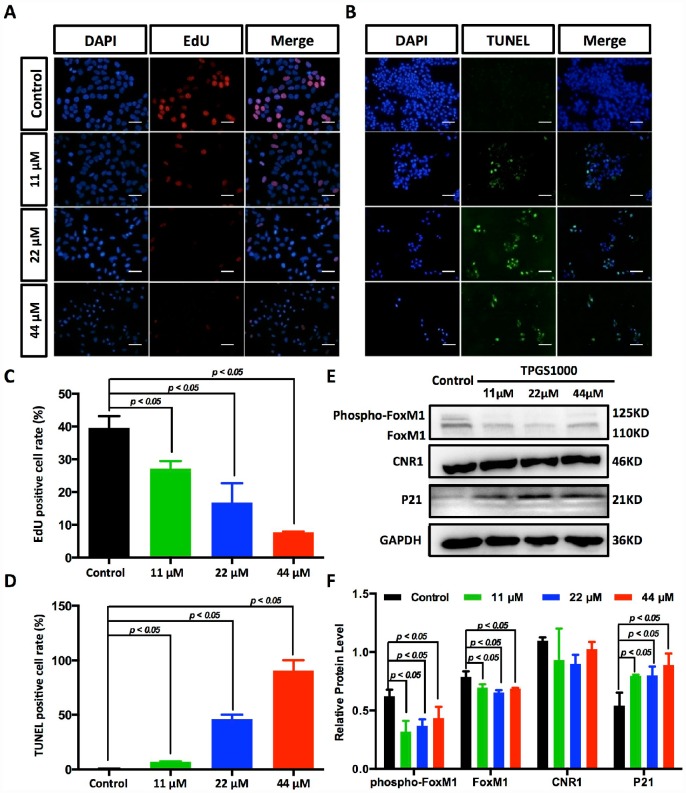
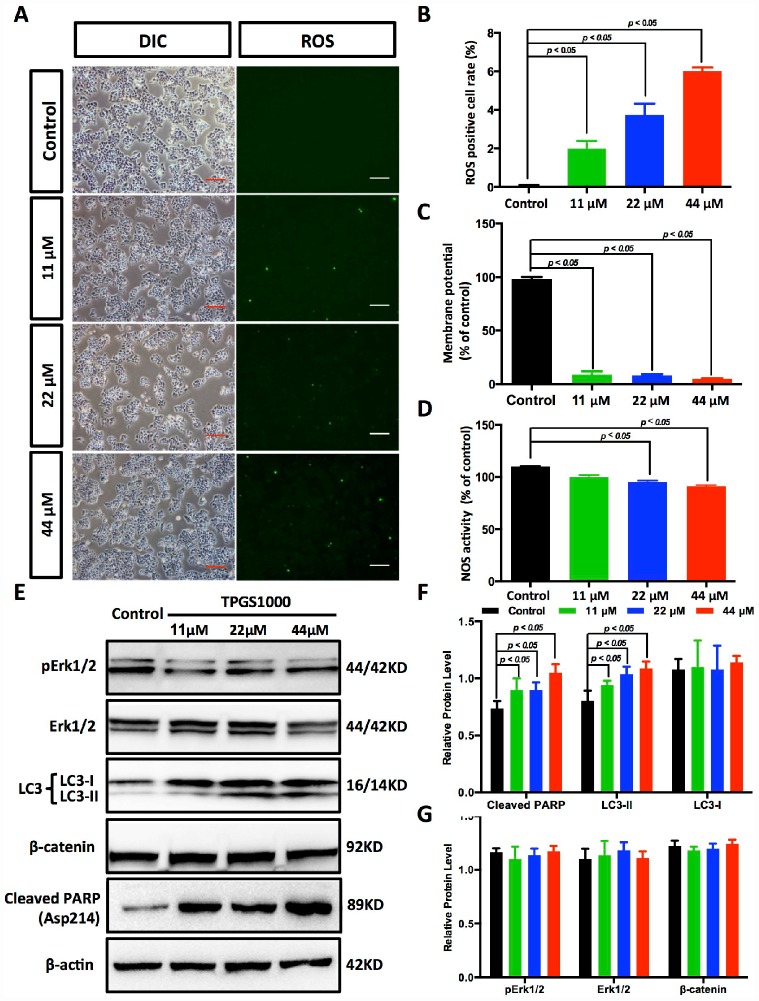
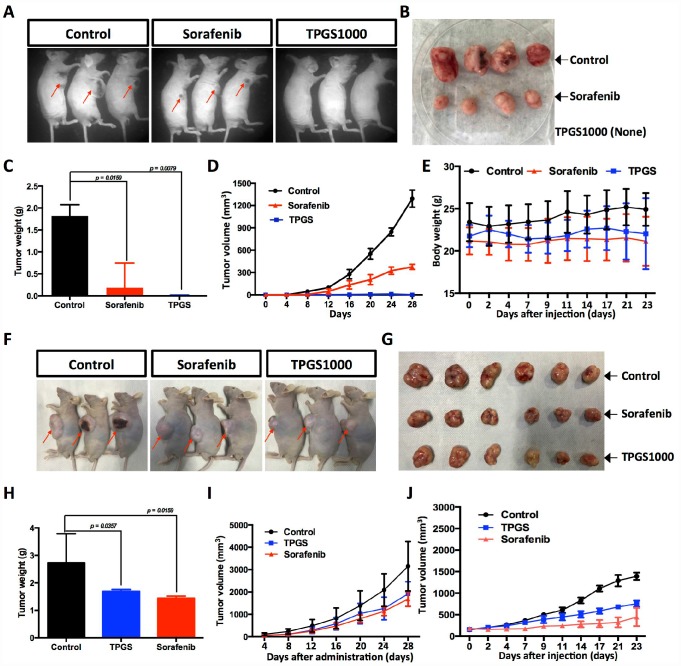
D-alpha-tocopheryl polyethylene glycol 1000 succinate (TPGS1000) is the most active water-soluble derivative of vitamin E and has been widely used as a carrier of solvents, plasticizers, emulsifiers, absorbent agents and refractory drug delivery systems. However, its anti-hepatocellular carcinoma (HCC) properties have not been explored. HCC cells were treated with different concentrations of TPGS1000. Cell survival was tested by CCK8 assay, and cell migration was tested by wound healing and Transwell assay. EdU staining verified cell proliferation, and signalling pathway was assayed by Western blot analysis. The BALB/c-nu mouse xenograft model was established to test HCC cell growth in vivo. In vitro TPGS1000 significantly inhibited the viability and mobility of HCC cells (HepG2, Hep3B and Huh7) in a dose-dependent manner. Cell cycle analysis indicated that TPGS1000 treatment arrested the HCC cell cycle in the G0/G1 phase, and induction of cell apoptosis was confirmed by TUNEL and Annexin V-7-AAD staining. Further pharmacological analysis indicated that collapse of the transmembrane potential of mitochondria, increased ROS generation, PARP-induced cell apoptosis and FoxM1-p21-mediated cell cycle arresting, were involved in the anti-HCC activity of TPGS1000. Moreover, treatment in vivo with TPGS1000 effectively impaired the growth of HCC xenografts in nude mice.

Keywords: TPGS1000; apoptosis; hepatocellular carcinoma; malignancy; migration.


Conflict of interest statement

CONFLICTS OF INTEREST: The authors declare that they have no competing interests.

Figures

Figure 1
Figure 1
Effect of TPGS1000 on viability and proliferation of hepatocarcinoma cells. (A) Morphology of four HCC cell lines (HepG2, Hep3B Huh7 and Bel7402) treated with different concentrations of TPGS (0, 11, 22 and 44 μM), scale bar = 100 μm. (B) The structure of TPGS1000. (C) HCC cells were cultured in the presence of various concentrations (0–66 μM) of TPGS for 48 h. Cell viabilities were measured using CCK8. The line graph represents the percent viable cells compared to the vehicle-treated cells. (DG) Growth curves of four HCC cell lines were plotted from cell counts under different concentrations of TPGS.
Figure 2
Figure 2
TPGS dose dependently restrained HCC cell migration and invasion. (A) Effects of TPGS treatments on HCC cell migration, scale bar = 100 μm (B) The migration distance of HCC cells was quantified by ImageJ software, and the 44 μM TPGS group had the shortest migration distance (23 μm). (C) The inhibition of HCC cell migration by TPGS was confirmed by Transwell assays, scale bar = 100 μm. (D) The migrated cells were counted after Crystal violet staining with the 44 μM TPGS group having the lowest number of migrated cells (approximately 298). (E) TPGS diminished cell invasion of HCC cells (Transwell assay using an 8 μm pore filter coated with 0.5 mg/mL Matrigel), scale bar = 100 μm. (F) The mean cell counts of invading cells, with the 44 μM TPGS group having the lowest number of invasion cells (approximately 6).
Figure 3
Figure 3
Effects of TPGS treatments on HCC cell cycle progression and cell apoptosis. (A) Cell cycle progression detected by FACS analysis. Cells in G0/G1 are marked in the red area. Cells in the S phase are marked with a slash, whereas the arrowhead indicates the G2/M cells. (B) Cell apoptosis was assessed with Annexin V-PI staining. (C) The cell cycle distribution was calculated with Cell Quest Pro software. The 44 μM TPGS group produced the lowest amount of cell accumulation in the S phase (13.88%). (D) The HCC cells that were treated with 11 μM TPGS had the highest ratio of early apoptotic cells (approximately 4%), whereas with increasing TPGS concentrations in the HCC cells, the 44 μM TPGS group had the highest late apoptotic ratio, 10.4% (E).
Figure 4
Figure 4
Suppression of DNA synthesis and induction of apoptosis in TPGS-treated HCC cells. (A) Detection by fluorescence microscopy of EdU (red) incorporated into the DNA of cultured HCC cells, scale bar = 40 μm. The nuclei were counter-stained with DAPI (blue). (B) TUNEL (green) positive apoptotic cells in HCC cells induced by TPGS treatments, scale bar = 20 μm. (C) The rates of EdU positive cells that passed through the S phase were calculated with ImageJ, and the 44 μM TPGS group had the lowest EdU positive cell rate (7%). (D) The rates of TUNEL positive cells were elevated with increasing TPGS concentrations, and the 44 μM TPGS group had the highest apoptotic cell rate (approximately 93%). (E) A decrease of FoxM1 and phosphorylated FoxM1, and an increase of p21 protein levels in TPGS-treated HCC cells. (F) Quantitative analysis of western blot results from (E). All protein levels were normalized with the housekeeping genes GAPDH and β-actin.
Figure 5
Figure 5
TPGS dose dependently induced the production of ROS and reduced energy production in HCC cells. (A) ROS imaging (green fluorescence) in TPGS-treated HCC cells, scale bar = 100 μm. (B) Quantitative analysis of ROS production in TPGS-treated HCC cells. The 44 μM TPGS group had the highest ROS positive cell rate, 6.0%. (C) ΔΨ levels were analysed in HCC cells to evaluate energy production. (D) Effects of TPGS treatments on NOS activity. (E) TPGS induced an increase of cleaved PARP protein levels and LC3-II protein accumulation in TPGS-treated HCC cells. (F and G) Quantitative analysis of western blot results from (E). All protein levels were normalized with the housekeeping genes GAPDH and β-actin.
Figure 6
Figure 6
Effects of TPGS treatments and intravenous or oral administration on HCC cell-derived subcutaneous xenograft tumors in nude mice. (A) Tumor-bearing mice were divided into three groups: control, Sorafenib- and TPGS-treated groups. (B) Tumor masses from the control group (implantation with 1×10⁷ untreated HCC cells) and from the Sorafenib group (implanted with 1×10⁷ treated HCC cells). (C) Tumor weights in mice 32 days after injection. (D) Quantitative analyses of tumor progression of (A). The tumor size was determined by measuring the tumor volume every 4 days from day 4 to day 28 after injection. (E) Body weights for TPGS-injected animals did not change significantly compared to vehicle-treated controls. (F) Tumor-bearing mice were randomized to receive treatment with 30 mg/kg of Sorafenib or 300 mg/kg of TPGS or an equal volume of normal saline by oral gavage. (G) Tumor masses from three groups of (F). (H) Tumor weights in mice 32 days after drug administrations. Both the Sorafenib- and TPGS-treated groups demonstrated a significant decrease of tumor weights. (I) Quantitative analyses of tumor progression of (F). (J) Tumor growth curves. Nude mice were administered treatments 2 times via intravenous injection in the tail over an interval of 7 days. The tumor volume was monitored at predetermined time points.

References

    1. Llovet JM, Burroughs A, Bruix J. Hepatocellular carcinoma. Lancet. 2003; 362:1907–17. 10.1016/S0140-6736(03)14964-1 - DOI - PubMed
    1. El-Serag HB. Hepatocellular carcinoma. N Engl J Med. 2011; 365:1118–27. 10.1056/NEJMra1001683 - DOI - PubMed
    1. Chen W, Zheng R, Baade PD, Zhang S, Zeng H, Bray F, Jemal A, Yu XQ, He J. Cancer statistics in China, 2015. CA Cancer J Clin. 2016; 66:115–32. 10.3322/caac.21338 - DOI - PubMed
    1. von Felden J, Schulze K, Gil-Ibanez I, Werner T, Wege H. First- and Second-Line Targeted Systemic Therapy in Hepatocellular Carcinoma-An Update on Patient Selection and Response Evaluation. Diagnostics (Basel). 2016; 6:E44. 10.3390/diagnostics6040044 - DOI - PMC - PubMed
    1. Cheng L, Luo S, Jin C, Ma H, Zhou H, Jia L. FUT family mediates the multidrug resistance of human hepatocellular carcinoma via the PI3K/Akt signaling pathway. Cell Death Dis. 2013; 4:e923. 10.1038/cddis.2013.450 - DOI - PMC - PubMed

Publication types

MeSH terms