

Plasma Soluble Urokinase Plasminogen Activator Receptor (suPAR) and CKD Progression in Children
- PMID: 31987488
- PMCID: PMC7374047
- DOI: 10.1053/j.ajkd.2019.11.004
Plasma Soluble Urokinase Plasminogen Activator Receptor (suPAR) and CKD Progression in Children
Abstract
Rationale & objective: Soluble urokinase plasminogen activator receptor (suPAR) is a novel biomarker associated with incident chronic kidney disease (CKD) and has been identified as an independent risk factor for CKD progression in children, although these findings remain preliminary, limited to a single point in time, and unreplicated in pediatric cohorts.
Study design: Prospective longitudinal cohort study.
Setting & participants: 565 participants aged 1 to 16 years enrolled in the Chronic Kidney Disease in Children (CKiD) Study.
Exposure: Plasma suPAR levels, categorized by quartiles, measured at study entry and a 6-month follow-up interval.
Outcome: CKD progression, defined as the initiation of kidney replacement therapy (dialysis or transplantation) or >50% decline in estimated glomerular filtrate rate (eGFR).
Analytic approach: Associations between plasma suPAR quartiles and risk for CKD progression were estimated using lognormal survival models, adjusting for potential confounders.
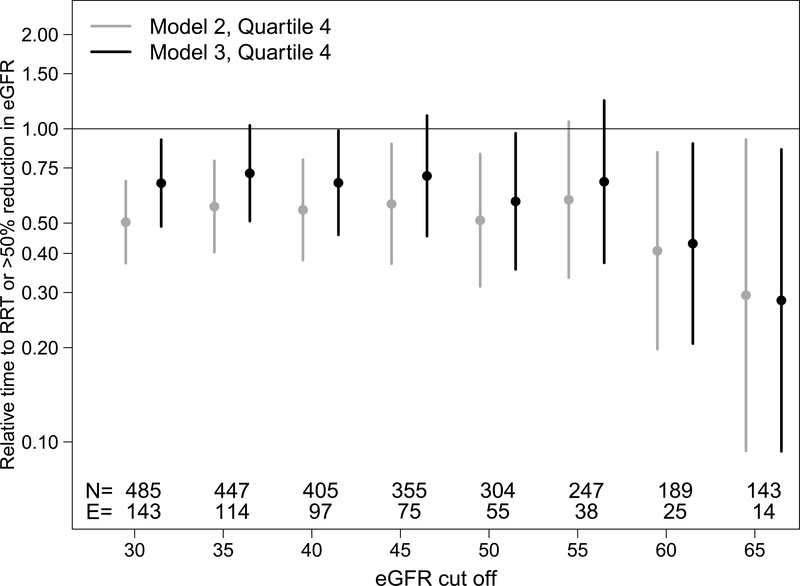
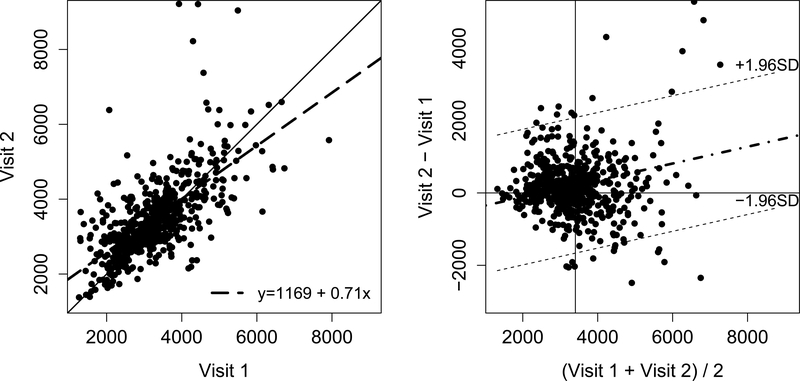
Results: Participants in the highest suPAR quartile experienced 54% faster progression compared with the lowest quartile after adjustment for demographic and traditional CKD risk factors (P < 0.001). Addition of eGFR to the model attenuated the risk, although those in the highest quartile experienced 33% faster progression compared with the lowest quartile (P = 0.008). Plasma suPAR levels showed little change over 6 months.
Limitations: Potential for residual confounding, reliance on observational data, relatively fewer patients with higher eGFRs for subgroup analysis.
Conclusions: Higher suPAR levels are associated with shorter time to kidney replacement therapy or halving of eGFR in children with CKD. This association is attenuated slightly with inclusion of eGFR in regression modeling but remains a significant association for participants with the highest suPAR levels.
Keywords: Soluble urokinase plasminogen activator receptor (suPAR); biomarker; children; chronic kidney disease (CKD); eGFR decline; end-stage renal disease (ESRD); estimated glomerular filtration rate (eGFR); pediatric; progression; renal failure.
Copyright © 2019 National Kidney Foundation, Inc. Published by Elsevier Inc. All rights reserved.
Figures

Similar articles
-
Association of Serum Soluble Urokinase Receptor Levels With Progression of Kidney Disease in Children.JAMA Pediatr. 2017 Nov 6;171(11):e172914. doi: 10.1001/jamapediatrics.2017.2914. Epub 2017 Nov 6. JAMA Pediatr. 2017. PMID: 28873129 Free PMC article.
-
Soluble Urokinase Receptor and Chronic Kidney Disease.N Engl J Med. 2015 Nov 12;373(20):1916-25. doi: 10.1056/NEJMoa1506362. Epub 2015 Nov 5. N Engl J Med. 2015. PMID: 26539835 Free PMC article.
-
Soluble urokinase-type plasminogen activator receptor and incident end-stage renal disease in Chinese patients with chronic kidney disease.Nephrol Dial Transplant. 2020 Mar 1;35(3):465-470. doi: 10.1093/ndt/gfy265. Nephrol Dial Transplant. 2020. PMID: 30124995 Free PMC article.
-
Association between Soluble Urokinase-Type Plasminogen Activator Receptor Levels and Chronic Kidney Disease: A Systematic Review and Meta-Analysis.Biomed Res Int. 2019 Nov 26;2019:6927456. doi: 10.1155/2019/6927456. eCollection 2019. Biomed Res Int. 2019. PMID: 31886242 Free PMC article.
-
suPAR and chronic kidney disease-a podocyte story.Pflugers Arch. 2017 Aug;469(7-8):1017-1020. doi: 10.1007/s00424-017-2026-7. Epub 2017 Jul 8. Pflugers Arch. 2017. PMID: 28689240 Review.
Cited by
-
The Perspective of Vitamin D on suPAR-Related AKI in COVID-19.Int J Mol Sci. 2022 Sep 14;23(18):10725. doi: 10.3390/ijms231810725. Int J Mol Sci. 2022. PMID: 36142634 Free PMC article. Review.
-
Time to Change Our Viewpoints to Assess Renal Risks in Patients with Solitary Kidneys beyond Traditional Approaches?J Clin Med. 2023 Oct 31;12(21):6885. doi: 10.3390/jcm12216885. J Clin Med. 2023. PMID: 37959350 Free PMC article.
-
Variability in CKD Biomarker Studies: Soluble Urokinase Plasminogen Activator Receptor (suPAR) and Kidney Disease Progression in the Chronic Kidney Disease in Children (CKiD) Study.Kidney Med. 2021 Jun 17;3(5):712-721.e1. doi: 10.1016/j.xkme.2021.04.007. eCollection 2021 Sep-Oct. Kidney Med. 2021. PMID: 34693253 Free PMC article.
-
Current and Novel Biomarkers of Progression Risk in Children with Chronic Kidney Disease.Nephron. 2024;148(1):1-10. doi: 10.1159/000530918. Epub 2023 May 15. Nephron. 2024. PMID: 37232009 Free PMC article. Review.
-
The predictive value of suPAR for glomerular segmental sclerosis lesions in renal pathology.Ren Fail. 2025 Dec;47(1):2498628. doi: 10.1080/0886022X.2025.2498628. Epub 2025 May 13. Ren Fail. 2025. PMID: 40364434 Free PMC article.
References
-
- Parekh RS, Carroll CE, Wolfe RA, Port FK. Cardiovascular mortality in children and young adults with end-stage kidney disease. J Pediatr. 2002;141(2):191–197. - PubMed
-
- Group ET, Wuhl E, Trivelli A, et al. Strict blood-pressure control and progression of renal failure in children. N Engl J Med. 2009;361(17):1639–1650. - PubMed
-
- Zeier M, Reiser J. suPAR and chronic kidney disease-a podocyte story. Pflugers Arch. 2017;469(7–8):1017–1020. - PubMed
Publication types
MeSH terms
Substances
Grants and funding
LinkOut - more resources
Full Text Sources
Medical
Research Materials
Miscellaneous
