. 2020 Jan 27;192(4):E81-E91.
doi: 10.1503/cmaj.190940.

Outcomes and care practices for preterm infants born at less than 33 weeks' gestation: a quality-improvement study

Affiliations

Outcomes and care practices for preterm infants born at less than 33 weeks' gestation: a quality-improvement study

Shoo K Lee et al. CMAJ. .

Abstract

Background: Preterm birth is the leading cause of morbidity and mortality in children younger than 5 years. We report the changes in neonatal outcomes and care practices among very preterm infants in Canada over 14 years within a national, collaborative, continuous quality-improvement program.

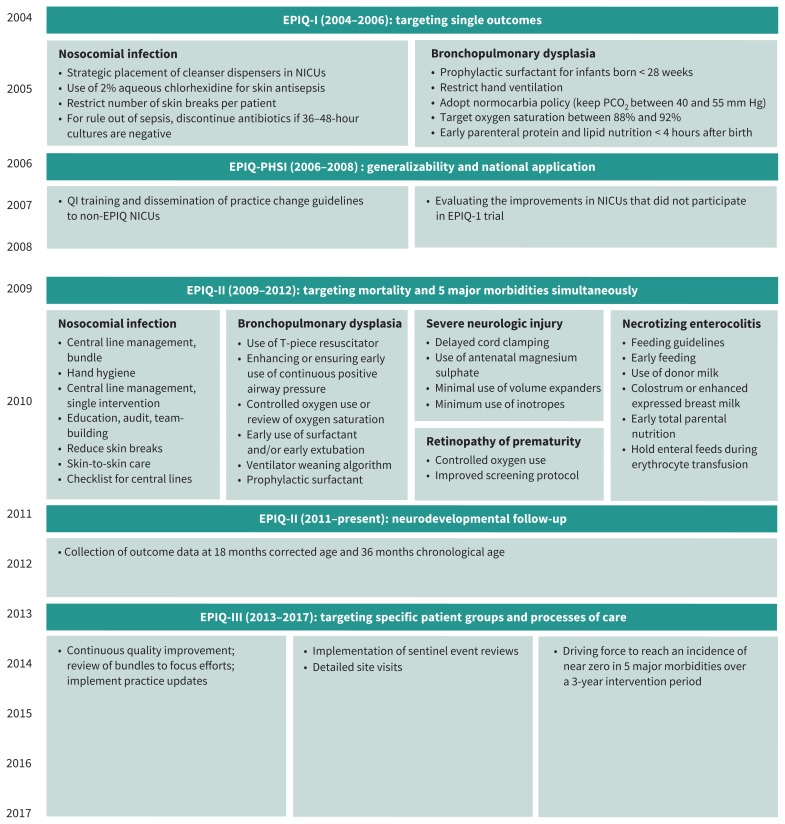
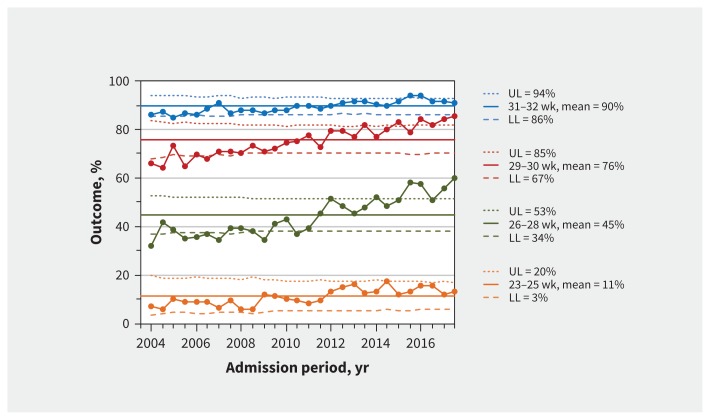
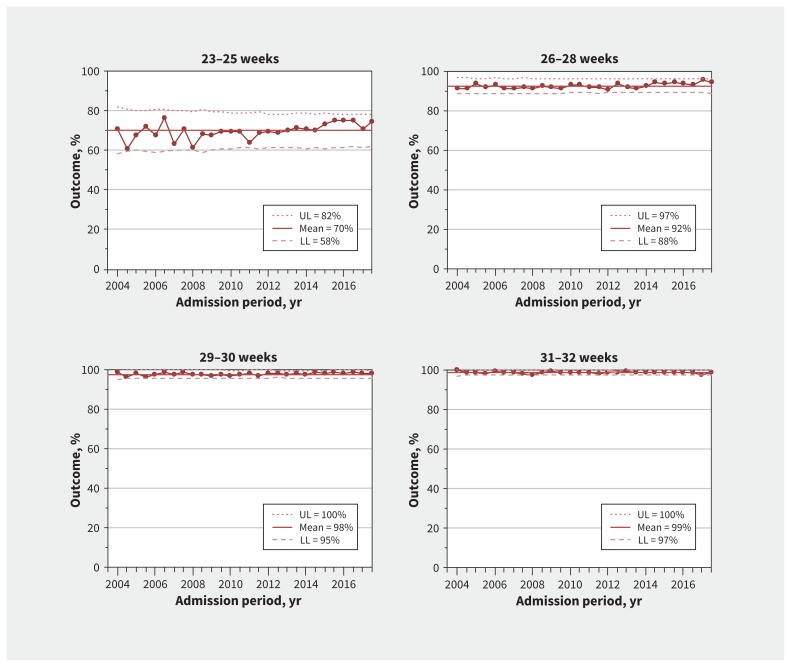
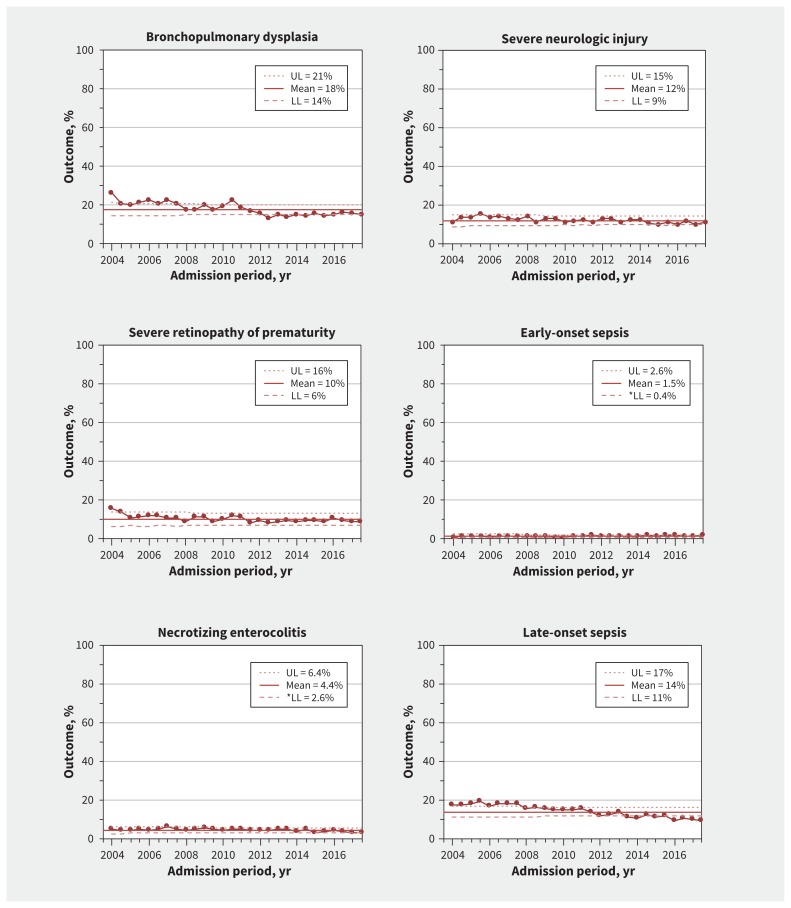
Methods: We retrospectively studied infants born at 23-32 weeks' gestation who were admitted to tertiary neonatal intensive care units that participated in the Evidence-based Practice for Improving Quality program in the Canadian Neonatal Network from 2004 to 2017. The primary outcome was survival without major morbidity during the initial hospital admission. We quantified changes using process-control charts in 6-month intervals to identify special-cause variations, adjusted regression models for yearly changes, and interrupted time series analyses.

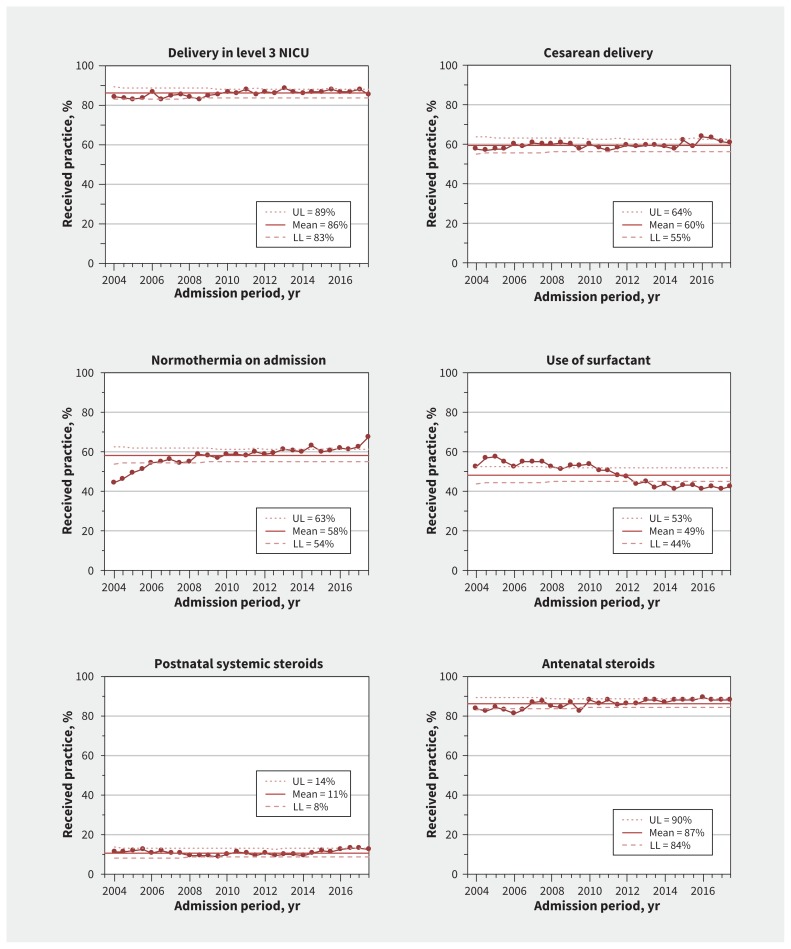
Results: The final study population included 50 831 infants. As a result of practice changes, survival without major morbidity increased significantly (56.6% [669/1183] to 70.9% [1424/2009]; adjusted odds ratio [OR] 1.08, 95% confidence interval [CI] 1.06-1.10, per year) across all gestational ages. Survival of infants born at 23-25 weeks' gestation increased (70.8% [97/137] to 74.5% [219/294]; adjusted OR 1.03, 95% CI 1.02-1.05, per year). Changes in care practices included increased use of antenatal steroids (83.6% [904/1081] to 88.1% [1747/1983]), increased rates of normothermia at admission (44.8% [520/1160] to 67.5% [1316/1951]) and reduced use of pulmonary surfactant (52.8% [625/1183] to 42.7% [857/2009]).

Interpretation: Network-wide quality-improvement activities that include better implementation of optimal care practices can yield sustained improvement in survival without morbidity in very preterm infants.


Conflict of interest statement

Competing interests: None declared. The authors further declare no competing interests for the Evidence-based Practice for Improving Quality (EPIQ) Investigators group.

Figures

Figure 1:
Figure 1:
Timeline of key practice changes (during Epoch 1 [2004–2008], Epoch 2 [2009–2012] and Epoch 3 [2013–2017]) implemented by participating hospitals using the EPIQ method. The 5 most commonly implemented interventions were central venous catheter management bundles in different forms, development and implementation of guidelines for respiratory management of a neonate who is receiving invasive or noninvasive respiratory support, development and implementation of feeding guidelines, controlled use of oxygen, and neurologic injury prevention bundle. Note: EPIQ = Evidence-based Practice for Improving Quality, NICU = neonatal intensive care unit, PHSI = Partnerships for Health Systems Improvement, QI = quality improvement.
Figure 2:
Figure 2:
Survival to discharge without major morbidity. Process-control charts for survival to discharge without major morbidity by gestational age group. Means (solid lines) and upper (UL) and lower (LL) control limits (dotted and dashed lines) are calculated using 2004–2017 data. Margins of the limits were recalculated for each period based on the number of infants per 6-month period, and the reported UL and LL correspond to the first 6 months of 2004. Large dots show the percentage of infants admitted each 6-month period who survived without major morbidity. The percentages are among all infants within the gestational age group. The total numbers of infants in each group are 6265 for 23–25 weeks, 13 157 for 26–28 weeks, 12 868 for 29–30 weeks and 18 541 for 31–32 weeks. The median (range) numbers of infants for each 6-month period are 229 (137–294) for 23–25 weeks, 485 (353–532) for 26–28 weeks, 490 (253–550) for 29–30 weeks and 700 (440–820) for 31–32 weeks.
Figure 3:
Figure 3:
Survival to discharge. Process-control charts for overall survival to discharge by gestational age group. Means (solid lines) and upper (UL) and lower (LL) control limits (dotted and dashed lines) are calculated using 2004–2017 data. Margins of the limits were recalculated for each period based on the number of infants per 6-month period, and the reported UL and LL correspond to the first 6 months of 2004. Large dots show the percentage of infants admitted each 6-month period who survived to discharge. The percentages are among all infants within the gestational age group. The total numbers of infants in each group are 6265 for 23–25 weeks, 13 157 for 26–28 weeks, 12 868 for 29–30 weeks and 18 541 for 31–32 weeks. The median (range) numbers of infants for each 6-month period are 229 (137–294) for 23–25 weeks, 485 (353–532) for 26–28 weeks, 490 (253–550) for 29–30 weeks and 700 (440–820) for 31–32 weeks.
Figure 4:
Figure 4:
Process-control charts for neonatal morbidities among infants born at gestational age 23 through 32 weeks. Means (solid lines) and upper (UL) and lower (LL) control limits (dotted and dashed lines) calculated using 2004–2017 data. Margins of the limits were recalculated for each period based on the number of infants per 6-month period, and the reported UL and LL correspond to the first 6 months of 2004. Large dots show the percentage of infants admitted each 6-month period who developed the outcome. Percentage of bronchopulmonary dysplasia is among infants either alive at 36 weeks corrected, or at discharge or transfer if discharged before 36 weeks corrected (n = 47 804). Percentage of severe neurologic injury is among infants with at least 1 documented head imaging examination (ultrasound, computed tomography or magnetic resonance imaging) (n = 40 899). Percentage of necrotizing enterocolitis is among all infants with available data (n = 50 621). Percentage of severe retinopathy of prematurity is among infants who had a least 1 documented eye examination (n = 21 807). Percentage of early-onset sepsis is among all infants (n = 50 831). Percentage of late-onset sepsis is among all infants (n = 50 831). The median number of infants for each 6-month period was 1937 (range 538–2153).
Figure 5:
Figure 5:
Process-control charts for care practices for infants born at gestational age 23 through 32 weeks. Means (solid lines) and upper (UL) and lower (LL) control limits (dotted and dashed lines) calculated using 2004–2017 data. Margins of the limits were recalculated for each period based on the number of infants per 6-month period, and the reported UL and LL correspond to the first 6 months of 2004. Large dots show the percentage of infants admitted each 6-month period who received each care practice among all eligible infants. Denominators used to calculate percentages were all infants (n = 50 831). The median number of infants for each 6-month period was 1937 (range 1182–2152). Note: NICU = neonatal intensive care unit.

Comment in

References

    1. Rysavy MA, Li L, Bell EF, et al. Between-hospital variation in treatment and outcomes in extremely preterm infants. N Engl J Med 2015;372:1801–11. - PMC - PubMed
    1. Yeo KT, Lee QY, Quek WS, et al. Trends in morbidity and mortality of extremely preterm multiple gestation newborns. Pediatrics 2015;136:263–71. - PubMed
    1. Johnson TJ, Patel AL, Jegier BJ, et al. Cost of morbidities in very low birth weight infants. J Pediatr 2013;162:243–49.e1. - PMC - PubMed
    1. Younge N, Goldstein RF, Bann CM, et al. Survival and neurodevelopmental outcomes among periviable infants. N Engl J Med 2017;376:617–28. - PMC - PubMed
    1. Ogrinc G, Davies L, Goodman D, et al. SQUIRE 2.0 (Standards for QUality Improvement Reporting Excellence): revised publication guidelines from a detailed consensus process. BMJ Qual Saf 2016;25:986–92. - PMC - PubMed