. 2020 Apr;4(4):394-406.
doi: 10.1038/s41551-019-0495-z. Epub 2020 Jan 27.

On-chip recapitulation of clinical bone marrow toxicities and patient-specific pathophysiology

Affiliations

On-chip recapitulation of clinical bone marrow toxicities and patient-specific pathophysiology

David B Chou et al. Nat Biomed Eng. 2020 Apr.

Erratum in

  • Author Correction: On-chip recapitulation of clinical bone marrow toxicities and patient-specific pathophysiology.
    Chou DB, Frismantas V, Milton Y, David R, Pop-Damkov P, Ferguson D, MacDonald A, Vargel Bölükbaşı Ö, Joyce CE, Moreira Teixeira LS, Rech A, Jiang A, Calamari E, Jalili-Firoozinezhad S, Furlong BA, O'Sullivan LR, Ng CF, Choe Y, Marquez S, Myers KC, Weinberg OK, Hasserjian RP, Novak R, Levy O, Prantil-Baun R, Novina CD, Shimamura A, Ewart L, Ingber DE. Chou DB, et al. Nat Biomed Eng. 2020 Apr;4(4):477. doi: 10.1038/s41551-020-0529-6. Nat Biomed Eng. 2020. PMID: 32051581

Abstract

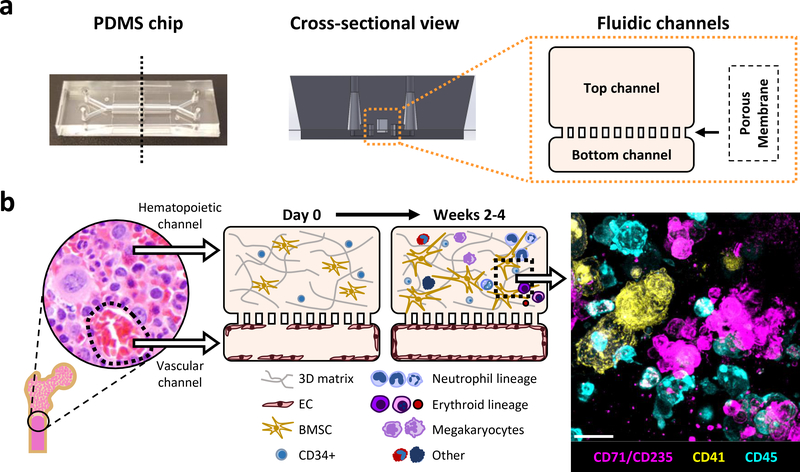
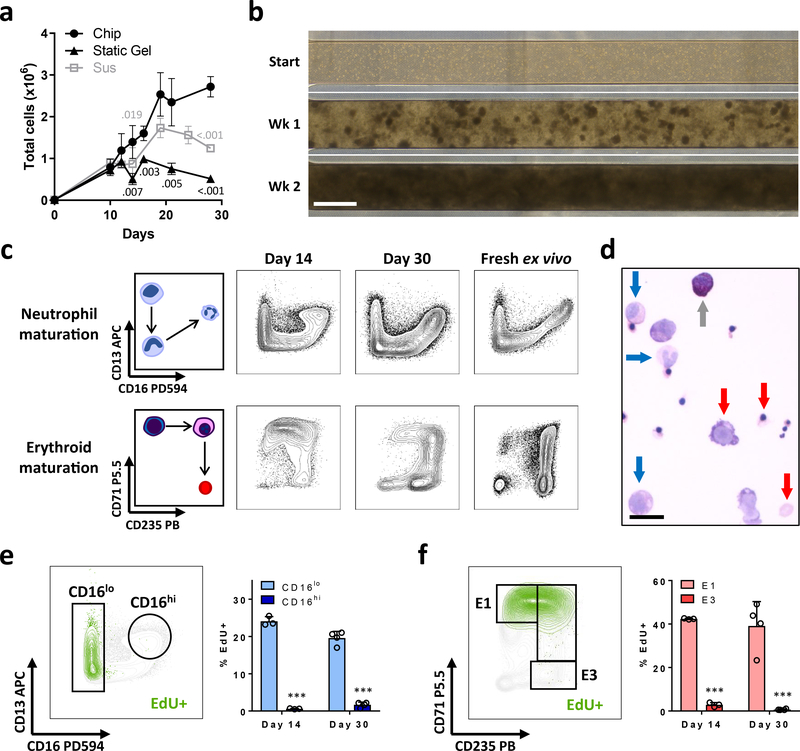
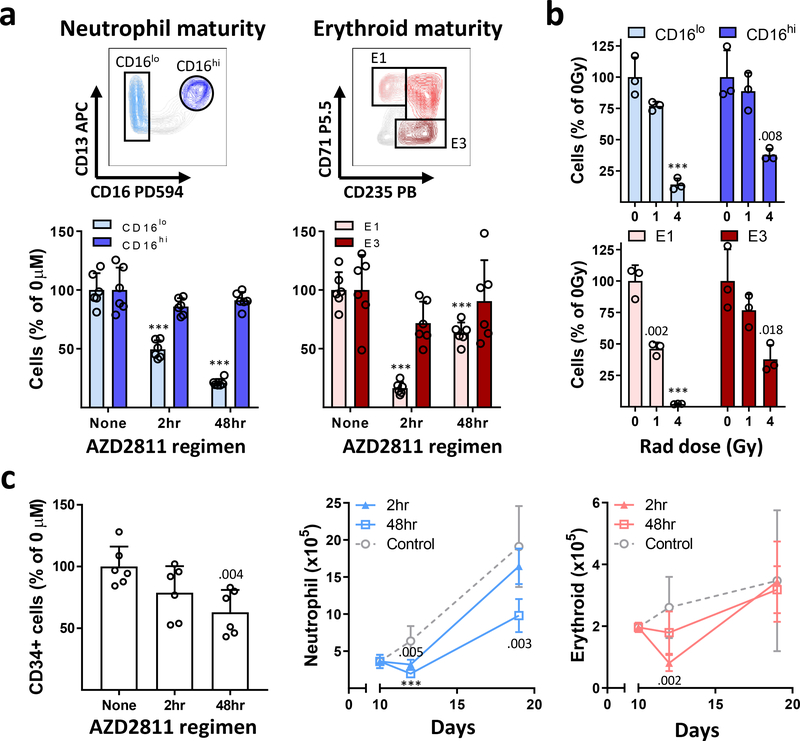
The inaccessibility of living bone marrow (BM) hampers the study of its pathophysiology under myelotoxic stress induced by drugs, radiation or genetic mutations. Here, we show that a vascularized human BM-on-a-chip (BM chip) supports the differentiation and maturation of multiple blood cell lineages over 4 weeks while improving CD34+ cell maintenance, and that it recapitulates aspects of BM injury, including myeloerythroid toxicity after clinically relevant exposures to chemotherapeutic drugs and ionizing radiation, as well as BM recovery after drug-induced myelosuppression. The chip comprises a fluidic channel filled with a fibrin gel in which CD34+ cells and BM-derived stromal cells are co-cultured, a parallel channel lined by human vascular endothelium and perfused with culture medium, and a porous membrane separating the two channels. We also show that BM chips containing cells from patients with the rare genetic disorder Shwachman-Diamond syndrome reproduced key haematopoietic defects and led to the discovery of a neutrophil maturation abnormality. As an in vitro model of haematopoietic dysfunction, the BM chip may serve as a human-specific alternative to animal testing for the study of BM pathophysiology.


Conflict of interest statement

Competing interests

D.E.I. is a founder and holds equity in Emulate, Inc., and chairs its scientific advisory board. D.B.C., V.F., Y.M., L.S.M.T., O.L., R.N., and D.E.I. are co-inventors on a patent application describing the BM Chip. R.D., P.P.-D., D.F., A.M., and L.E. are employed by AstraZeneca, which is developing AZD2811.

Figures

Fig. 1 |
Fig. 1 |. Primary human BM Chip supports in vitro hematopoiesis over 4 weeks in culture and improves CD34+ progenitor survival and colony forming capacity.
a, Photograph of an optically clear PDMS Organ Chip (left) used to create the human BM Chip along with a schematic of the vertical cross-section of the chip (middle) and a magnified diagram of the fluidic channels. b, Schematic of human bone with a micrograph showing normal human BM histology (left) and a schematic cross-sectional view of the human BM Chip on day 0 after seeding showing singly dispersed CD34+ progenitors and BMSCs in a gel in the top channel and an incomplete vascular lining (seeded on either day 0 or day 8) in the bottom channel (left middle). Within 2 weeks of culture initiation, endothelial cells grow to cover all four sides of the lower channel and create a vascular lumen while CD34+ cells undergo expansion and multilineage differentiation (right middle), as illustrated by the immunofluorescence image of a vertical cross section through the gel in the upper channel of the BM Chip taken at day 14 (magenta: erythroid lineage; yellow: megakaryocyte lineage; blue: neutrophil and other hematopoietic lineages; Scale bar, 20 μm).
Fig. 2 |
Fig. 2 |. Continuous myeloerythroid proliferation and differentiation in the BM Chip.
a, Numbers of total cells measured over time in the BM Chip, standard 96-well plate suspension cultures (CD34+ cells alone), or static 3D gel co-cultures (CD34+ cells with BMSCs) as measured by flow cytometry (symbol and error bars represent the mean ± s.d. of n=3–14 chips or 3–6 wells per timepoint; data pooled from 5 independent experiments; numbers indicate P values for static gel [black] and suspension [gray] cultures compared to BM Chips using two-tailed Student’s t-test). b, Bright field micrographs of the top channel of the BM Chip as viewed from above, highlighting the development of cell clusters at week 1 that coalesce to form a dense cellular microenvironment by week 2. Representative image of at least 4 replicates. Scale bar, 1mm. c, Schematic diagrams (left) and representative flow cytometry plots of neutrophil and erythroid maturation (right) showing similar phenotypic profiles between cells extracted from the BM Chip and from fresh human bone marrow. d, Wright-Giemsa stain of cells from a BM Chip at day 21 showing multiple cell types at varying stages of maturation (blue arrows, neutrophil lineage; red arrows, erythroid lineage; gray arrow, non-neutrophil granulocyte; Scale bar, 20 μm). e, Cell proliferation within the neutrophil lineage was assessed by a 2-hour EdU pulse immediately prior to cell harvesting. Flow plot illustrates representative gating strategy for immature CD16lo and mature CD16hi neutrophil subpopulations while EdU+ neutrophil lineage cells are highlighted in green. The percentages of immature and mature neutrophil cells that were EdU+ were quantified by flow cytometry at days 14 and 30. f, Cell proliferation within the erythroid lineage was similarly assessed in the same BM Chips. Flow plot illustrates representative gating strategy for immature CD71+CD235- (E1) and mature CD71-CD235+ (E3) erythroid subpopulations while EdU+ erythroid lineage cells are highlighted in green. The percentages of immature and mature erythroid cells that were EdU+ were quantified by flow cytometry at days 14 and 30. (e and f, n=3–4 chips per timepoint; error bars, s.d.; data pooled from 2 independent experiments; ***P < 0.001 for % EdU+ cells in mature populations compared to immature populations using two-tailed Student’s t-test).
Fig. 3 |
Fig. 3 |. BM Chip predicts clinically observed hematotoxicities at patient-relevant drug exposures.
a, BM Chips, suspension cultures, and static gel co-cultures were allowed to mature for 10–12 days and then treated for 48 hours with various doses of 5-FU. Cells were harvested immediately afterwards and analyzed by flow cytometry to quantitate total and neutrophil lineage cells (symbol and error bars represent the mean ± s.d. of n=3–9 BM Chips or wells per concentration, data pooled from 3 independent experiments; numbers indicate P values for static gel [black] and suspension [gray] cultures compared to BM Chips using two-tailed Student’s t-test; ***P < 0.001). The clinical target range of patient plasma 5-FU concentrations for a 2-day infusion is highlighted in orange for reference (exposure levels are known to cause myelosuppression),. b, BM Chips were created using CD34+ cells from 6 different donors and treated at day 12 with 4μM 5-FU for 2 days. Total cell numbers were quantified at day 14 by flow cytometry (each color represents an individual donor; n=3–4 replicates per donor; error bars, s.d.; ***P < 0.001 using two-tailed Student’s t-test). c, BM Chips were matured for 10 days, treated with 2-hour or 48-hour infusions of AZD2811, and then cultured again in drug-free medium. AZD2811 concentrations were measured by mass spectrometry in BM Chip outlet medium (circles) and used to fit a PK model of BM Chip drug exposure (black line). For reference, in vivo plasma levels of AZD2811 (gray) were simulated for an average patient at a range of clinical doses, for 2-hour (left) and 48-hour (right) infusions based on the known PK characteristics of AZD2811. Drug levels were below the detection limit (ND = not detectable) at 48 and 96 hours after the start of infusion for the 2-hour and 48-hour regimens, respectively. Dotted line represents the detection limit of mass spectrometry during these experiments (symbol and error bars represent the mean ± s.d. of n=4–8 BM Chips per concentration). d, Graphs showing the effects of infusing the BM Chips on day 10 of culture with varying doses of AZD2811 for 2 hours (left) versus 48 hours (right). Total neutrophil (blue) and erythroid (red) cell numbers were quantified on day 12 by flow cytometry (n=6 chips per condition; error bars, s.d.; data pooled from 2 independent experiments; numbers indicate P values of drug-treated versus control chips using two-tailed Student’s t-test; ***P < 0.001).
Fig. 4 |
Fig. 4 |. Confirmation of maturation-dependent cytotoxicity and modeling marrow recovery with the BM Chip.
a, BM Chips were treated on day 10 with the highest area under the curve (AUC) of AZD2811 (2 μM.h) over 2 or 48 hours and analyzed on day 12 by flow cytometry. Representative flow cytometry gating (top) and graphs (bottom) showing the selective decrease in immature CD16lo neutrophil lineage and E1 erythroid cells compared to their more mature CD16hi neutrophil and E3 erythroid cell counterparts (n=6 chips per condition; error bars, s.d.; data pooled from 2 independent experiments; ***P < 0.001 for drug-treated versus control chips using two-tailed Student’s t-test). b, BM Chips were matured for 10 days before exposure to human-relevant doses of ionizing radiation (0,1, or 4 Gy), and then analyzed on day 14 by flow cytometry. Graphs depict human-appropriate dose responsiveness (1 Gy = mild; 4 Gy = severe) and the preferential loss of immature CD16lo neutrophil lineage and E1 erythroid cells (n=3 chips; error bars, s.d.; data representative of 2 independent experiments; numbers indicate P values for irradiated versus control chips using two-tailed Student’s t-test; ***P < 0.001). c, BM Chips were infused on day 10 with the highest AUC of AZD2811 (2μM.h) over 2 or 48 hours and subsequently allowed to recover in drug-free medium until day 19. CD34+ cell numbers (left) were minimally affected when quantified at day 12. Neutrophil (middle) and erythroid (right) numbers were quantified by flow cytometry at days 10, 12, and 19 to assess the ability of BM Chips to recover after injury (n=6 chips per condition at each timepoint; error bars, s.d.; data pooled from 2 independent experiments; numbers indicate P values for drug-treated versus control chips using two-tailed Student’s t-test; ***P < 0.001).
Fig. 5 |
Fig. 5 |. Human BM Chip recapitulates hematopoietic abnormalities observed in Shwachman-Diamond Syndrome patients.
a, Photographs of BM Chips seeded with CD34+ cells from normal donors versus SDS patients at 2 weeks of culture (n=4 chips per condition; representative of 2 independent experiments). Scale bar, 5mm. Neutrophil (b, left), erythroid (b, right), and CD34+ (c) cell numbers were quantified by flow cytometry. d, Percentages of neutrophils with a mature CD16hi surface phenotype in control versus SDS BM Chips were quantified by flow cytometry. e, Graph showing the number of erythroid cells at different maturation states (left) and representative flow plots (right) depicting the percentages of the erythroid subpopulations (E1: immature, E3: mature), as quantified by flow cytometry. f, Representative flow plots depicting the abnormal CD13 vs CD16 neutrophil maturation pattern observed in SDS BM Chips (top) and SDS patient bone marrow aspirates (bottom) as compared to normal controls (SDS = blue, normal = gray). After gating on CD16hi neutrophils in BM Chips and patient marrow samples, CD13 expression for SDS vs control samples was assessed as shown by the histograms (middle, each histogram represents a different patient) and quantified by comparing median fluorescence intensities (right, square and triangle data points belong to the 2 SDS patients tested in BM Chip cultures). (b-f, BM Chips: n=8, error bars represent s.d., data pooled from 2 independent experiments, each using cells from a different normal and SDS patient with 4 chips per experiment; Patient BM aspirates: n=4 normal and n=8 SDS patients; numbers indicate P values for normal versus SDS samples using two-tailed Student’s t-test except CD13 MFI levels for SDS patients fell into 2 distinct groups and were compared with that of control patients by Mann-Whitney U test; ***P < 0.001).

Comment in

References

    1. Doulatov S, Notta F, Laurenti E & Dick JE Hematopoiesis: a human perspective. Cell Stem Cell 10, 120–136 (2012). - PubMed
    1. Eaves CJ Hematopoietic stem cells: concepts, definitions, and the new reality. Blood 125, 2605–2613 (2015). - PMC - PubMed
    1. Wognum B, Yuan N, Lai B & Miller CL Colony forming cell assays for human hematopoietic progenitor cells. Methods Mol Biol 946, 267–283 (2013). - PubMed
    1. Dexter TM, Allen TD & Lajtha LG Conditions controlling the proliferation of haemopoietic stem cells in vitro. J Cell Physiol 91, 335–344 (1977). - PubMed
    1. Sieber S et al. Bone marrow-on-a-chip: Long-term culture of human haematopoietic stem cells in a three-dimensional microfluidic environment. J Tissue Eng Regen Med 12, 479–489 (2018). - PubMed

Publication types