. 2020 Feb;26(2):207-214.
doi: 10.1038/s41591-019-0738-2. Epub 2020 Jan 27.

Somatic gene editing ameliorates skeletal and cardiac muscle failure in pig and human models of Duchenne muscular dystrophy

Affiliations

Somatic gene editing ameliorates skeletal and cardiac muscle failure in pig and human models of Duchenne muscular dystrophy

A Moretti et al. Nat Med. 2020 Feb.

Abstract

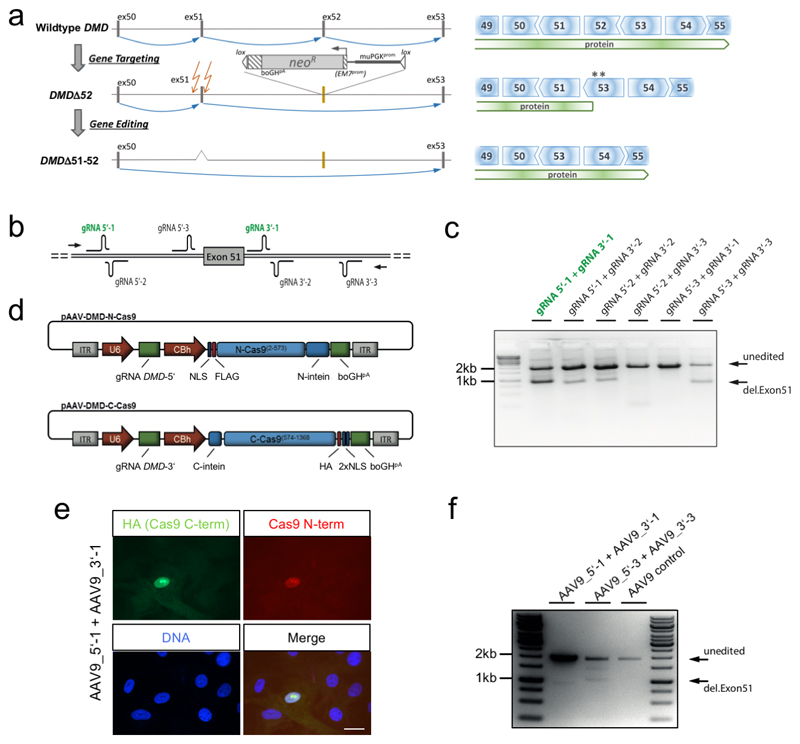
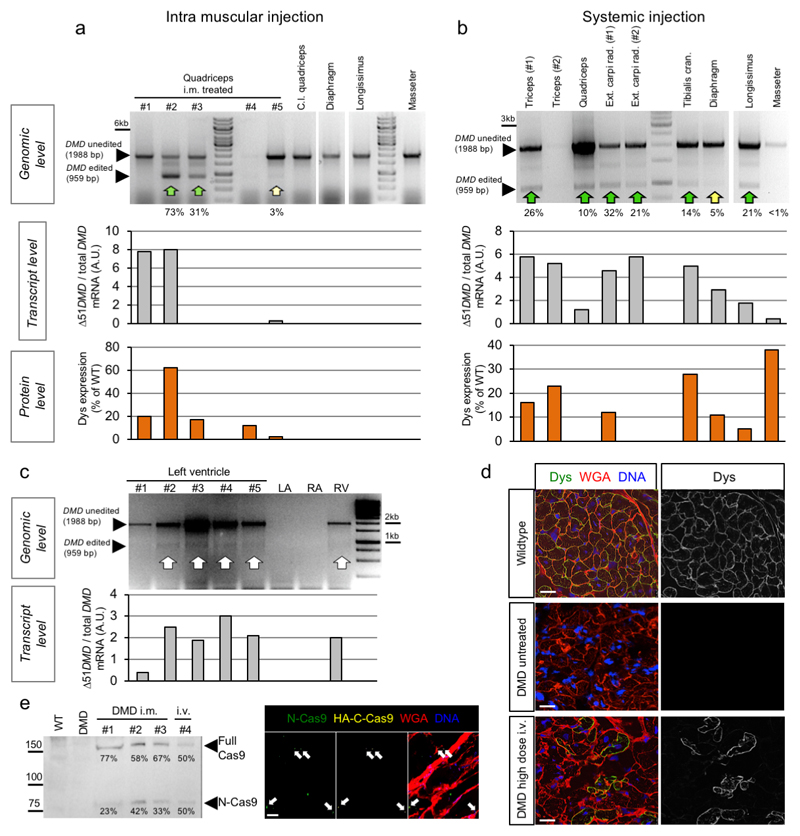
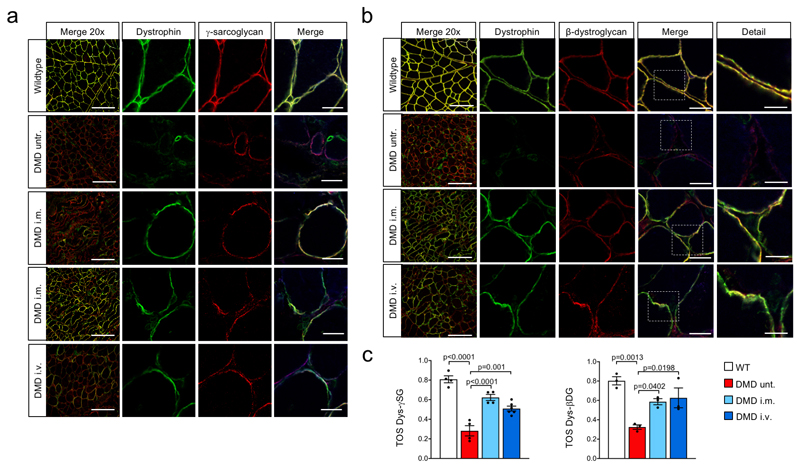
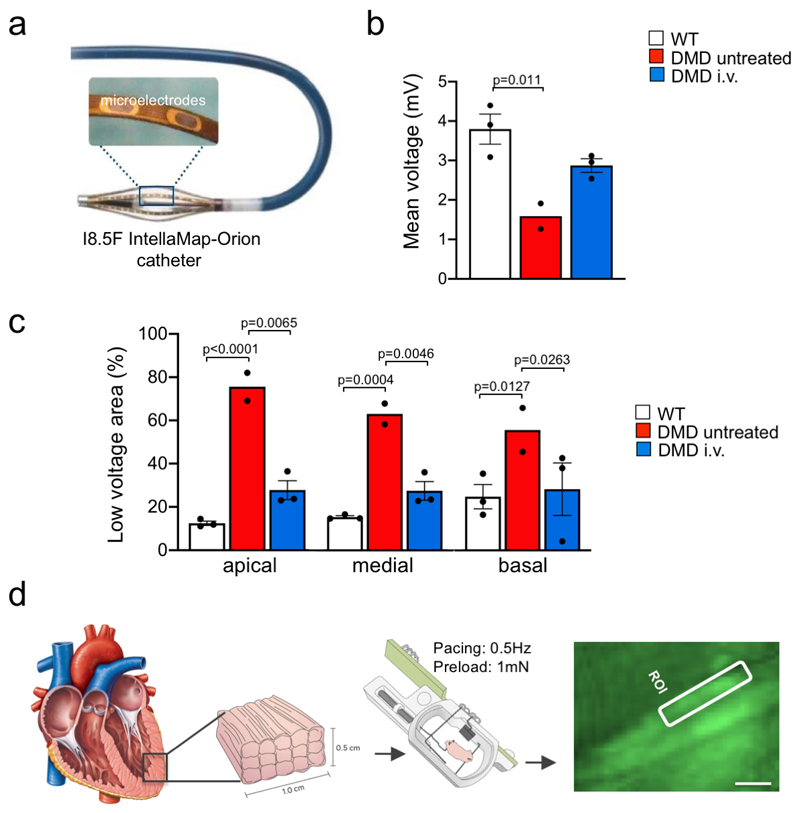
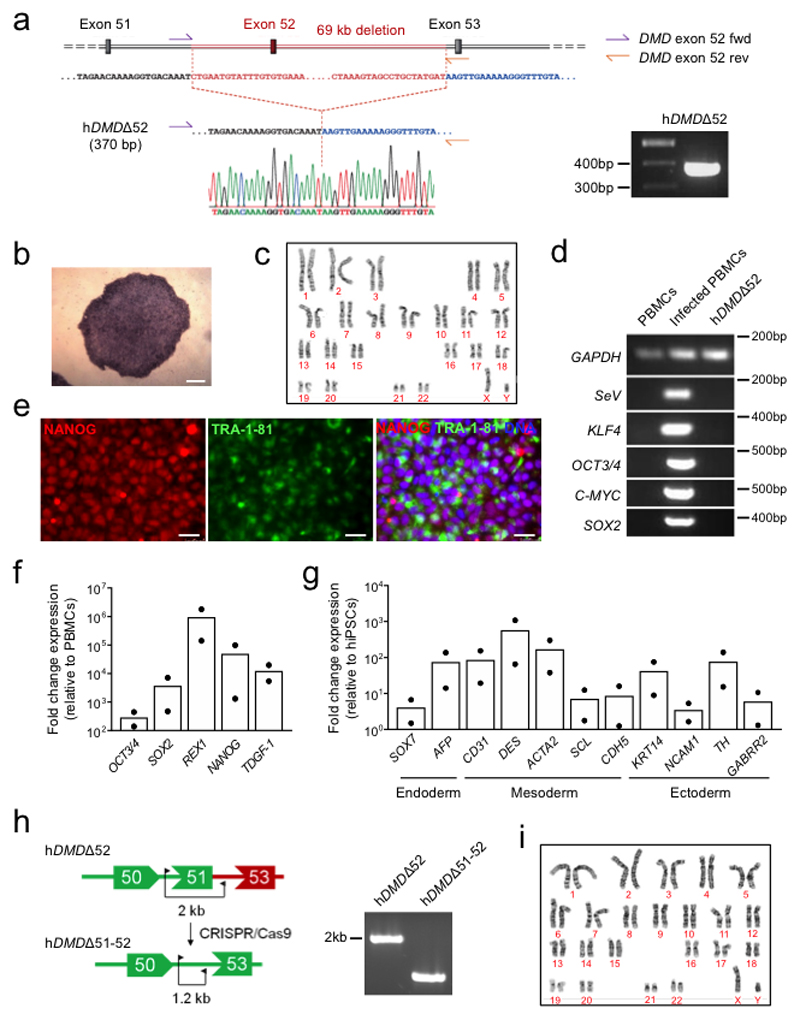
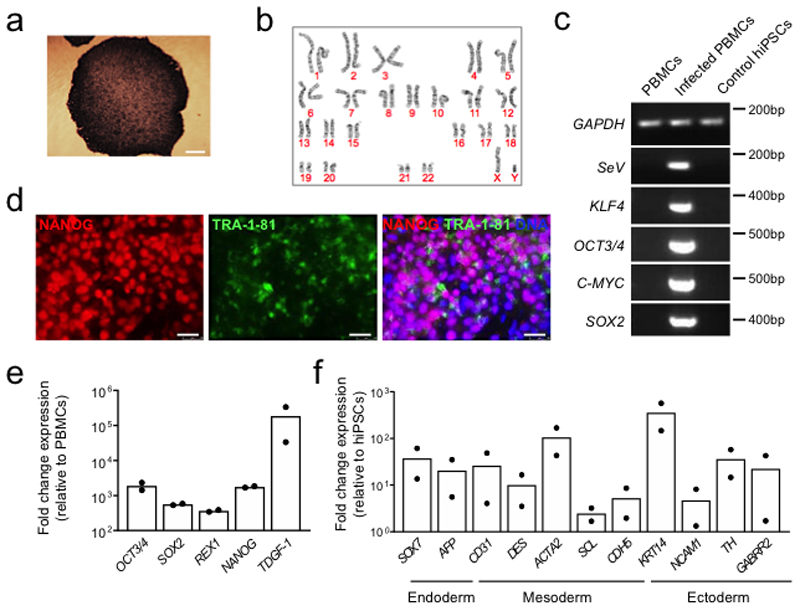
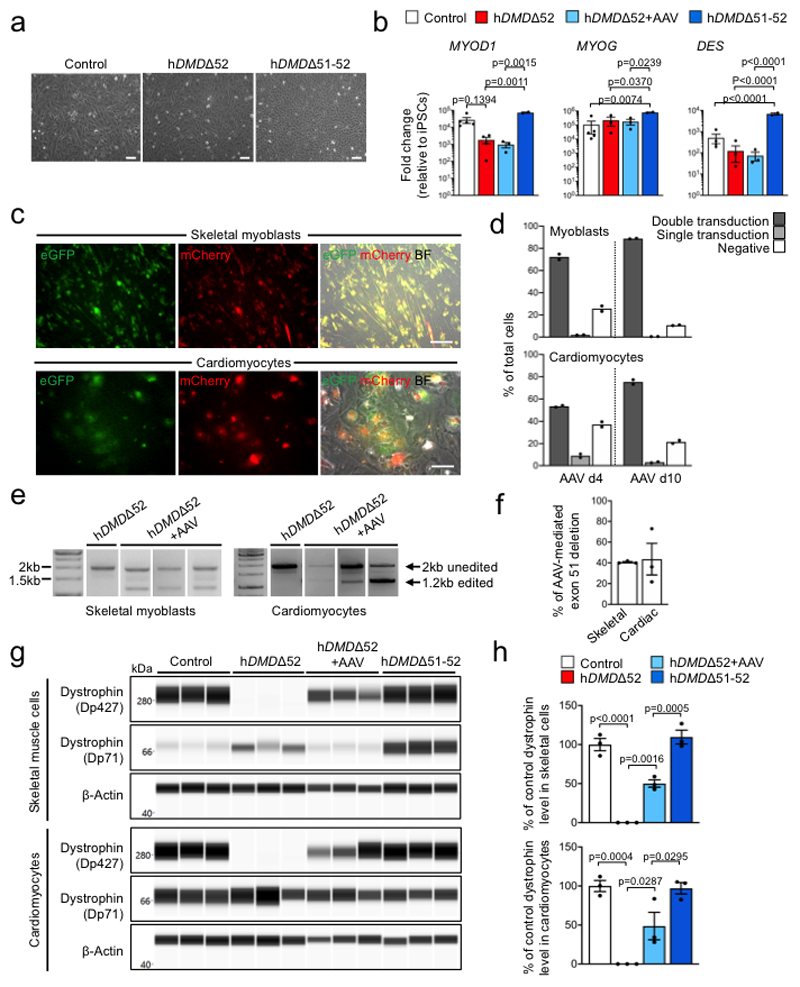
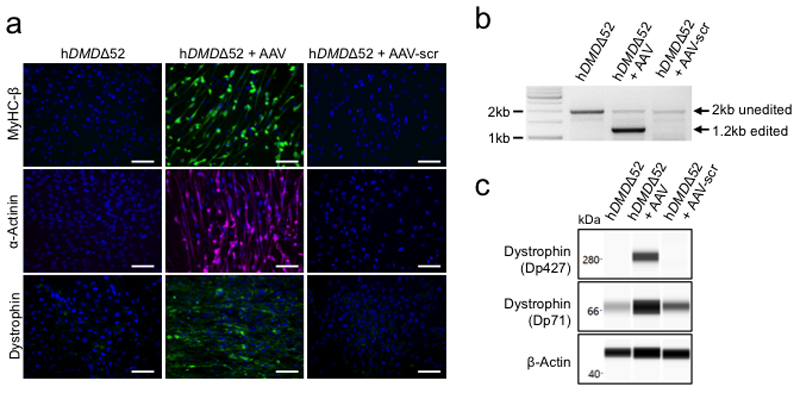
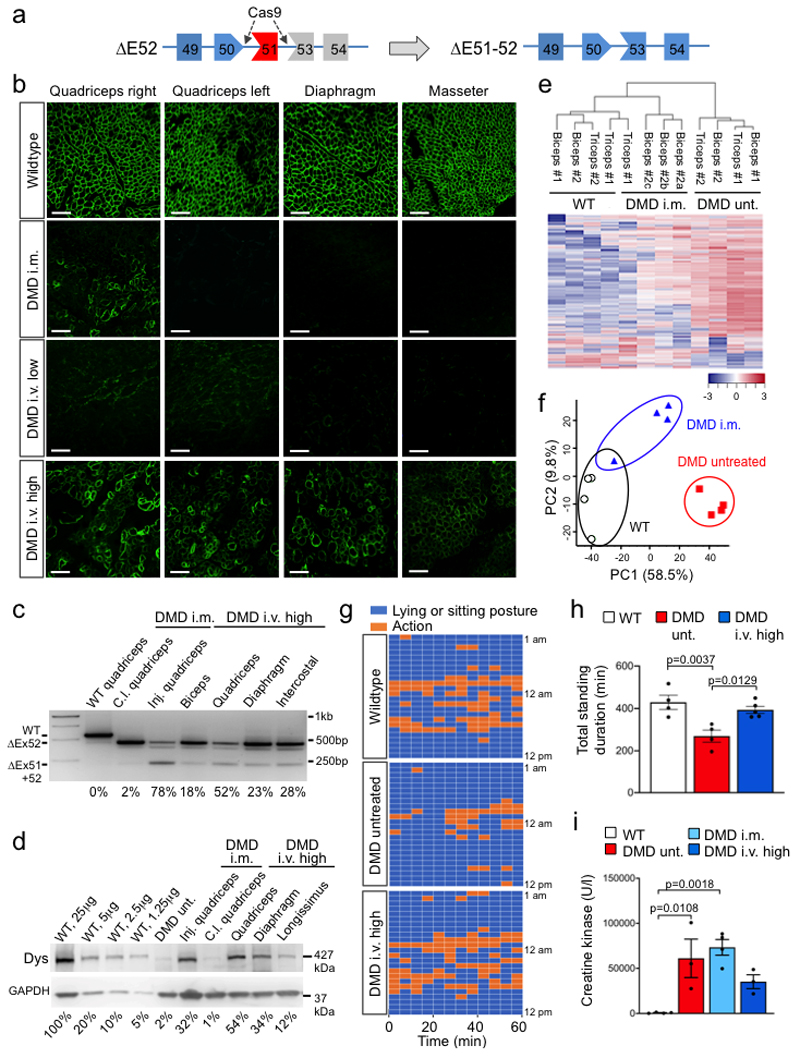
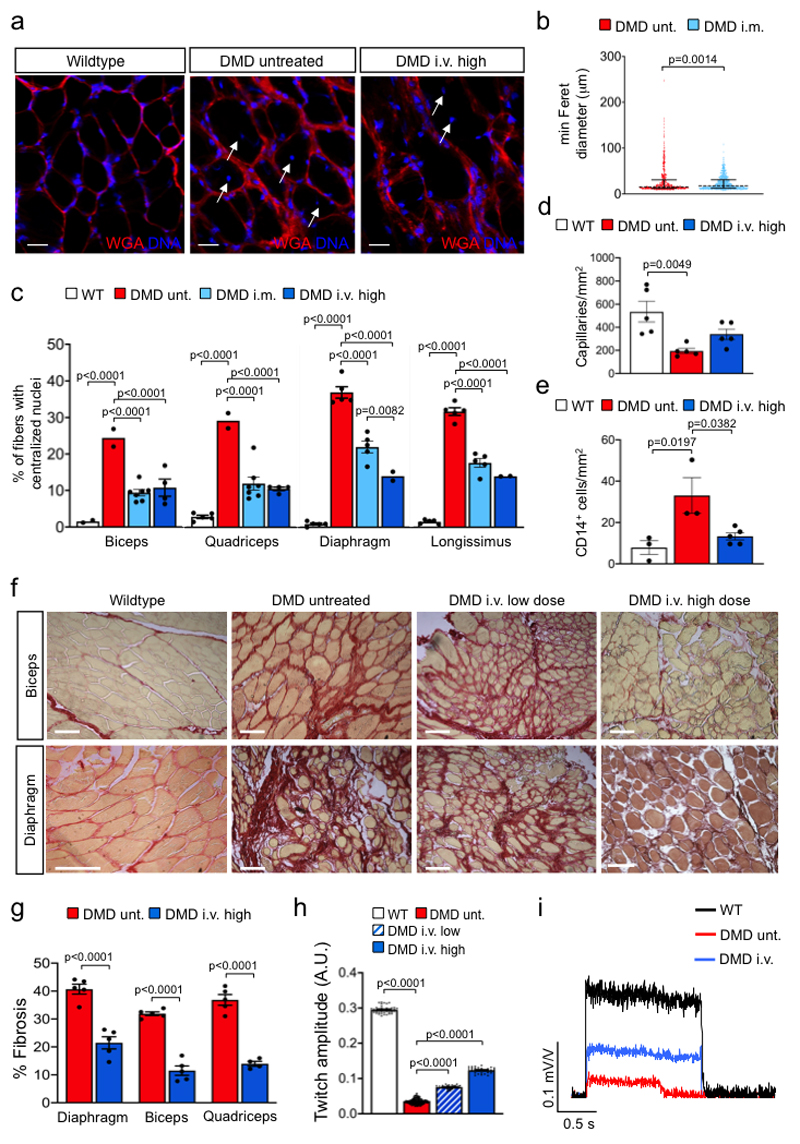
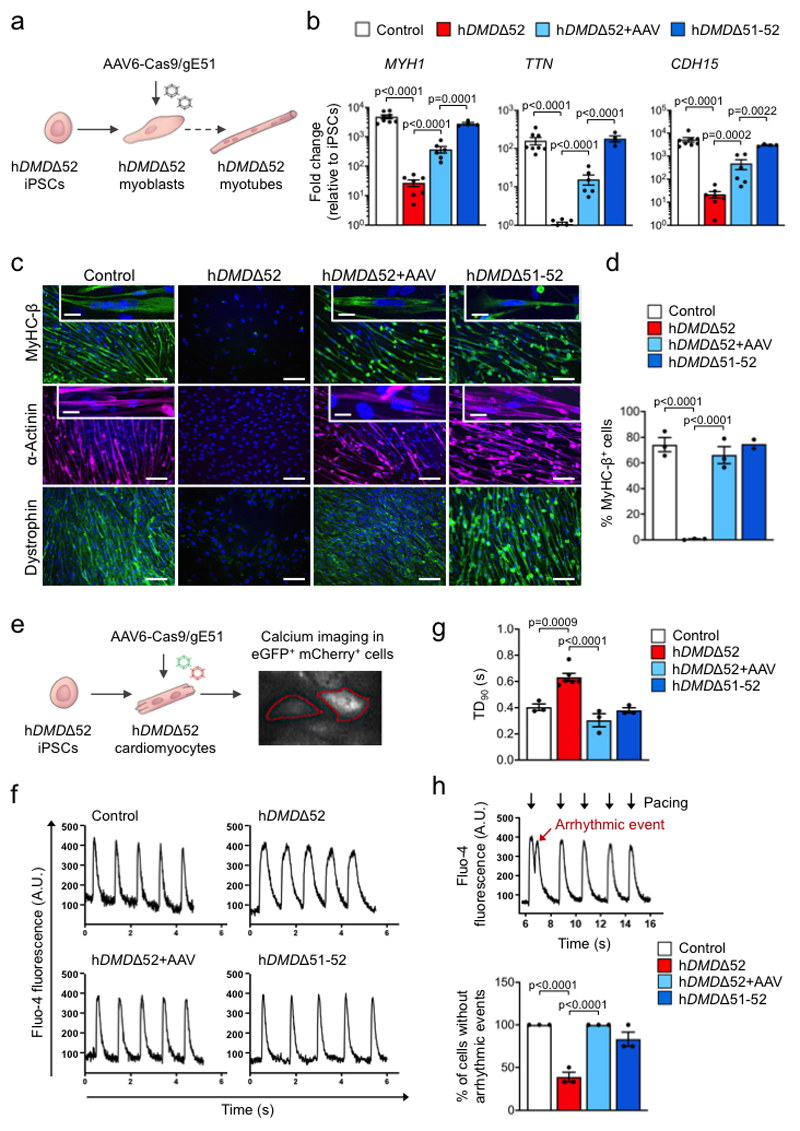
Frameshift mutations in the DMD gene, encoding dystrophin, cause Duchenne muscular dystrophy (DMD), leading to terminal muscle and heart failure in patients. Somatic gene editing by sequence-specific nucleases offers new options for restoring the DMD reading frame, resulting in expression of a shortened but largely functional dystrophin protein. Here, we validated this approach in a pig model of DMD lacking exon 52 of DMD (DMDΔ52), as well as in a corresponding patient-derived induced pluripotent stem cell model. In DMDΔ52 pigs1, intramuscular injection of adeno-associated viral vectors of serotype 9 carrying an intein-split Cas9 (ref. 2) and a pair of guide RNAs targeting sequences flanking exon 51 (AAV9-Cas9-gE51) induced expression of a shortened dystrophin (DMDΔ51-52) and improved skeletal muscle function. Moreover, systemic application of AAV9-Cas9-gE51 led to widespread dystrophin expression in muscle, including diaphragm and heart, prolonging survival and reducing arrhythmogenic vulnerability. Similarly, in induced pluripotent stem cell-derived myoblasts and cardiomyocytes of a patient lacking DMDΔ52, AAV6-Cas9-g51-mediated excision of exon 51 restored dystrophin expression and amelioreate skeletal myotube formation as well as abnormal cardiomyocyte Ca2+ handling and arrhythmogenic susceptibility. The ability of Cas9-mediated exon excision to improve DMD pathology in these translational models paves the way for new treatment approaches in patients with this devastating disease.


Conflict of interest statement

Competing interest

C.K. and W.W. have filed a patent for G2-AAV9-Cas9-gE51, which is covered by the results of Figures 1-3. All other authors have no competing interest.

Figures

Extended Data Figure 1
Extended Data Figure 1. DMDΔ52 pig model and in-vitro testing of gene editing strategy.
a, Scheme of the generation and gene editing strategy of the DMDΔ52 pig model (left) and consequences of the genetic alterations at the protein level (right). DMD Exon 52 was replaced with a neomycin selection cassette (neoR), flanked by a murine PGK (muPGKprom) and an EM7 promoter (EM7prom), a bovine growth hormone polyadenylation signal (boGHpA) and loxP sites (lox). Blue arrows indicate splice events. Asterisks indicate stop codons occurring in exon 53 due to reading frame incompatibility. Intended cutting sites for therapeutic gene editing are indicated by orange arrows. b, Scheme of gRNAs cloned into pAAV-N-Cas9 and pAAV-C-Cas9 vectors and tested in different combinations by transfection of porcine cells and PCR amplification (arrows: primer locations) of genomic DNA. c, Gel showing results of this test. d, Schematic representation of the intein-split-Cas9 system, consisting of two AAV constructs each harbouring one DMD-specific gRNA (gRNA DMD-5’ and gRNA DMD-3’, respectively) under the control of a U6 promoter and either the N-terminal or the C-terminal half of the Cas9 nuclease (N-Cas9(2-573) or C-Cas9(574-1368), respectively), fused to N- or C-terminal split-intein domains (N-intein and C-intein, respectively), under the control of a CBh promoter. NLS, nuclear localization sequence. FLAG, flag-tag. HA, HA-tag. e, Immunocytochemistry for both the N- and the C-terminal Cas9 peptides after AAV co-transduction of primary porcine myoblasts using a pair of AAV constructs (AAV9_5’_1 and AAV9_3’_1) harbouring gRNAs 5’-1 and 3’-1, respectively (representative for n=2). Scale bar, 15 μm. f, PCR analysis of genomic editing as in panel c in primary porcine kidney cells co-transduced with the above-mentioned pair of AAV constructs, with another pair (AAV9_5’_3 and AAV9_3’_3, harbouring gRNAs 5’-3 and 3’-3) or with control AAV, as indicated (representative for n=2 transductions).
Extended Data Figure 2
Extended Data Figure 2. System analyses of DMD exon 51 deletion in pig skeletal muscles and heart after injection of AAV9-Cas9-gE51.
a,b, Top, genomic PCR analysis of DMD gene editing in samples from indicated skeletal muscles of DMD pigs treated by intramuscular (i.m) (a) or high dose intravenous (b) injection with G2-AAV9-Cas9-gE51, representative of 2 (a) and 3 (b) animals. Percentages of edited (ΔEx51+52) relative to total (ΔEx52 + ΔEx51+52) amplicon are shown. Quantifications by RT-PCR of the ratio of edited to total DMD mRNA expression (Δ51DMD / total DMD, middle) and mass spectrometry-based quantification of dystrophin protein (Dys) expression (bottom) are shown. C.l. = contralateral. c, Top, genomic PCR assessing cardiac DMD exon 51 editing in DMD pigs (five specimens of left ventricle (LV), left atrium (LA), right atrium (RA), right ventricle (RV), representative of 3 animals, are shown) treated with high dose intravenous injection of G2-AAV9-Cas9-gE51. Expected band sizes corresponding to unedited and edited DNA are indicated. Bottom, quantification of the ratio of edited to total DMD transcript (Δ51DMD/total DMD) by quantitative RT-PCR. d, Immunofluorescence for dystrophin (Dys) with wheat germ agglutinin (WGA) membrane staining in heart tissue of wildtype and untreated or high dose i.v. treated DMD pigs, representative of 8 images collected from 2 animals per group. Scale bars, 20 μm. e, left, immunoblotting for Cas9 in M. quadriceps muscle from 4 AAV9-Cas9-gE51 treated pigs as indicated, using an antibody against the Cas9 N-terminus. The expected band sizes corresponding to N-Cas9-N-intein (N-Cas9) and full-length Cas9 protein (Full Cas9) are indicated. Right, immunofluorescence staining of M. quadriceps muscle cells with antibodies detecting N-Cas9 (green) and the HA-tag (HA-C-Cas9) (yellow) with WGA membrane staining and DAPI nuclear labelling (DNA) (representative for n=2 pigs). Arrows indicate nuclei with overlapping fluorescence. Scale bar, 10 μm.
Extended Data Figure 3
Extended Data Figure 3. Analysis of off-target effects in porcine tissue samples by targeted deep sequencing.
For each off-target region, the reference sequence shows the gRNAs and PAM sequence marked by a black rectangle and additional 5 nucleotides up- and downstream. The tables show in the first line the number of sequence reads matching the reference sequence and in the following lines the number of INDELS found in each sample. Description of samples: Qc = quadriceps muscle; LV = left ventricle; Liv = liver; WT = wildtype, non-injected; i.m. = intramuscularly-injected; i.v. high = high dose intravenously-injected.
Extended Data Figure 4
Extended Data Figure 4. Colocalisation of dystrophin-associated glycoprotein complex (DGC) and restored dystrophin in DMD pig skeletal muscle after i.m. and i.v. injection of AAV9-Cas9-gE51.
a,b, Immunofluorescence co-staining for dystrophin and γ-sarcoglycan (a) or dystrophin and β-dystroglycan (b) in biceps femoris of wildtype, untreated DMD (DMD untr.) and intramuscularly (DMD i.m.) or intravenously (DMD i.v.) AAV9-Cas9-gE51-treated DMD pigs. Top and bottom rows for i.m. treated DMD in (a) are of areas close and distant to the injection site, respectively. Scale bars, 200 μm (left 20x merge column), 20 μm (right merge column), and 10 μm (detail column in b). c, Quantification of colocalization of dystrophin with either γ-sarcoglycan or β-dystroglycan. A threshold overlap score (TOS) was calculated giving a dimensionless number reflecting the degree of co-occurrence of signals between dystrophin and γ-sarcoglycan (TOS Dys-γSG, n=4 images except DMD i.v. n=6, collected from 2 pigs) or dystrophin and β-dystroglycan (TOS Dys-βDG, n=3 images from 2 pigs), with values ranging from 0 (no colocalisation) to 1 (perfect colocalisation). Data (Source Data Extended Data Fig. 4) are mean±SEM with p values from a one-way ANOVA with Bonferroni’s multiple comparison test (TOS Dys-γSG F=34.92, df=14; TOS Dys-βDG F=11.33, df=8).
Extended Data Figure 5
Extended Data Figure 5. In-vivo electro-mapping and ex-vivo single-cell Ca2+ analyses of DMD hearts.
a, Schematic drawing of the I8.5F IntellaMap-Orion catheter used for high-resolution 3D-mapping, containing 64 flat microelectrodes (0.8 mm diameter) in a basket configuration with 8 splines that is steerable in 2 directions and can be opened and closed to provide appropriate wall contact for detection of electrophysiological signals. b, Mean voltage measured by in-vivo electro-mapping of the heart of wildtype (WT, n=3 animals), untreated DMD (n=2) and high dose intravenously (i.v.) G2-AAV9-Cas9-gE51 treated DMD (n=3) pigs (Source Data Extended Data Fig. 5), indicated as mean±SEM with p values from a one-way ANOVA with Tukey’s multiple comparison test (F=11.59, df=5). c, Size of endocardial low voltage area, expressed as percentage of the whole region, in indicated regions of the heart of WT (n=3 animals), untreated DMD (n=2) and high dose i.v. treated DMD (n=3) pigs (Source Data Extended Data Fig. 5), indicated as mean±SEM with p values from a two-way ANOVA with Tukey’s multiple comparison test (F=38.31, df=15). d, Schematic diagram of the experimental procedure for ex-vivo single-cell Ca2+ measurements, achieved by processing left-ventricular transmural sections to 1.0 x 0.5 cm myocardial tissue slices of 300 μm thickness, which were then submitted to physiological preload and continuous electrical field stimulation in biomimetic culture chambers. The right panel shows a pseudocolor image of Fluo-4 fluorescence recorded from a slice loaded with this calcium sensor and a region of interest (ROI) over which the average fluorescence signal was calculated to investigate intracellular calcium dynamics.
Extended Data Figure 6
Extended Data Figure 6. Generation of patient-specific DMD iPSC isogenic lines.
a, Left, schematic representation of the DMD exon 52 deletion in the patient-specific hDMDΔ52 hiPSCs and position of the primers (DMD exon 52 fwd and DMD exon 52 rev) used for PCR verification of the mutation. Right, a gel showing the 370 bp amplicon specific for the exon 52 deletion. Bottom, results from Sanger sequencing of the hDMDΔ52 hiPSCs. b, Bright field image of alkaline phosphatase staining in hDMDΔ52 hiPSC colonies at passage 6. Scale bar, 100 μm. c, Normal karyotype in hDMDΔ52 hiPSCs at passage 23. d, RT-PCR analysis of the Sendai vector (SeV) and transgenes OCT4, SOX2, KLF4 and c-MYC in untransduced peripheral blood mononuclear cells (PBMCs, negative control), Sendai-transduced PBMCs (positive control) and hDMDΔ52 hiPSCs at passage 13, using GAPDH as an endogenous control. e, Immunofluorescence analysis of the pluripotency markers NANOG and TRA-1-81 in hDMDΔ52 hiPSCs at passage 24. Scale bar, 50 μm. f, RT-qPCR analysis of the pluripotency markers OCT4, SOX2, NANOG, REX1 and TDGF-1 in hDMDΔ52 hiPSCs. The relative mean fold change expression normalized to GAPDH is indicated, n=2 (passages 13 and 20). g, RT-qPCR analysis of markers of endoderm (SOX7, AFP), mesoderm (CD31, DES, ACTA2, SCL, CDH5) and ectoderm (KRT14, NCAM1, TH, GABRR2) after 21 days of spontaneous embryoid body differentiation of hDMDΔ52 hiPSCs. The relative mean fold change expression normalized to GAPDH is indicated, n=2 independent differentiations. h, Left, schematic diagram of the deletion of DMD exon 51 in hDMDΔ52 hiPSCs and primers used for PCR verification of the deletion (right). i, Normal karyotype after CRISPR/Cas9 editing confirmed in hDMDΔ51-52 hiPSCs at passage 14. Uncropped gels for (a), (d), and (h) and statistics for (f) and (g) are shown in Source Data Extended Data Fig. 6.
Extended Data Figure 7
Extended Data Figure 7. Generation of control iPSCs from a healthy, young male donor.
a, Bright field image of alkaline phosphatase staining performed on control hiPSC colonies at passage 12. Scale bar, 100 μm. b, Normal male karyotype confirmed in control hiPSCs at passage 21. c, RT-PCR analysis of the Sendai vector (SeV) and transgenes OCT4, SOX2, KLF4 and c-MYC in untransduced peripheral blood mononuclear cells (PBMCs, negative control), Sendai-transduced PBMCs (positive control) and control hiPSCs at passage 24, using GAPDH as an endogenous control. d, Immunofluorescence analysis of the pluripotency markers NANOG and TRA-1-81 in hiPSCs at passage 21. Scale bar, 50 μm. e, RT-qPCR analysis of the pluripotency markers OCT4, SOX2, NANOG, REX1 and TDGF-1 in hiPSCs. The mean fold change expression relative to parental patient PBMCs and normalized to GAPDH is indicated, n=2 (passages 15 and 21). f, RT-qPCR analysis of markers of endoderm (SOX7, AFP), mesoderm (CD31, DES, ACTA2, SCL, CDH5) and ectoderm (KRT14, NCAM1, TH, GABRR2) in control hiPSCs after 21 days of spontaneous embryoid body differentiation. The mean fold change expression relative to hiPSCs and normalized to GAPDH is indicated, n=2 independent differentiations. Uncropped gels for (c) and statistics for (e) and (f) are shown in Source Data Extended Data Fig. 7.
Extended Data Figure 8
Extended Data Figure 8. Infection of hDMDΔ52 hiPSC-derived skeletal myoblasts and cardiomyocytes with AAV6-Cas9-gE51 restores expression of a re-framed dystrophin.
a, Bright field images of skeletal myoblasts from control, hDMDΔ52 or hDMDΔ51-52 hiPSCs, representative of >10 images (3 independent differentiations). Scale bars, 100 μm. b, RT-qPCR analysis of MYOD1, MYOG and DES in control (n=5 independent differentiations except DES n=4), untreated hDMDΔ52 (n=4 except MYOD1 n=3), hDMDΔ52 6 days after AAV6-Cas9/gE51 transduction (hDMDΔ52+AAV, n=3) or hDMDΔ51-52 (n=2) myoblasts. Relative fold change expression normalized to GAPDH is shown as mean±SEM with p values from a one-way ANOVA with Bonferroni’s multiple comparison test (MYOD1 F=12.86, df=10; MYOG F=7.159, df=9; DES F=103, df=9). c, Images of hDMDΔ52 skeletal myoblasts (top) or cardiomyocytes (bottom) 10 days after transduction with AAV6-Cas9/gE51 vectors encoding eGFP or mCherry (AAV6-N-Cas9/gRNA5’-eGFP and AAV6-C-Cas9/gRNA3’-mCherry), representative of >20 images (2 independent differentiations). Scale bars, 100 μm. d, Percentages of double-positive, single-positive and double-negative skeletal myoblasts (top) or cardiomyocytes (bottom) 4 and 10 days after transduction. e, Genomic PCR analysis of DMD exon 51 excision after AAV6-Cas9/gE51 transduction of hiPSC-derived skeletal myoblasts or cardiomyocytes (3 independent differentiations). f, Percentage of exon 51 excision based on relative PCR band intensity (edited versus total), indicated as mean±SEM. g, Dystrophin detection by capillary-based immunoassay after myotube induction of control, untreated or AAV6-Cas9/gE51-transduced hDMDΔ52 and hDMDΔ51-52 skeletal myoblasts (top) and in control, untreated or AAV6-Cas9/gE51-transduced hDMDΔ52 and hDMDΔ51-52 cardiomyocytes (bottom) from 3 independent differentiations. Bands represent the main (Dp427) and a shorter dystrophin isoform (Dp71). β-actin, loading control. h, Dystrophin (Dp427) levels normalized to β-actin expressed as percentage of mean level in control cells are depicted for skeletal muscle cells (top) and cardiomyocytes (bottom) as mean±SEM (p values from one-way ANOVA with Bonferroni’s multiple comparison test; Skeletal cells F=63.46, df=8, Cardiomyocytes F=21.59, df=8).
Extended Data Figure 9
Extended Data Figure 9. AAV6-Cas9/scrambled-gRNA transduction of hDMDΔ52-iPSC-derived myoblast fails to restore dystrophin expression and capability of the cells to differentiate into myotubes.
a, Immunofluorescence staining for myosin heavy chain β (MyHC-β), α-actinin and dystrophin 14 days after skeletal myotube induction of untreated hDMDΔ52 myoblasts, hDMDΔ52 myoblasts transduced with AAV6-Cas9/gE51 (hDMDΔ52 + AAV) or hDMDΔ52 myoblasts transduced with AAV6-Cas9/scrambled-gRNA (hDMDΔ52 + AAV-scr) (representative for n=3 independent differentiations). Scale bars, 100 μm. b, Genomic PCR analysis of DMD exon 51 excision 14 days after skeletal myotube induction of untreated hDMDΔ52 myoblasts, hDMDΔ52 myoblasts transduced with AAV6-Cas9/gE51 (hDMDΔ52 + AAV) or hDMDΔ52 myoblasts transduced with AAV6-Cas9/scrambled-gRNA (hDMDΔ52 + AAV-scr), representative of 2 independent differentiations. The expected band sizes corresponding to edited and unedited genomic DNA are indicated. Uncropped gel is shown in Source Data Extended Data Fig. 9. c, Capillary-based immunoassay of dystrophin 14 days after skeletal myotube induction of untreated hDMDΔ52 myoblasts and hDMDΔ52 myoblasts transduced with AAV6-Cas9/gE51 (hDMDΔ52 + AAV) or AAV6-Cas9/scrambled-gRNA (hDMDΔ52 + AAV-scr), using β-actin as a loading control, representative of 2 independent differentiations. The antibody detected both the main dystrophin isoform (Dp427) and a shorter isoform (Dp71). Uncropped blots are shown in Source Data Extended Data Fig. 9.
Extended Data Figure 10
Extended Data Figure 10. Levenshtein analysis of distance of guide RNAs around variants identified by whole-genome sequencing of isogenic hDMDΔ51-52 iPSCs compared to the parental hDMDΔ52 iPSCs.
Histogram of all minimal Levenshtein distances obtained by aligning the two DMD-E51 guide RNAs to all variants identified by whole-genome sequencing in isogenic hDMDΔ51-52 iPSCs compared to the parental hDMDΔ52 iPSC line, applying a sliding window starting 25 bp upstream and ending 25 bp downstream of each variant. For any candidate region around a variant at least 7 operations (base exchanges, deletions, insertions) were required to match one of the gRNAs, indicating that the variants were not off-target effects of the CRISPR-Cas treatment.
Figure 1
Figure 1. Genome editing of DMDΔ52 pigs by Cas9-mediated exon 51 excision
a, Schematic diagram of gene editing in DMDΔ52 pigs. Loss of exon 52 of the DMD gene (ΔE52) leads to an out-of-frame mutation with a premature stop codon, preventing protein translation. Cas9-mediated excision of exon 51 (ΔE51-52) corrects the reading frame, resulting in translation of an internally truncated but functional protein. Out of frame exons are illustrated in gray. b, Immunofluorescent staining for dystrophin expression in the indicated muscles (Quadriceps = Musculus quadriceps) in wildtype and DMDΔ52 (DMD) pigs, either at the injection sites after intramuscular (i.m.) AAV9-Cas9-gE51 treatment or after intravenous (i.v.) treatment with 2x10¹³ virus particles/kg (low dose) or 2x10¹⁴ virus particles/kg (high dose), representative of 9 images collected in n=3 independent experiments per group. Scale bars, 200 μm. c, Levels of wildtype (WT), mutated DMD (ΔE52) and edited DMD (ΔE51-52) in WT limb muscle or in the indicated muscles of DMDΔ52 pigs treated with i.m. or high dose i.v. G2-AAV9-Cas9-gE51, as assessed by RT-PCR, representative of 3 technical. Percentages indicate expression level of the corrected transcript (ΔE51-52) relative to total transcript (Δ52 + ΔE51-52). Inj. = injected, c.l. = contralateral (cf. Source Data Fig. 1). d, Immunoblotting for dystrophin (Dys) in extracts from WT quadriceps at the indicated concentrations, DMD untreated (unt.) quadriceps, and indicated muscles of DMD pigs after either i.m. or i.v. AAV9-Cas9-gE51 treatment. Percentages indicate expression of dystrophin protein relative to WT. Dystrophin levels were normalized to GAPDH, used as a loading control, representative of 3 independent experiments (cf. Source Data Fig.1). e, Unsupervised hierarchical clustering of normalized label free quantification intensity values for skeletal muscle samples of WT, i.m. injected DMD, and untreated (unt.) DMD pigs. The color code indicates z-score normalized expression values. f, Principal component analysis (PCA) of proteins isolated from biceps and triceps muscles from WT, untreated and i.m. treated DMD pigs (n=2 animals per group) presented in (e). Each symbol represents an individual sample (n=4 per group). Percentage of variance explained by each component is indicated. g, h, Representative data from 24h behavioral observation of a single wildtype, a DMD untreated, and a DMD high dose i.v. treated pig (g) and quantification of the total standing time per pig for WT (n=5), DMD (n=4) and DMD high dose i.v. treated (n=5), indicated as mean±SEM with p values from a one-way ANOVA (with Bonferroni’s multiple comparison test, F=9.819; df=10) (h, cf. Source Data Fig. 1). i, Serum creatine kinase levels of WT (n=4) and DMD pigs, the latter untreated (=unt., n=3) or after i.m. injection of AAV9-Cas9-gE51 (n=4) or after high dose i.v. (n=3) treatment with G2-AAV9-Cas9-gE51, indicated as mean±SEM (cf. Source Data Fig. 1) with p values from a one-way ANOVA with Bonferroni’s multiple comparison test (F=9.986, df=10)
Figure 2
Figure 2. Genome editing of DMDΔ52 restores the structure and function of diseased skeletal muscle
a, Wheat germ agglutinin (WGA) staining (red) of cell borders and DNA labeling (blue) in quadriceps muscles of wildytpe pigs and untreated or high dose intravenous (i.v.) G2-AAV9-Cas9-gE51-injected DMD pigs, representative of 9 images collected in 3 pigs per group. Scale bars, 25 μm. b, Minimum diameter of cross-sectional fibers in untreated (unt.) DMD (n=406 of 3 pigs) and intramuscularly treated (i.m.) DMD muscle fibers (n=641 of 2 pigs), represented as dot plots showing all data points as well as the median (dashed line) and the quartiles (solid lines) (cf. Source Data Fig. 2), with the p value from an unpaired two-tailed t-test (t=3.212, df=1045). c, Percentage of fibers with centralized nuclei in skeletal muscle samples from biceps (B), quadriceps (Q) muscles, diaphragm (D) and longissimus dorsi (LD) of WT (B n=2; Q, D, LD n=5), untreated DMD (B, Q n=2; D, LD n=5) and i.m. (B, Q, n=7; D, LD n=5) or high dose i.v. treated DMD (B, Q n=4; D, LD n=2) of 2 animals per group (cf. Source Data Fig. 2), mean±SEM with p values from a two-way ANOVA with Tukey’s multiple comparison test (F=219.3, df=51). d, Density of CD31+ capillaries in quadriceps muscles of WT, untreated DMD and high dose i.v. treated DMD pigs (n=5 Q sections from n=3 animals, cf. Source Data Fig. 2), indicated as mean±SEM with p values from a one-way ANOVA with Bonferroni’s multiple comparison test (F=8.228, df=12). e, Quantification of CD14+ cells in skeletal muscle tissue of WT, untreated DMD and high dose i.v. treated DMD pigs (n=3 Q sections for WT and untreated DMD, 5 sections for high dose i.v. treated DMD from n=3 animals per group, cf. Source Data Fig.2), indicated as mean±SEM with p values from a one-way ANOVA with Bonferroni’s multiple comparison test (F=7.610, df=8). f, g, Sirius red staining showing the level of interstitial fibrosis in the peripheral muscle and diaphragm of WT, untreated DMD and low dose or high dose i.v. treated DMD pigs, representative of 10 sections collected in 3 independent experiments (f) and percentage of fibrosis in D and Q of untreated DMD (n=3) and high dose i.v. treated DMD pigs (n=3) (Source Data Fig. 2), indicated as mean±SEM with p values from a two-way ANOVA with Bonferroni’s multiple comparison test (F=238, df=23) (g). Scale bars in (f), 50 μm. h, Twitch amplitude after common peroneal nerve stimulation (cf. Methods) in WT (n=41 traces in n=3 pigs), untreated DMD (n=138 traces in n=3 pigs) and low dose (n=30 traces in n=2 pigs) or high dose (n=29 traces in n=3 pigs) i.v. treated DMD pigs (cf. Source Data Fig.2), indicated as mean±SEM with p values from a one-way ANOVA with Bonferroni’s multiple comparison test (F=11241, df=234). i, Tetanic contraction after 1.5 s common peroneal nerve stimulation at 50 Hz in WT, untreated DMD and i.v. treated DMD pigs, representative of 3 independent experiments for WT, DMD untreated (= unt.) and DMD high dose i.v..
Figure 3
Figure 3. Genome editing of DMDΔ52 improves survival and reduces cardiac arrhythmogenic vulnerability
a, Kaplan-Meier curve of the survival time of untreated DMDΔ52 (DMD) (n=13) and high dose intravenously (i.v.) G2-AAV9-Cas9-gE51 treated DMD (n=7) pigs (Log Rank (Mantel Cox) p=0.032). b, Left, ejection fraction (EF) of wildtype (WT) (n=3), untreated DMD (n=3) and i.v. treated DMD (n=4) pigs, indicated as mean±SEM with p value from a one-way ANOVA with Bonferroni’s multiple comparison test (F=10.53, df=7). Middle and right, dP/dtmax and dPt/dtmin, respectively, of WT (n=3), untreated DMD (n=3) and high dose i.v. treated DMD (n=4) pigs, indicated as mean±SEM (cf. Source Data Fig. 3). c, Immunoblotting for dystrophin (Dys) in heart extracts (A=atrium, LV=left ventricle) from a WT pig at the indicated extract concentration), an untreated DMD pig, and four different high dose i.v. treated DMD pigs, representative of 3 replicates. Percentages indicate the level of dystrophin protein relative to WT based on the standard curve obtained by loading the indicated amounts of WT extract. Dystrophin levels were normalized to GAPDH, used as a loading control (cf. Source Data Fig. 3). d, High-resolution electrophysiological mapping indicating areas of normal excitation amplitude (> 1.3 mV, violet), low excitation amplitude (< 1.3 mV, yellow) or scar (< 0.3 mV, red) in WT (n=3), untreated DMD (n=2) and i.v. treated DMD pigs (n=3, see also Extended Data Figure 5a-c). Insets indicate angulation of the detection plane (front and rear) in DMD untreated and DMD high dose i.v., 45° right and left angulation in wildtype. e, Top, Sirius red staining showing the level of interstitial fibrosis in equivalent apical regions of WT, untreated DMD and i.v. treated DMD hearts, representative of 10 sections collected in 3 pigs per group. Scale bar, 200 μm. Bottom, corresponding quantification of the percentage of fibrosis (all n=5, cf. Source Data Fig. 3), indicated as mean±SEM with p value from an unpaired two-tailed t-test (t=7.619, df=8). f, Exemplary single-cell calcium transients in myocardial slices (loaded with Fluo-4 AM) from n=3 WT, n=2 untreated DMD and n=2 i.v. treated DMD pig hearts. g, Time to peak (top) and amplitude (bottom) of single-cell calcium transients in WT (n=10 cells from 2 animals), untreated DMD (unt., n=12 cells from 2 animals) and high dose i.v. treated DMD (n=8 cells from 3 animals) myocardial slices (cf. Source Data Fig. 3), indicated as mean±SEM with p values from a one-way ANOVA with Bonferroni’s multiple comparison test (F=63.24, df=27 and F=8.094, df=27, respectively). h, Left, exemplary images of Fluo-4 fluorescence in single cardiomyocytes within untreated DMD and high dose i.v. treated DMD myocardial slices with 4 regions of interest (ROI). Right, traces of the averaged fluorescence intensity within the 4 ROIs showing calcium transient propagation within single cells. The data are representative of 5 samples from n=2 animals in each group. Scale bars, 10 μm.
Figure 4
Figure 4. Somatic genome editing of human DMDΔ52 rescues disease phenotypes of skeletal and cardiac muscle cells from patient-specific iPSCs
a, Schematic indicating strategy to rescue defective skeletal myotube formation in myoblasts differentiated from hDMDΔ52 hiPSCs by transduction with two AAV6 vectors containing an intein-split Cas9 and gRNAs designed to induce DMD exon 51 excision. b, RT-qPCR analysis of skeletal myotube markers 7-14 days after myotube induction in control (n=8 independent differentiations), hDMDΔ52 (n=7), hDMDΔ52+AAV (n=6) and hDMDΔ51-52 (n=4) myoblasts (cf. Source Data Fig. 4), indicated as mean fold change±SEM with p values from a one-way ANOVA of the logarithmized values with Bonferroni’s multiple comparison test (MYH1 F=26.21, df=3; TTN F=14.32, df=21; CDH15 F=10.84, df= 21). c, Immunofluorescence analysis of myosin heavy chain β (MyHC-β), α-actinin and dystrophin 14 days after myotube induction in myoblasts of all groups, representative of >30 images collected in 3 independent differentiations except hDMDΔ51-52 n=2. Scale bars, 100 μm. Insets show multinucleation (top) and sarcomeric striations (bottom). Scale bars, 25 μm. d, Percentage of MyHC-β+ cells 7-14 days after myotube induction of myoblasts of each of the indicated groups (cf. Source Data Fig. 4), represented as mean fold change±SEM with p values from a one-way ANOVA with Bonferroni’s multiple comparison test (F=53.74, df=7), n=3 independent experiments in which hiPSCs were differentiated to skeletal muscles except hDMDΔ51-52 n=2. e, Schematic of the experimental design in which cardiomyocytes differentiated from DMDΔ52 hiPSCs were transduced with two AAV6 vectors containing an intein-split Cas9 and gRNAs designed to induce DMD exon 51 excision (as well as either eGFP or mCherry), followed by calcium imaging. f, Exemplary single-cell Ca2+ traces of hiPSC-derived cardiomyocytes of each of the indicated (1 Hz pacing) measured by Fluo-4 fluorescence. Data are representative of 3 independent experiments in which hiPSCs were differentiated to cardiomyocytes. g, Ca2+ transient durations at 90% peak decay (TD90) in hiPSC-derived cardiomyocytes of each of the indicated groups (1 Hz pacing), indicated as mean±SEM with p values from a one-way ANOVA with Bonferroni’s multiple comparison test (F=21.64, df=11), n=3 independent experiments in which hiPSCs were differentiated to cardiomyocytes, except hDMDΔ52 n=6. h, Top, single-cell Ca2+ trace showing an arrhythmic event in a hDMDΔ52 cardiomyocyte, representative of 3 independent experiments in which hiPSCs were differentiated to cardiomyocytes; bottom, percentage of cells measured without an arrhythmic event occurring in hiPSC-derived cardiomyocytes of each of the indicated groups (cf. Source Data Fig. 4), indicated as mean±SEM with p values from a one-way ANOVA with Bonferroni’s multiple comparison test (F=33.23, df=8), n=3 independent differentiations experiments in which hiPSCs were differentiated to cardiomyocytes.

Comment in

References

    1. Klymiuk N, et al. Dystrophin-deficient pigs provide new insights into the hierarchy of physiological derangements of dystrophic muscle. Human Molecular Genetics. 2013;22:4368–4382. - PubMed
    1. Truong DJ, et al. Development of an intein-mediated split-Cas9 system for gene therapy. Nucleic Acids Res. 2015;43:6450–6458. - PMC - PubMed
    1. Aartsma-Rus A, Van Deutekom JC, Fokkema IF, Van Ommen GJ, Den Dunnen JT. Entries in the Leiden Duchenne muscular dystrophy mutation database: an overview of mutation types and paradoxical cases that confirm the reading-frame rule. Muscle & nerve. 2006;34:135–144. - PubMed
    1. White S, et al. Comprehensive detection of genomic duplications and deletions in the DMD gene, by use of multiplex amplifiable probe hybridization. American journal of human genetics. 2002;71:365–374. - PMC - PubMed
    1. Moser H. Duchenne muscular dystrophy: pathogenetic aspects and genetic prevention. Human genetics. 1984;66:17–40. - PubMed

Publication types

MeSH terms