. 2020 Feb;15(2):145-153.
doi: 10.1038/s41565-019-0626-4. Epub 2020 Jan 27.

Transformable peptide nanoparticles arrest HER2 signalling and cause cancer cell death in vivo

Affiliations

Transformable peptide nanoparticles arrest HER2 signalling and cause cancer cell death in vivo

Lu Zhang et al. Nat Nanotechnol. 2020 Feb.

Abstract

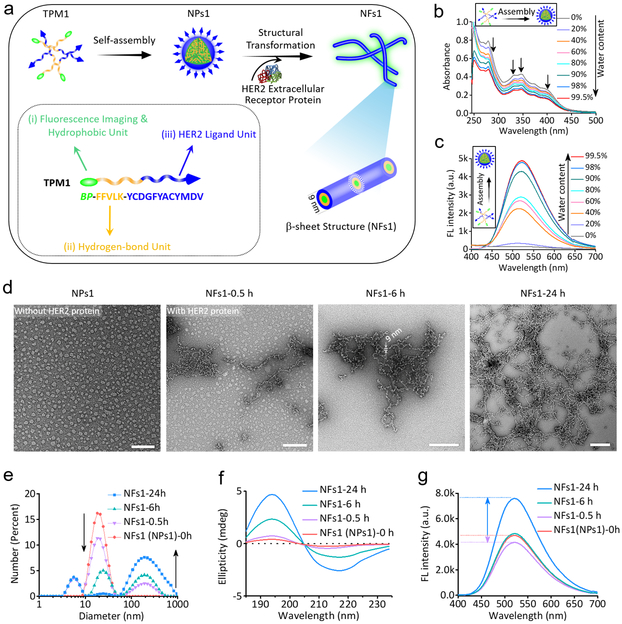
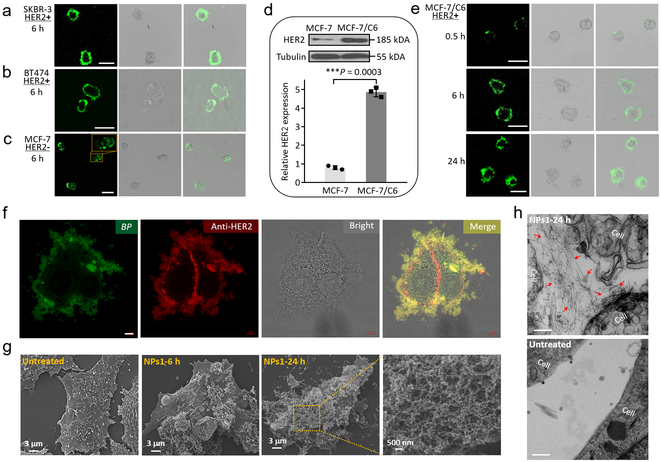
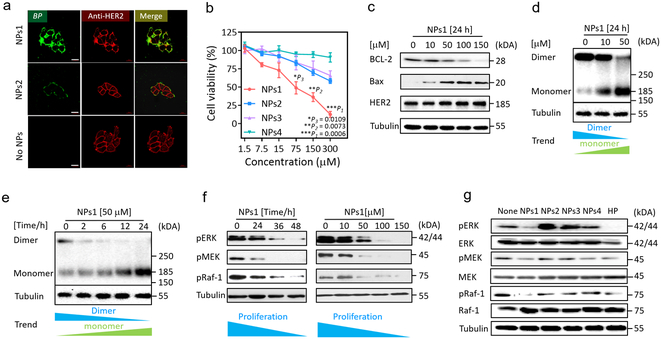
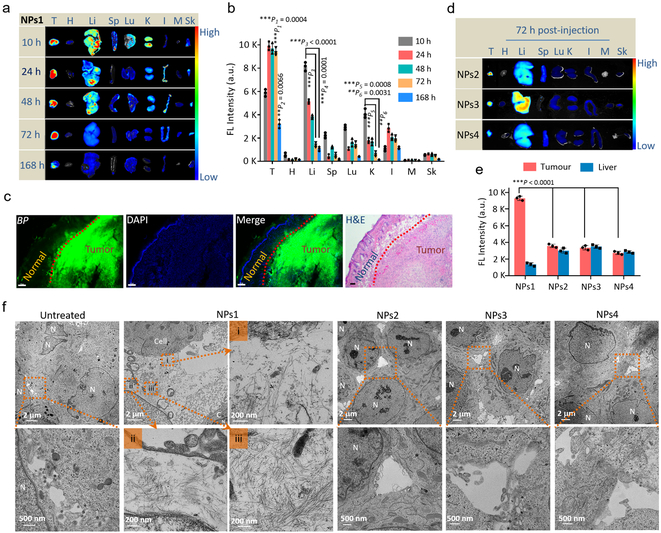
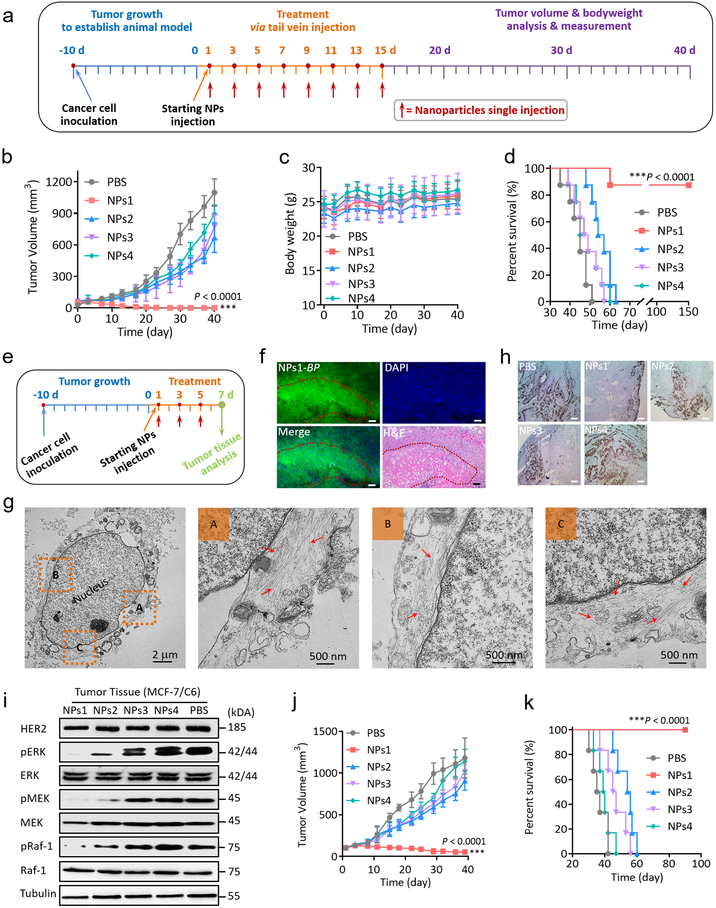
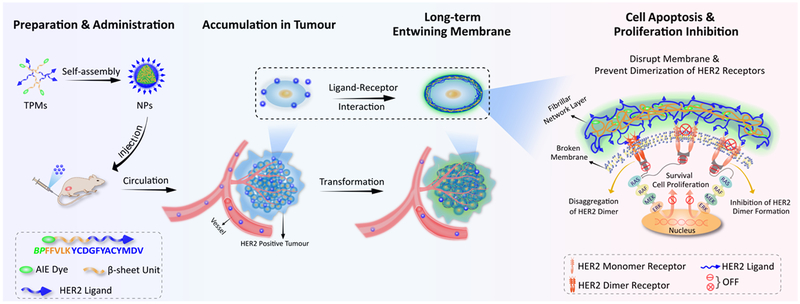
Human epidermal growth factor receptor 2 (HER2) is overexpressed in >20% of breast cancers. Dimerization of HER2 receptors leads to the activation of downstream signals enabling the proliferation and survival of malignant phenotypes. Owing to the high expression levels of HER2, combination therapies are currently required for the treatment of HER2+ breast cancer. Here, we designed non-toxic transformable peptides that self-assemble into micelles under aqueous conditions but, on binding to HER2 on cancer cells, transform into nanofibrils that disrupt HER2 dimerization and subsequent downstream signalling events leading to apoptosis of cancer cells. The phase transformation of peptides enables specific HER2 targeting, and inhibition of HER2 dimerization blocks the expression of proliferation and survival genes in the nucleus. We demonstrate, in mouse xenofraft models, that these transformable peptides can be used as a monotherapy in the treatment of HER2+ breast cancer.


Conflict of interest statement

Competing interests

The authors declare the following competing financial interest(s): K.S.L., L.Z., D.J. and L.W. are the co-inventors of a pending patent on the fibrillar transformable nanoparticles. K.S.L. is the founding scientist of LamnoTherapeutics Inc. which plans to develop the nanotherapeutics described in the manuscript. The remaining authors declare no competing interests.

Figures

Fig. 1.
Fig. 1.. The assembly and fibrillar-transformation of transformable peptide monomer 1 (TPM1) BP-FFVLK-YCDGFYACYMDV.
a, Schematic illustration of self-assembly and in situ structural transformation of TPM1. b,c, Changes in (b) UV-vis absorption and (c) fluorescence of NPs1 upon gradual addition of water (from 0% to 99.5%) into a solution of NPs1 in DMSO; Ex = 380 nm; experiments were repeated three times. d, TEM images of initial NPs1 and NPs1 transformed into nanofibers (NFs1) after interaction with HER2 protein (Mw ≈ 72 KDa) at different time points (0.5, 6 and 24 h). The scale bar in d is 100 nm. Experiments were repeated three times. e-g, Variation of (e) size distribution, (f) CD spectra and (g) fluorescence signal of initial NPs1 and NFs1 at the different time points. Representative picture from three independent tests is shown. The molar ratio of HER2 protein/peptide ligand was approximately 1:1000.
Fig. 2.
Fig. 2.. The morphological characterizations of fibrillar-transformable NPs1 incubation with cultured HER2 positive cancer cells.
a-c, Cellular fluorescence distribution images of NPs1 interaction with (a) SKBR-3 cells (HER2+), (b) BT474 cells (HER2+) and (c) MCF-7 cells (HER2-) for 6 h. Scale bar in a-c is 50 μm. Experiments were repeated three times. d, Western blot and quantitative analysis of relative HER2 protein expression in MCF-7 cells and MCF-7/C6 cells. Data are presented as the mean ± s.d., n = 3 independent experiments. ***P < 0.001 (two-tailed Student’s t-test). Representative picture from three independent tests is shown. e, Cellular fluorescence distribution images of NPs1 interaction with MCF-7/C6 cells (HER2+) at the different time points (0.5, 6 and 24 h). Scale bar in e is 50 μm. Experiments were repeated three times. f, Fluorescence binding distribution images of the nanofibrillar network of NFs1 and HER2 antibody (29D8 rabbit Ab and HER2 peptide of NPs1 recognize different epitopes of HER2 receptor) on the cell membrane of MCF-7/C6 cells. HER2 antibody was used to label HER2 receptors. Scale bar in f is 5 μm. Experiments were repeated three times. g, SEM images of untreated MCF-7/C6 cells and cells treated by NPs1 for 6 h and 24 h. Experiments were repeated three times. h, TEM images of untreated MCF-7/C6 cells and cells treated by NPs1 for 24 h. The red arrow shows fibrillar network. Scale bar in h is 200 nm. Experiments were repeated three times. The concentration of NPs1 was 50 μM.
Fig. 3.
Fig. 3.. The extracellular and intracellular mechanisms of fibrillar-transformable nanoparticles interaction with MCF-7/C6 breast cancer cells.
a, Fluorescence binding distribution images of NPs1 and NPs2 binding HER2 receptors of MCF-7/C6 cells for 8 h. HER2 antibody (29D8 rabbit Ab and HER2 peptide of NPs1 and NPs2 recognize different epitopes of HER2 receptor) was used to label HER2 receptors. The concentration of NPs1 and NPs2 were 50 μM. The scale bar in a is 20 μm. Experiments were repeated three times. b, The viability of MCF-7/C6 cells after incubation with NPs1-4 at the different concentration for 48 h. Data are presented as the mean ± s.d., n = 3 independent experiments. The statistical significance was calculated via a one-way analysis of variance (ANOVA) with a Tukey post-hoc test. *P < 0.05, **P < 0.01, ***P < 0.001. c, Western blot analysis of apoptosis related proteins and HER2 total protein in MCF-7/C6 cells treated by NPs1 for 24 h with different concentration. Experiments were repeated three times. d,e, Western blot analysis of inhibition and disaggregation mechanism of HER2 protein dimer in MCF-7/C6 cells treated by NPs1 (d) for 24 h with different concentration and (e) at 50 μM under different time point. Experiments were repeated three times. f, Western blot analysis of inhibition mechanism of proliferation protein in MCF-7/C6 cells treated by NPs1 at 50 μM under different time point and at 24 h under different concentration. Experiments were repeated three times. g, Western blot analysis of inhibition mechanism of proliferation protein in MCF-7/C6 cells treated by NPs1-4 and Herceptin (HP) at 36 h. The concentration of NPs1-4 were 50 μM, and the concentration of Herceptin was 15 μg/mL as a positive control group. Experiments were repeated three times.
Fig. 4.
Fig. 4.. In vivo evaluation of fibrillar-transformable nanoparticles.
a,b, (a) Time-dependent ex vivo fluorescence images and (b) quantitative analysis of tumour tissues and major organs (heart, liver, spleen, lung, kidney, intestine, muscle and skin) collected at 10, 24, 48, 72 and 168 h post-injection of NPs1. In b, data are presented as the mean ± s.d., n = 3 independent experiments. The statistical significance was calculated via one-way ANOVA with a Tukey post-hoc test. **P < 0.01, ***P < 0.001, the fluorescence signal in tumour tissue at 72 h and 168 h compared with other organs displays tumour accumulation and in situ transformation of fibrillar network with long retention time; the fluorescence signal in liver at 10 h compared with that at 72 and 168 h displays that NPs1 could be removed rapidly from liver; the fluorescence signal in kidney at 10 h compared with that at 72 and 168 h displays that NPs1 could be removed rapidly from kidney. c, The fluorescence distribution images and H&E image of NPs1 in tumour tissue and normal skin tissue at 72 h post-injection (green colour: BP of NPs1; blue colour: DAPI; scale bar in c is 100 μm). Experiments were repeated three times. d, Time-dependent ex vivo fluorescence images of tumour tissues and major organs collected at 72 h post-injection of NPs2-4. e, Quantitative analysis of tumour tissues and livers collected at 72 h post-injection of NPs1-4. In e, data are presented as the mean ± s.d., n = 3 independent experiments. ***P < 0.001, the fluorescence signal of tumour tissue in NPs1 group compared with that in other control groups displays that fibrillar networks in NPs1 group promote long retention time in tumour site. f, TEM images of distribution in tumour tissue and in situ fibrillar transformation of NPs1-4 at 72 h post-i.v. injection and untreated group. The dose of NPs1-4 were 8 mg/kg per injection. In f, MCF-7/C6 cell labeled as “C”; Cell nucleus labeled as “N”. Experiments were repeated three times. The statistical significance was calculated via a one-way ANOVA with a Tukey post-hoc test.
Fig. 5.
Fig. 5.. Anti-tumour activity of fibrillar-transformable nanoparticles in Balb/c nude mice bearing HER2 positive breast tumour.
a, Schematic illustration of tumour inoculation and treatment protocol of mice. b,c, Observation of (b) the tumour inhibition effect and (c) weight change of mice in subcutaneous tumour model during the 40 days of treatment (n = 8 per group; the dose of NPs1-4 were 8 mg/kg per injection). Data are presented as the mean ± s.d. ***P < 0.001. d, Cumulative survival of different treatment groups of mice bearing MCF-7/C6 breast tumour. Seven of the eight mice receiving NPs1 treatment survived over 150 days without any sign of tumour recurrence. One of these eight mice, no longer with detectable tumour, died at around day 60 for unknown reason. e, Schematic illustration of three times treatment protocol of mice for tumour tissue analysis (n = 6 per group; the dose of NPs1-4 were 8 mg/kg per injection). f, The fluorescence distribution images in tumour tissue and H&E anti-tumour image post three times injection of NPs1 (green colour: BP of NPs1; blue colour: DAPI; scale bar in f is 100 μm). Experiments were repeated six times; a representative image is shown. g, Representative TEM images of late membrane rapture and cell death by the nanofibrillar network after injection of NPs1 three times. The red arrow shows fibrillar network. h, Ki-67 stain images of tumour tissues treated by different groups after three doses of treatment. Scale bar in h is 25 μm. Experiments were repeated six times; a representative image is shown. i, Western blot analysis of inhibition mechanism of HER2 protein and proliferation proteins in MCF-7/C6 tumour tissues treated by different groups after three doses of treatment. Experiments were repeated six times; a representative image is shown. j, Observation of the tumour inhibition effect in subcutaneous BT474 HER2 positive breast cancer models during the 40 days of treatment (n = 6 per group; the dose of NPs1-4 were 8 mg/kg per injection). Data are presented as the mean ± s.d. ***P < 0.001 compared with PBS control group. k, Cumulative survival of different treatment groups of mice bearing BT474 breast tumours. The statistical significance was calculated via one-way ANOVA with a Tukey post-hoc test.
Schema 1.
Schema 1.
Schematic illustration of self-assembly, accumulation and in situ fibrillar transformation of transformable peptide monomers (TPM) in tumour tissue of HER2 positive cancer, and the extracellular and intercellular mechanisms of apoptosis promotion and proliferation inhibition events.

References

    1. Slamon DJ et al. Human breast cancer: correlation of relapse and survival with amplification of the HER-2/neu oncogene. Science 235, 177–182 (1987). - PubMed
    1. Arteaga CL et al. Treatment of HER2-positive breast cancer: current status and future perspectives. Nat. Rev. Clin. Oncol 9, 16–32 (2011). - PubMed
    1. Gravalos C & Jimeno A HER2 in gastric cancer: a new prognostic factor and a novel therapeutic target. Ann. Oncol 19, 1523–1529 (2008). - PubMed
    1. Ferte C, Andre F & Soria JC Molecular circuits of solid tumours: prognostic and predictive tools for bedside use. Nat. Rev. Clin. Oncol 7, 367–380 (2010). - PubMed
    1. Roukos DH & Briasoulis E Individualized preventive and therapeutic management of hereditary breast ovarian cancer syndrome. Nat. Clin. Pract. Oncol 4, 578–590 (2007). - PubMed

Publication types