. 2020 Feb;15(2):154-161.
doi: 10.1038/s41565-019-0619-3. Epub 2020 Jan 27.

Pro-efferocytic nanoparticles are specifically taken up by lesional macrophages and prevent atherosclerosis

Affiliations

Pro-efferocytic nanoparticles are specifically taken up by lesional macrophages and prevent atherosclerosis

Alyssa M Flores et al. Nat Nanotechnol. 2020 Feb.

Abstract

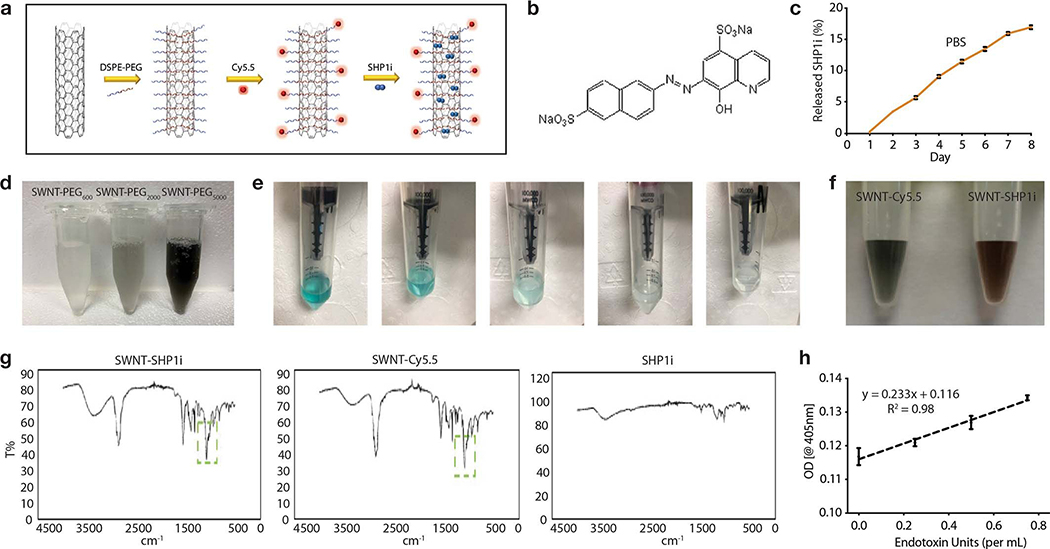
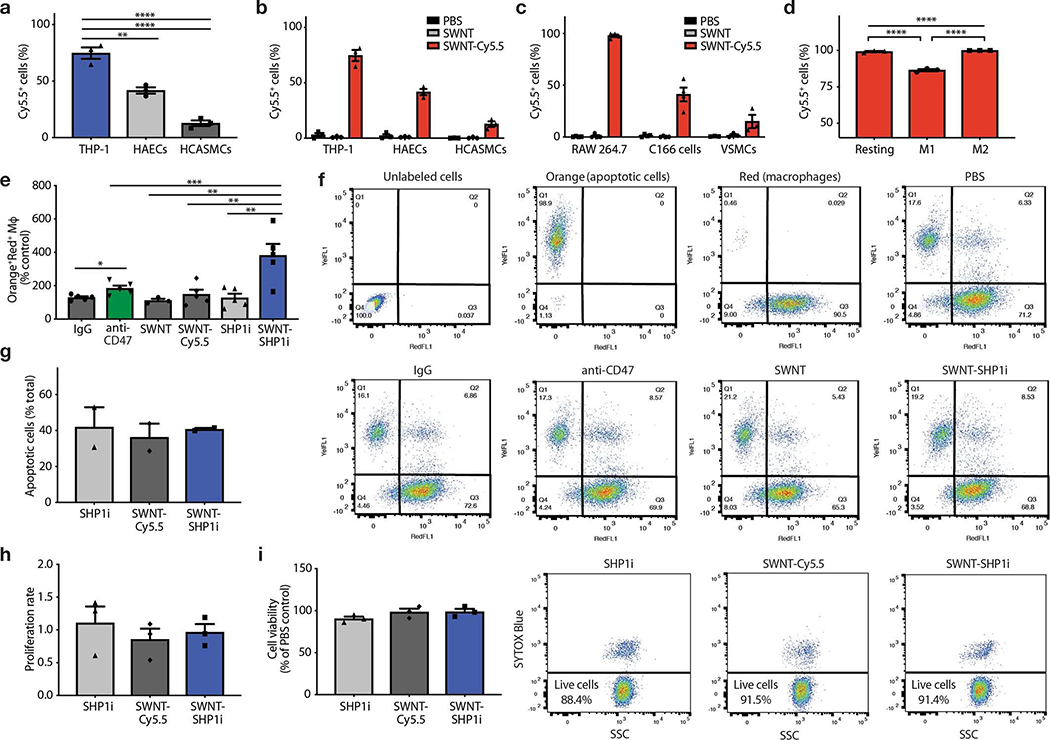
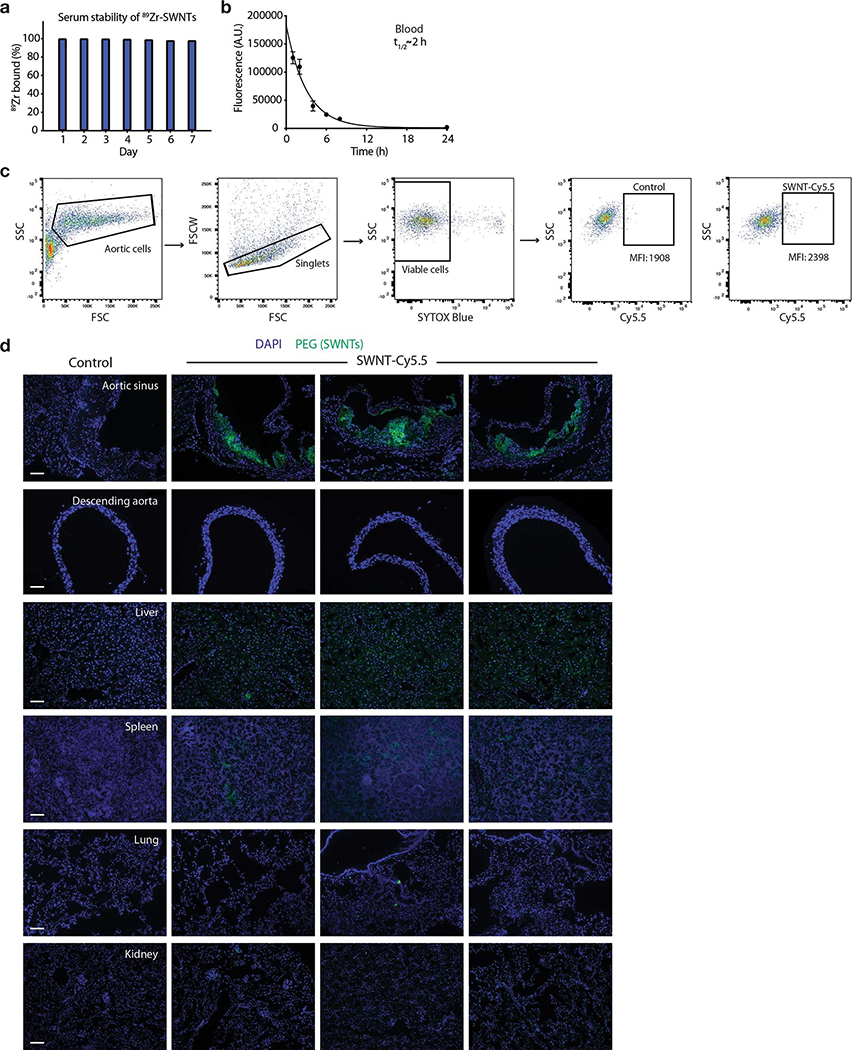
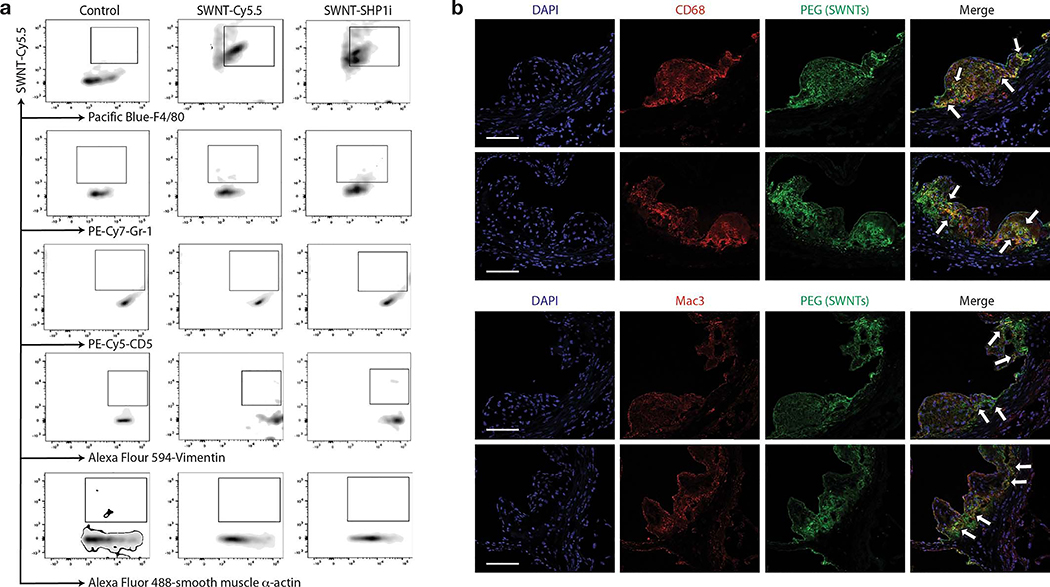
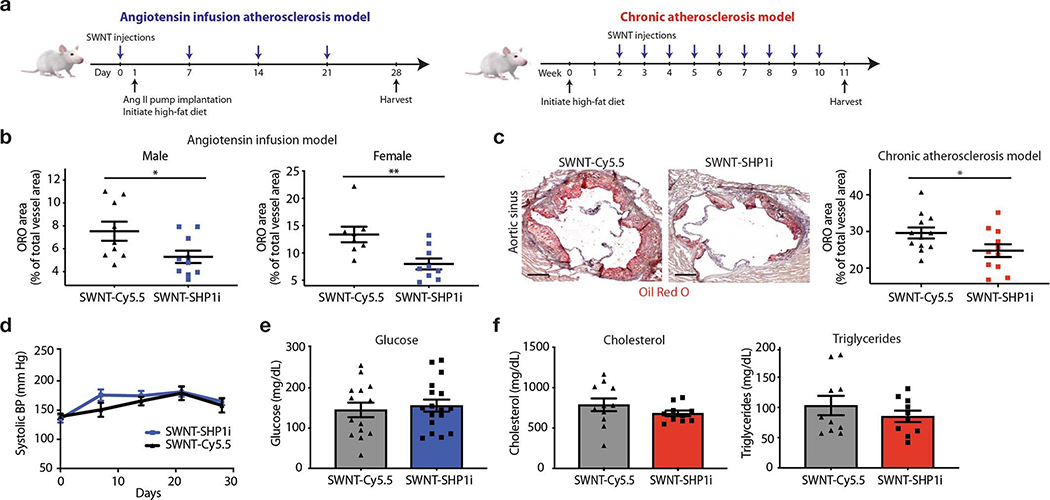
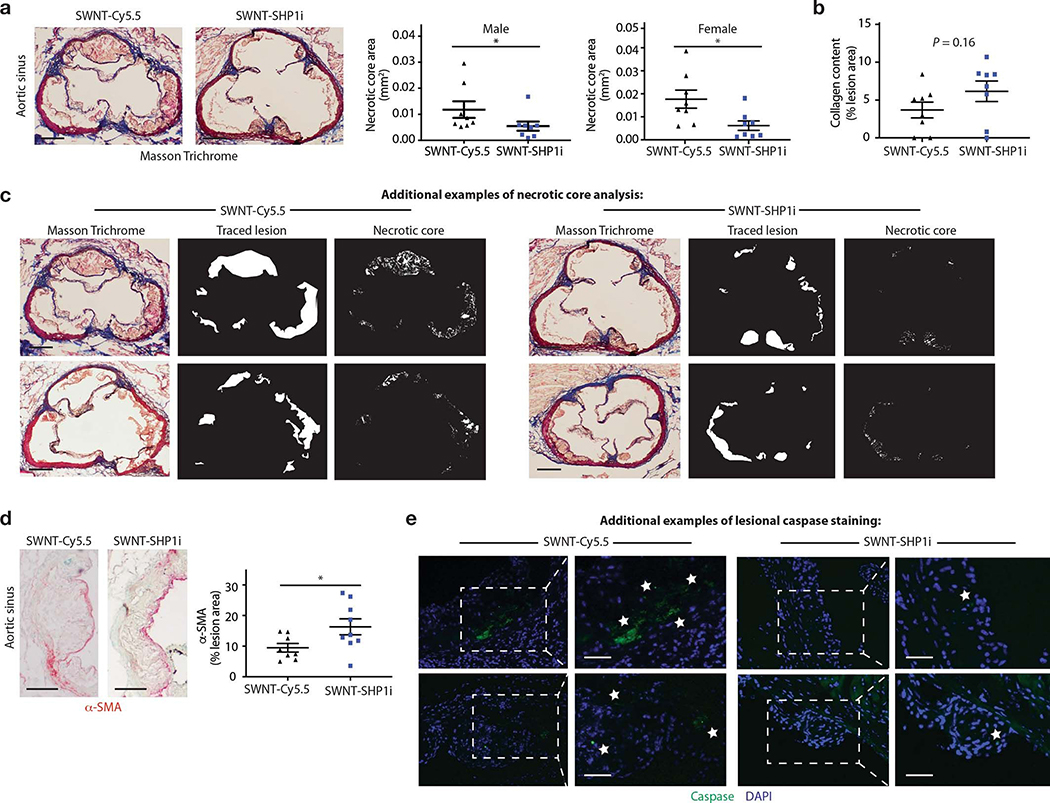
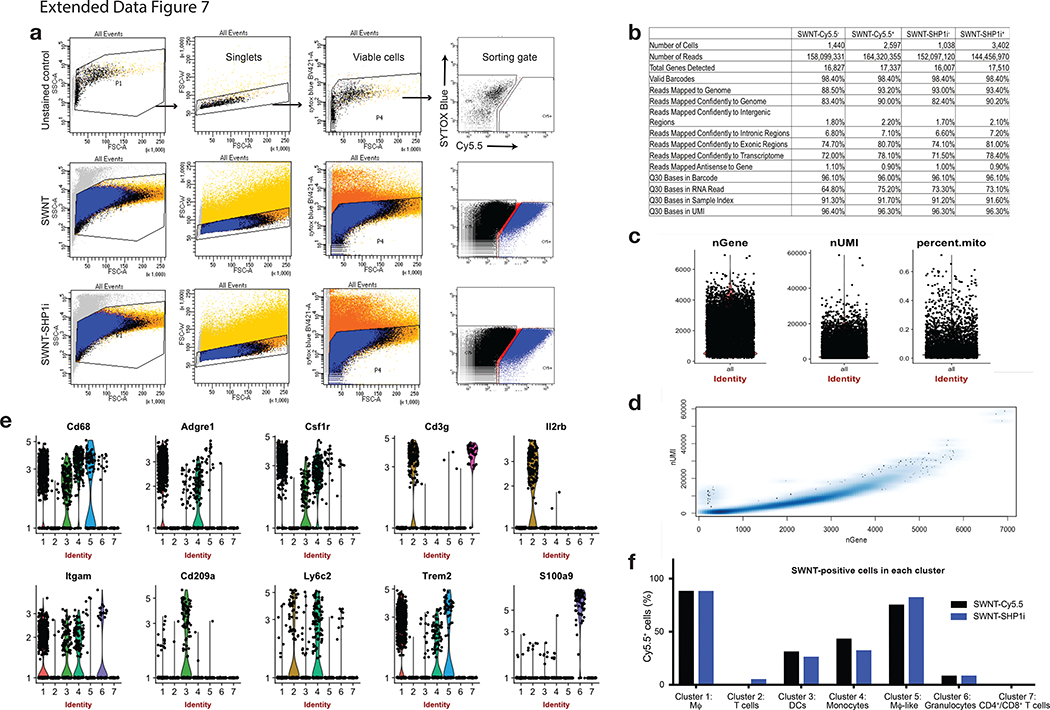
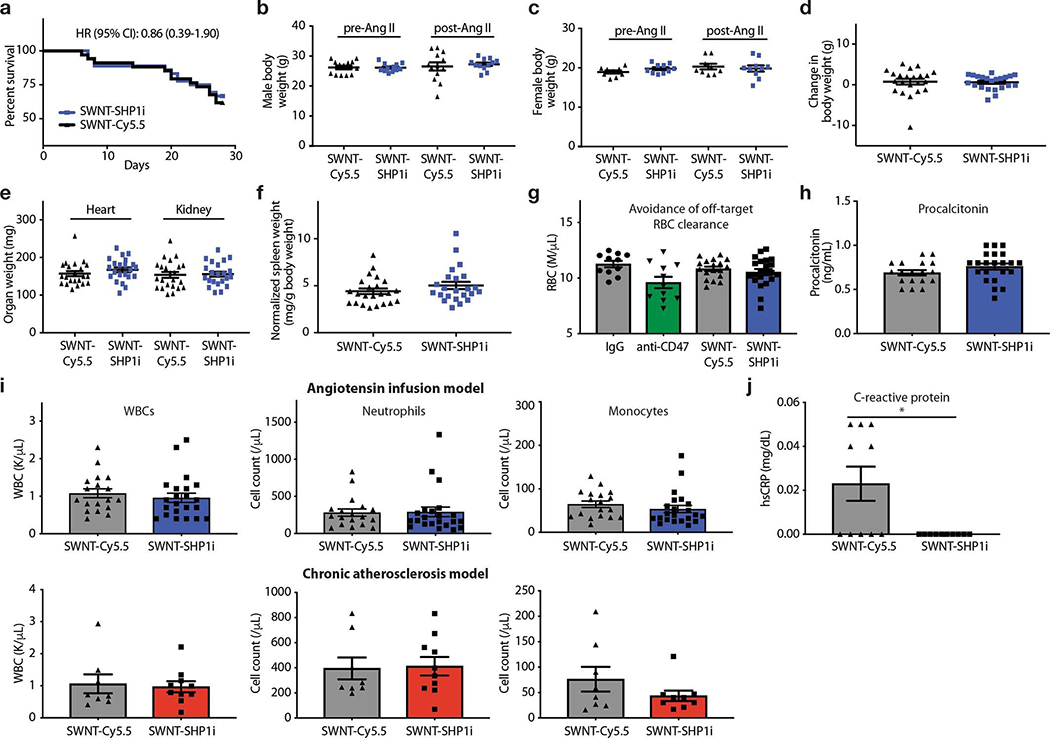
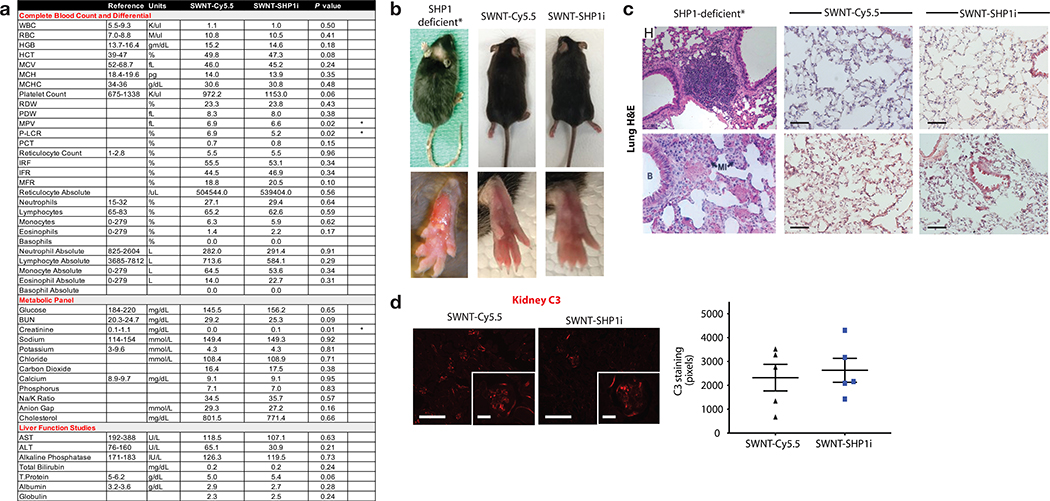
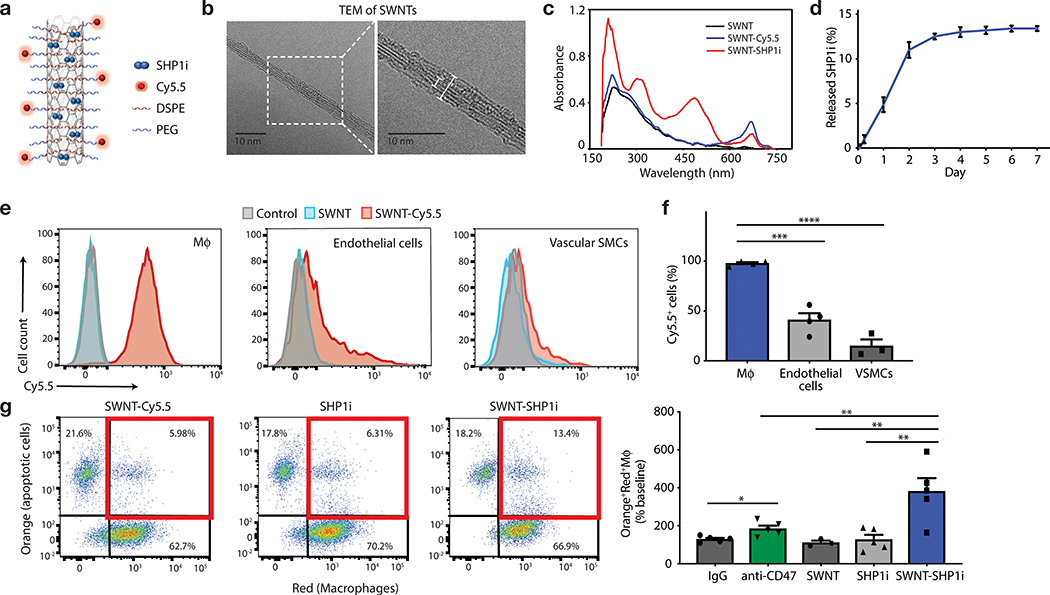
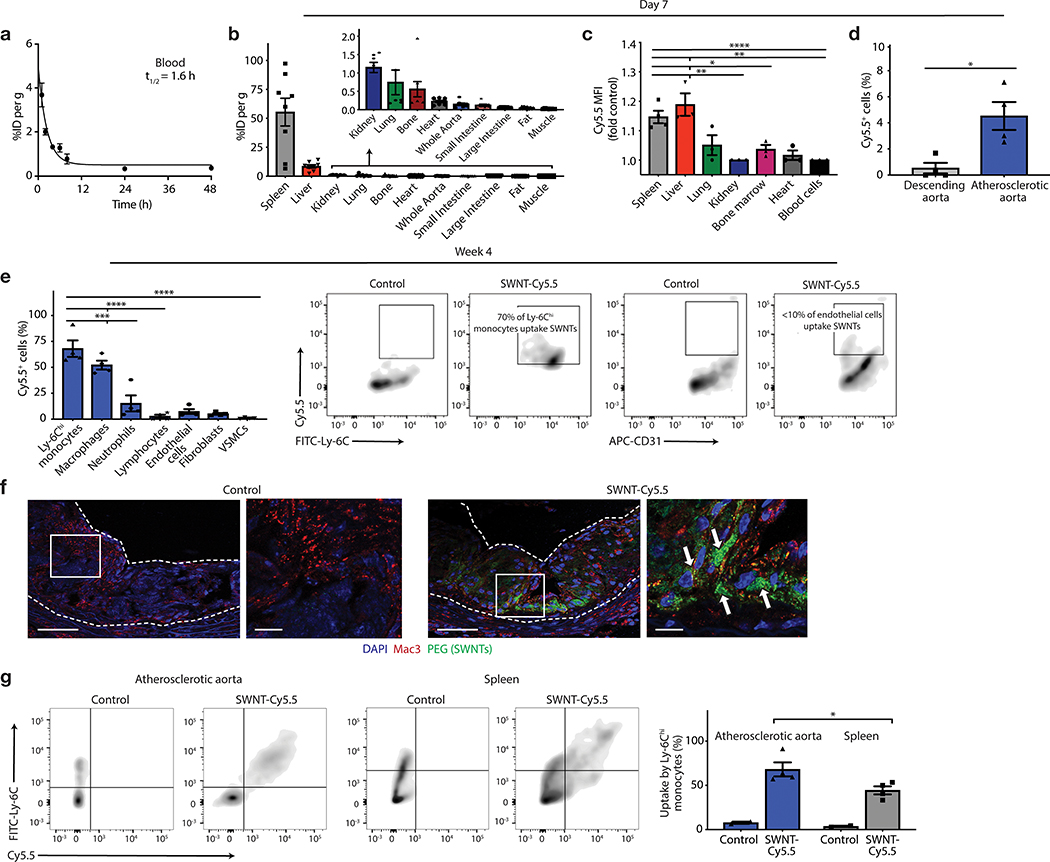
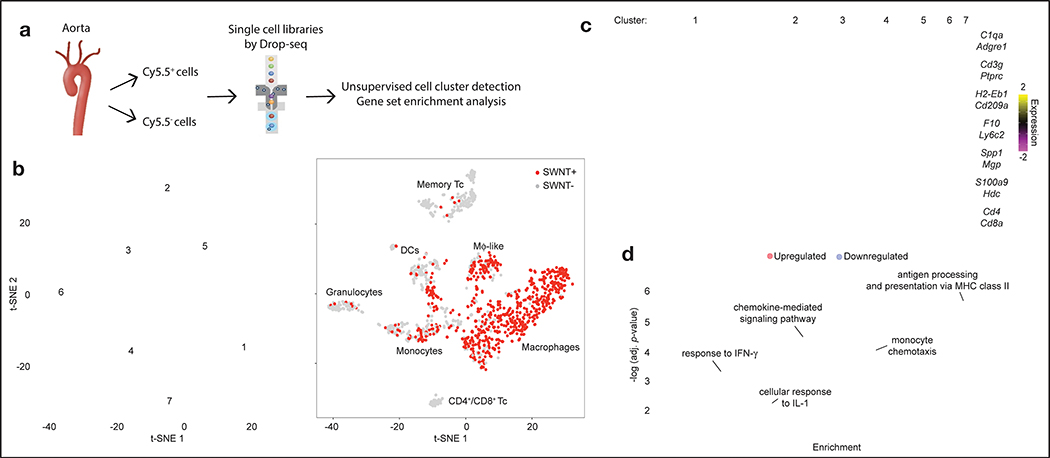
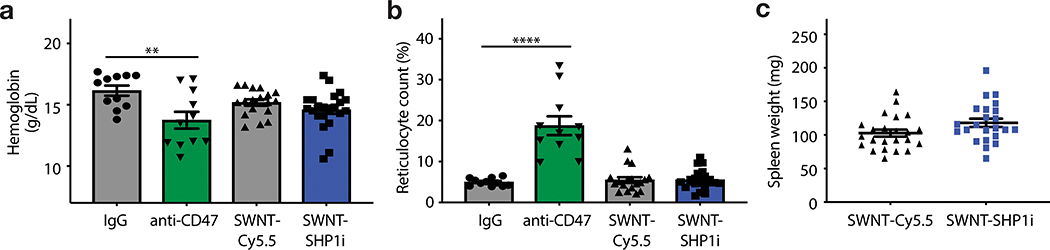
Atherosclerosis is the process that underlies heart attack and stroke. A characteristic feature of the atherosclerotic plaque is the accumulation of apoptotic cells in the necrotic core. Prophagocytic antibody-based therapies are currently being explored to stimulate the phagocytic clearance of apoptotic cells; however, these therapies can cause off-target clearance of healthy tissues, which leads to toxicities such as anaemia. Here we developed a macrophage-specific nanotherapy based on single-walled carbon nanotubes loaded with a chemical inhibitor of the antiphagocytic CD47-SIRPα signalling axis. We demonstrate that these single-walled carbon nanotubes accumulate within the atherosclerotic plaque, reactivate lesional phagocytosis and reduce the plaque burden in atheroprone apolipoprotein-E-deficient mice without compromising safety, and thereby overcome a key translational barrier for this class of drugs. Single-cell RNA sequencing analysis reveals that prophagocytic single-walled carbon nanotubes decrease the expression of inflammatory genes linked to cytokine and chemokine pathways in lesional macrophages, which demonstrates the potential of 'Trojan horse' nanoparticles to prevent atherosclerotic cardiovascular disease.


Conflict of interest statement

Competing financial interests

Drs. Leeper and Weissman are co-founders and hold equity interest in 47 Incorporated.

Figures

Extended Data Fig. 1
a, Schematic illustrating steps of SWNT-SHP1i preparation. Following SWNT-PEG-Cy5.5 (SWNT-Cy5.5) fabrication, SHP1i is loaded onto SWNT-Cy5.5 by adding SHP1i to a stirred solution of SWNT-Cy5.5 overnight at 4°C and removing free SHP1i molecules by dialyzing with PBS for 24h at 4°C. DSPE-PEG: 1,2-distearoyl-sn-glycero-3-phosphoethanolamine-N-[amino(polyethylene glycol)]. b, Chemical structure of the small-molecule inhibitor of SHP-1. c, Release rates of SHP1i from SWNT-Cy5.5 in PBS (pH=7.4). d, Of the various PEG lengths tested, PEG5000 provided the highest yield (3.5x higher than PEG2000). SWNTs were thus functionalized with PEG5000 for in vitro and in vivo studies. e-f, Photos depicting color change in the SWNT-Cy5.5 filtrate demonstrating removal of excess Cy5.5 (blue color) after each washing step (e), and after loading SWNT-Cy5.5 with SHP1i (red-tinted solution on right) (f). g, Attenuated total reflectance (ATR) infrared spectra for SWNT-SHP1i, SWNT-Cy5.5, and SHP1i. The major spectral features of SHP1i are located in the fingerprint region, containing a complex set of absorptions. The S-O stretch from SO3 in the SHP1i molecule observed at 1034 cm−1 in SHP1i spectra is recapitulated in the SWNT-SHP1i spectrum as an additional spike at 1034cm−1 in comparison with the SWNT spectrum (highlighted in square). These data confirm loading of SHP1i on SWNTs together with UV-vis spectra and the color change of the solution. Data in c-g were repeated 3 times with similar results. h, Quantification of endotoxin levels reveals that SWNT-PEG, SWNT-Cy5.5, and SWNT-SHP1i each have endotoxin levels <0.01 ng/mL (approximately 0.1 endotoxin units per mL; standard curve provided). The assay was performed once with 3 biological replicates. Mean and standard error of the mean (s.e.m.) are shown.
Extended Data Fig. 2
a-c, In vitro uptake studies show that SWNTs are preferentially taken up by human and mouse macrophages after 3hr incubation. Uptake studies are shown in human macrophages (PMA-differentiated THP-1 cells), human aortic endothelial cells (HAECs), and human coronary artery smooth muscle cells (HCASMCs) (a-b, n = 3), as well as murine macrophages (RAW264.7), endothelial cells (C166), and primary aortic vascular smooth muscle cells (VSMCs) (c, n = minimum 3 per cell type). ***p < 0.001, ****p < 0.0001 by one-way ANOVA with a Tukey post-hoc test. d, SWNTs are taken up by ~100% of basal (M0) and IL-4-polarized (M2) RAW264.7 macrophages, and ~85% of macrophages skewed towards the M1 state with LPS and IFN-γ (n = 3). ****p < 0.0001 by one-way ANOVA with a Tukey post-hoc test. e, The phagocytosis efficiency of macrophages (CellTracker Red+) against apoptotic vascular cells (CellTracker Orange+) is enhanced by SWNT-SHP1i nanoparticles, relative to SWNTs, SWNT-Cy5.5 and SHP1i controls (n = 5). *p < 0.05 by unpaired two-tailed t-test. **p < 0.01, ***p < 0.001 by one-way ANOVA with a Tukey post-hoc test. f, Representative flow cytometry plots and staining controls for the conditions of the in vitro phagocytosis assays. Double-positive cells in the right upper quadrant represent macrophages that have ingested a target apoptotic cell. g, SWNT-SHP1i treatment does not alter the rates of programmed cell death of RAW264.7 macrophages in vitro, as shown by the lack of a difference in TUNEL (terminal deoxynucleotidyl transferase [TdT] dUTP nick-end labeling) staining (n = 2). h, MTT assays show that SWNT-SHP1i has no effect on the proliferation rates of RAW264.7 macrophages in the presence of 10% serum (n = 3). i, Cell viability assays indicate that SWNTs do not affect the viability of RAW264.7 cells, suggesting the absence of a toxic effect on macrophages (n = 3). PBS served as control. Data in f are representative of 5 independent experiments. For all graphs, data are expressed as the mean and s.e.m.
Extended Data Fig. 3
a, Assessment of serum stability of 89Zr-radiolabeled SWNTs demonstrates no signs of instability for up to 7 days at 37°C in fresh mouse serum. Data are representative of 3 independent experiments. b, Fluorescence-based studies show that the blood half-life (t1/2) of SWNT-Cy5.5 measures ~2hr, indicating that desferrioxamine chelation of 89Zr to SWNT-Cy5.5 does not significantly alter the circulation time of the nanoparticles used in the formal biodistribution studies (n = minimum 4 biologically independent animals per time point). Mean and s.e.m. are shown. c, Representation flow cytometry plots and gating strategy for analysis of SWNT uptake in homogenized organs. d, Immunofluorescence imaging shows SWNT (immunostained for PEG) accumulation in the aortic sinus, with lesser amounts in the spleen and liver, and little-to-no accumulation in other organs such as healthy aorta, lung, and kidney after 4 weeks of weekly serial injections. Data are representative of a minimum of 3 independent experiments. Scale bars, 100 μm.
Extended Data Fig. 4
a, Representative flow cytometry plots from in vivo cellular uptake studies after 4 weeks of serial injections show significant SWNT accumulation in atherosclerotic Ly-6Chi monocytes and macrophages, but low uptake by other vascular cells (n = 4 biologically independent animals). b, Additional confocal images demonstrate co-localization (indicated by arrows) of SWNTs (green) with macrophages (red) in the atherosclerotic aortic sinus. Macrophages were identified by immunostaining for both CD68 (top) and Mac-3 (bottom). Data are representative of 4 independent experiments. Scale bars, 50 μm.
Extended Data Fig. 5
a, Study timeline detailing the “angiotensin infusion” (which includes 4 weeks of high-fat diet and weekly SWNT injections) and “chronic atherosclerosis” models (which includes 2 weeks of high-fat diet, followed by 9 weeks of SWNT treatment without angiotensin II infusion). The beneficial effect of pro-efferocytic SWNT-SHP1i was confirmed in both models of vascular disease. b, In the main angiotensin infusion model, histological analysis of lesions in the aortic sinus area show that SWNT-SHP1i results in a significant reduction in plaque area in both male (n = 9 biologically independent animals for control group, n = 10 biologically independent animals for SWNT-SHP1i group) and female mice (n = 8 biologically independent animals for control group, n = 9 biologically independent animals for SWNT-SHP1i group), as measured by Oil Red O (ORO) staining. This finding is particularly important given the widely reported sex-dependent effects on atherosclerosis mouse models that is also relevant to human disease. *p < 0.05, **p < 0.01 by unpaired two-tailed t-test. c, Similar therapeutic efficacy was observed in the chronic atherosclerosis models (n = 12 biologically independent animals for control group, n = 11 biologically independent animals for SWNT-SHP1i group). *p < 0.05 by unpaired two-tailed t-test. Scale bar, 250 μm. d-f, The benefits of pro-efferocytic SWNT-SHP1i on atherosclerosis occur independently of blood pressure (n = 6 biologically independent animals per group) (d), glucose (n = 14 biologically independent animals for control group, n = 17 biologically independent animals for SWNT-SHP1i group) (d), and cholesterol levels (n = 11 biologically independent animals for control group, n = 10 biologically independent animals for SWNT-SHP1i group) (f). Blue graphs indicate results from the angiotensin infusion model, while red graphs indicated results from the chronic atherosclerosis studies. For all graphs, data are expressed as the mean and s.e.m.
Extended Data Fig. 6
Additional histological analyses confirm that SWNT-SHP1i induces a plaque-stabilizing phenotype. a, Masson Trichrome staining indicates that SWNT-SHP1i reduces the necrotic core in both male (n = 8 biologically independent animals per group) and female mice (n = 8 biologically independent animals per group). *p < 0.05 by two-sided Mann-Whitney U test in left panel, by unpaired two-tailed t-test in right panel. Scale bar, 250 μm. b, A trend towards increased collagen content was also observed after treatment (n = 8 biologically independent animals per group). c, Additional examples of lesion tracing and necrotic core analyses indicating reduced accumulation of apoptotic and necrotic debris after treatment. Data are representative of 16 independent experiments. Scale bar, 250 μm. d, α-SMA staining indicates enhanced smooth muscle cell content in the cap, suggesting a reduction in plaque vulnerability after therapy (n = 8 biologically independent animals for control group, n = 9 biologically independent animals for SWNT-SHP1i group). *p < 0.05 by unpaired two-tailed t-test. Scale bar, 250μm. e, Additional examples of lesional caspase staining (indicated with stars) highlighting a reduction in apoptotic cell content in treated animals. Data are representative of 9 independent experiments. Scale bar, 50 μm. For all graphs, data are expressed as the mean and s.e.m.
Extended Data Fig. 7
a, Flow cytometry gating strategy for selection of viable (SYTOX Blue) cells that had taken up SWNTs (Cy5.5+). b, Sequencing data quality metrics for cells isolated from aortae of mice following treatment with SWNT-Cy5.5 or SWNT-SHP1i. c, Violin plots showing number of genes (nGene), unique molecular identifier (nUMI), and percentage of mitochondrial gene reads (percent.mito) for cells in the full dataset (n = 8 biologically independent animals). Each point represents the given value from a single cell. d, Scatterplot of nGene and nUMI across the combined dataset used to identify and exclude outliers (e.g. cell doublets). e, Representative violin plots showing the distribution of gene expression of immune cell markers in the 7 identified leukocyte clusters (n = 8 biologically independent animals). The identity of clusters was defined according to canonical hematopoietic-lineage and immune cell markers: macrophages (Adgre1 encoding F4/80, Cd68, Csf1r), memory T cells (Cd3g, Il2r, Ptprc and Il7r encoding memory markers CD45RO and CD127), dendritic cells (Cd209a, Flt3, Itgax encoding CD11c), monocytes (Ccr2, Ly6c2, Itgam encoding CD11b), granulocytes (Csf3r, S100a9), and CD4+/CD8+ T cell subsets (Cd3e, Cd4, Cd8a). Each point represents log-normalized single cell expression levels. f, Analysis of SWNT-positive (Cy5.5+) cells in each cluster confirms that SWNTs specifically target macrophages in the atherosclerotic aorta. Detection of SWNT uptake was greater in macrophages when characterizing cells by their whole-transcriptome, rather than the traditional limited markers used in flow cytometry above (Fig. 2e, Supplementary Fig. 4). ~90% of lesional macrophages took up SWNTs in both SWNT-Cy5.5 and SWNT-SHP1i treated animals as compared to <30% of dendritic cells and <10% of T cells and granulocytes with SWNT detection. Similarly high SWNT uptake (>75%) was detected in “macrophage-like” cells.
Extended Data Fig. 8
a, Survival analysis indicate no change in mortality with SWNT-SHP1i treatment (n = 34 biologically independent animals for control group, n = 36 biologically independent animals for SWNT-SHP1i group). b-d, The in vivo safety of pro-efferocytic SWNTs is further supported by the stable body weight in apoE−/− mice treated with SWNT-SHP1i compared to SWNT-Cy5.5 controls (n = 22 biologically independent animals per group). e,f. Similarly, there were no differences in the weight of any organ between groups (n = 22 biologically independent animals per group). g-j, SWNT-SHP1i does not induce any major hematopoietic toxicities, such as the reduction in the red blood cell (RBC) count that is observed in anti-CD47 antibody treated mice (g). Procalcitonin levels are also unchanged between treatment groups, indicating a low likelihood for increased bacterial infections in SWNT-SHP1i-treated mice (h). There is also no effect of SWNT-SHP1i on total leukocytes, neutrophils, or monocytes (n = 18 biologically independent animals for control group, n = 22 biologically independent animals for SWNT-SHP1i group) (i). Lastly, without inducing immunosuppression, SWNT-SHP1i reduced hs-CRP levels, suggesting reduced inflammation after treatment (n = 10 biologically independent animals per group). *p = 0.03 by two-sided Mann-Whitney U test (j). Blue graphs indicate results from the angiotensin infusion model, while red graphs indicate results from the chronic atherosclerosis studies. Data from anti-CD47 and IgG-treated mice in (g) are previously reported (n = 11 biologically independent animals per group). For all graphs, data are expressed as the mean and s.e.m.
Extended Data Fig. 9
a, Hematology assessment demonstrate that SWNT-SHP1i treatment results in a significant decrease in the mean platelet volume (MPV) and platelet-large cell ratio (P-LCR), but has no effect on major parameters of the complete blood count or metabolic panel that would indicate organ or hematopoietic toxicity (n = minimum 9 biologically independent animals per group). *p < 0.05 by unpaired two-tailed t-test. b-d, In contrast to prior publications indicating that global knockout of SHP-1 can have a variety of harmful effects including dermatitis, pneumonitis, and renal complement deposition (images adapted from ), we observed none of these toxicities in mice treated with macrophage-specific SWNT-SHP1i. This favorable safety profile was evidenced by a lack of hair loss or suppurative skin lesions (b), an absence of pulmonary inflammation and alveolar hemorrhage (c), and the absence of elevated renal C3 immunofluorescence staining (n = 5 per group, 4 sections analyzed per animal) (d). Scale bar in c, 100μm. Scale bars in d, 200 μm and 50 μm (insets). SHP1-deficient image in 9c reprinted with permission from ; Copyright (2008) National Academy of Sciences, U.S.A. For all graphs, data are expressed as the mean and s.e.m.
Figure 1:
Figure 1:. SWNT-SHP1i promotes the phagocytosis of apoptotic cells by macrophages.
a, Schematic of SWNT-SHP1i, comprised of a backbone of single-walled carbon nanotubes (SWNTs) which are functionalized with phospholipid-PEG (DSPE-PEG; 1,2-distearoyl-sn-glycero-3-phosphoethanolamine-N-[amino(polyethylene glycol)]) to form biocompatible nanotubes, Cy5.5 fluorophore for tracking in vivo delivery, and small-molecule inhibitors of SHP-1 (SHP1i) via π-π stacking and hydrophobic interactions with the nanotube surface. b, Negative staining transmission electron micrographs (TEM) show the cylindrical morphology of SWNTs with their surrounding PEG phospholipid layer. Bare SWNTs apparently have a diameter of ~2–3 nm (inner white line). The adsorbed PEG chains result in an increased SWNT diameter to ~5–6 nm (outer white line). c, UV-vis spectrum of SWNTs (black), SWNT-Cy5.5 (blue), and SWNT-SHP1i (red). d, Release curve of SHP1i from SWNT-Cy5.5 in serum, demonstrating controlled release over 7 days (n = 3 biologically independent experiments). e,f, Cellular uptake assays demonstrate the propensity of SWNTs to specifically accumulate in murine macrophages (RAW264.7) compared to endothelial cells and VSMCs (n = minimum 3 biologically independent experiments). Flow cytometry histograms of cells from uptake studies with SWNT-Cy5.5, plain SWNTs (not adorned with Cy5.5), and PBS controls. Mϕ, macrophages (e). ***p = 0.0001, ****p < 0.0001 by one-way ANOVA with a Tukey post-hoc test. g, In vitro phagocytosis assays confirm that SWNT-SHP1i augments the clearance of apoptotic vascular cells by macrophages at least as potently as gold standard anti-CD47 antibodies, compared with SHP1i and SWNT controls (n = 5 biologically independent experiments). *p < 0.05 by unpaired two-tailed t-test. **p < 0.01 by one-way ANOVA with a Tukey post-hoc test. For all graphs, data are expressed as the mean and standard error of the mean (s.e.m.).
Figure 2:
Figure 2:. SWNTs accumulate within phagocytes in the atherosclerotic plaque.
a, Blood decay curve of 89Zr-radiolabelled-SWNTs. The mean t1/2 was calculated as 1.64hr (R2 = 0.96; n = minimum 4 biologically independent animals per time point). b, Quantitative biodistribution studies 7 days after intravenous administration of 89Zr-SWNTs reveal that SWNTs primarily accumulate in organs with high macrophage content, such as the spleen and liver (n = 8 biologically independent animals). c,d, Flow cytometry analyses of homogenized organs confirm the trend for enhanced uptake by organs of the reticuloendothelial system (c), and reveals that SWNT accumulation is largely restricted to the macrophage-rich plaque, as compared to the less disease-prone descending aorta (n = minimum 3 biologically independent animals) (d). *p < 0.05 by unpaired two-tailed t-test in (c). *p < 0.05, **p < 0.01, ****p < 0.0001 by one-way ANOVA with a Tukey post-hoc test in (d). e-g, Following 4 weeks of weekly SWNT administration, SWNTs specifically accumulate within Ly-6Chi monocytes and macrophages in the atherosclerotic aorta, while SWNT detection is low in other vascular cells (n = 4 biologically independent animals) (e). ***p < 0.001, ****p < 0.0001 one-way ANOVA with a Tukey post-hoc test. Lesional macrophage (red) and SWNT (green) co-localization is confirmed by confocal images of the aortic sinus (co-localized regions indicated by arrows). Scale bar, 50 μm (right panel, 25 μm). (f). Enhanced uptake is observed by Ly-6Chi monocytes in the aorta compared to the spleen, suggesting that SWNTs may be efficiently delivered to the diseased artery by inflammatory monocytes (n = 4 biologically independent animals) (g). *p < 0.05 by unpaired two-tailed t-test. Data in f are representative of 4 independent experiments. For all graphs, data are expressed as the mean and s.e.m.
Figure 3:
Figure 3:. Pro-efferocytic SWNTs prevent atherosclerosis.
a, Mice treated with SWNT-SHP1i (n = 19) develop significantly reduced plaque content in the aortic sinus, relative to SWNT-Cy5.5 controls (n = 17). These findings were confirmed in a second atherosclerosis model (see Extended Data Fig. 5). **p < 0.01 by two-sided Mann-Whitney U test. Scale bar, 250 μm. b, Compared to control (n = 8), SWNT-SHP1i (n = 9) decreases phosphorylation of SHP-1, indicating silencing of the anti-phagocytic CD47-SIRPα signal. *p < 0.05 by unpaired two-tailed t-test. Scale bar, 100 μm. c-e, Lesions from mice treated with pro-efferocytic SWNTs are more likely to have apoptotic cells (indicated by arrows) that have been ingested by lesional macrophages (n = 9 biologically independent animals per group; scale bar, 25 μm) (c), develop smaller necrotic cores (indicated by dotted lines, n = 16 biologically independent animals per group; scale bar, 50 μm) (d), and accumulate less apoptotic debris (as assessed by percentage of cleaved caspase-3+ area in the plaque, indicated by stars, n = 9 biologically independent animals per group; scale bar, 50 μm) (e). **p < 0.01 by unpaired two-tailed t-test in c and by two-sided Mann-Whitney U test in d and e. f, 18F-FDG PET/CT imaging demonstrates that SWNT-SHP1i significantly reduces vascular inflammation (see Supplementary Video 1). SUVmean, mean standardized uptake value. For all graphs, data are expressed as the mean and s.e.m.
Figure 4:
Figure 4:. Single-cell transcriptomics reveal genes and key molecular pathways modulated by chronic CD47-SIRPα blockade in lesional macrophages.
a, Workflow for scRNA-seq including aortic cell isolation, drop-sequencing, and downstream analyses. b, Unsupervised dimensionality reduction identifies 7 major cell types with similar gene expression from the combined SWNT-Cy5.5 control and SWNT-SHP1i datasets (n = 4 biologically independent animals per group). Data is visualized using t-distributed stochastic neighbor embedding (t-SNE) plots, showing the 7 distinct cell clusters (left), and SWNT detection in each cell (right). SWNT-positive cells are the most prevalent in lesional macrophages (Cluster 1) and macrophage-like cells (Cluster 5, Extended Data Fig. 7). Memory Tc, memory T cells; DCs, dendritic cells; Mϕ-like, macrophage-like; CD4+/CD8+ Tc, CD4+/CD8+ T cells. c, Heatmap showing gene expression of 10 cluster-defining genes and leukocyte markers (see Supplementary Table 1 for full list of cluster markers). d, Single-cell differential gene expression analysis identify the genes regulated by SWNT-SHP1i specifically in lesional macrophages (n = 4 biologically independent animals per group). Gene Ontology (GO) enrichment and pathway analyses reveal that CD47-SIRPα blockade results in an increase in expression of genes related to antigen processing and presentation, and the downregulation of genes associated with monocyte chemotaxis, chemokine signaling, and the cellular response to the pro-inflammatory cytokines, interleukin-1 (IL-1) and interferon-γ (IFN-γ). The subclasses of the top GO biological processes (fold enrichment > 10, adjusted p-value < 10−2) are shown. Size of circles are proportional to the enrichment of each biological process. Functional enrichment was assessed using two-sided Fisher’s exact test with p-value adjustment by Bonferroni correction.
Figure 5:
Figure 5:. Pro-efferocytic SWNTs do not induce clearance of healthy tissue.
a,b, Mice treated with SWNT-SHP1i (n = 22 biologically independent animals) do not develop anemia (a) or a compensatory reticulocytosis (b), which occurs in response to anti-CD47-antibody treatment due to the off-target elimination of opsonized red blood cells. **p < 0.01, ****p < 0.0001 by unpaired two-tailed t-test. c, No significant difference is observed for the weight of the spleen between groups, suggestive of the lack of red blood cell clearance due to Fc-dependent erythrophagocytosis (n = 23 biologically independent animals per group, p = 0.065). IgG and anti-CD47 antibody data in a and b are previously reported (n = 11 biologically independent animals per group). For all graphs, data are expressed as the mean and s.e.m.

Comment in

  • Devouring atherosclerotic plaques.
    Fredman G. Fredman G. Nat Nanotechnol. 2020 Feb;15(2):84-85. doi: 10.1038/s41565-019-0599-3. Nat Nanotechnol. 2020. PMID: 31988505 No abstract available.

References

    1. Arandjelovic S & Ravichandran KS Phagocytosis of apoptotic cells in homeostasis. Nat Immunol 16, 907–917, doi:10.1038/ni.3253 (2015). - DOI - PMC - PubMed
    1. Huynh ML, Fadok VA & Henson PM Phosphatidylserine-dependent ingestion of apoptotic cells promotes TGF-beta1 secretion and the resolution of inflammation. J Clin Invest 109, 41–50, doi:10.1172/JCI11638 (2002). - DOI - PMC - PubMed
    1. Yurdagul A Jr., Doran AC, Cai B, Fredman G & Tabas IA Mechanisms and Consequences of Defective Efferocytosis in Atherosclerosis. Front Cardiovasc Med 4, 86, doi:10.3389/fcvm.2017.00086 (2017). - DOI - PMC - PubMed
    1. Jaiswal S et al. CD47 is upregulated on circulating hematopoietic stem cells and leukemia cells to avoid phagocytosis. Cell 138, 271–285, doi:10.1016/j.cell.2009.05.046S0092-8674(09)00651-5 [pii] (2009). - DOI - PMC - PubMed
    1. Willingham SB et al. The CD47-signal regulatory protein alpha (SIRPa) interaction is a therapeutic target for human solid tumors. Proc Natl Acad Sci U S A 109, 6662–6667, doi:10.1073/pnas.11216231091121623109 [pii] (2012). - DOI - PMC - PubMed

Publication types

MeSH terms