. 2020 Jan 18:11:1.
doi: 10.1186/s13227-020-0147-0. eCollection 2020.

Elongation during segmentation shows axial variability, low mitotic rates, and synchronized cell cycle domains in the crustacean, Thamnocephalus platyurus

Affiliations

Elongation during segmentation shows axial variability, low mitotic rates, and synchronized cell cycle domains in the crustacean, Thamnocephalus platyurus

Savvas J Constantinou et al. Evodevo. .

Abstract

Background: Segmentation in arthropods typically occurs by sequential addition of segments from a posterior growth zone. However, the amount of tissue required for growth and the cell behaviors producing posterior elongation are sparsely documented.

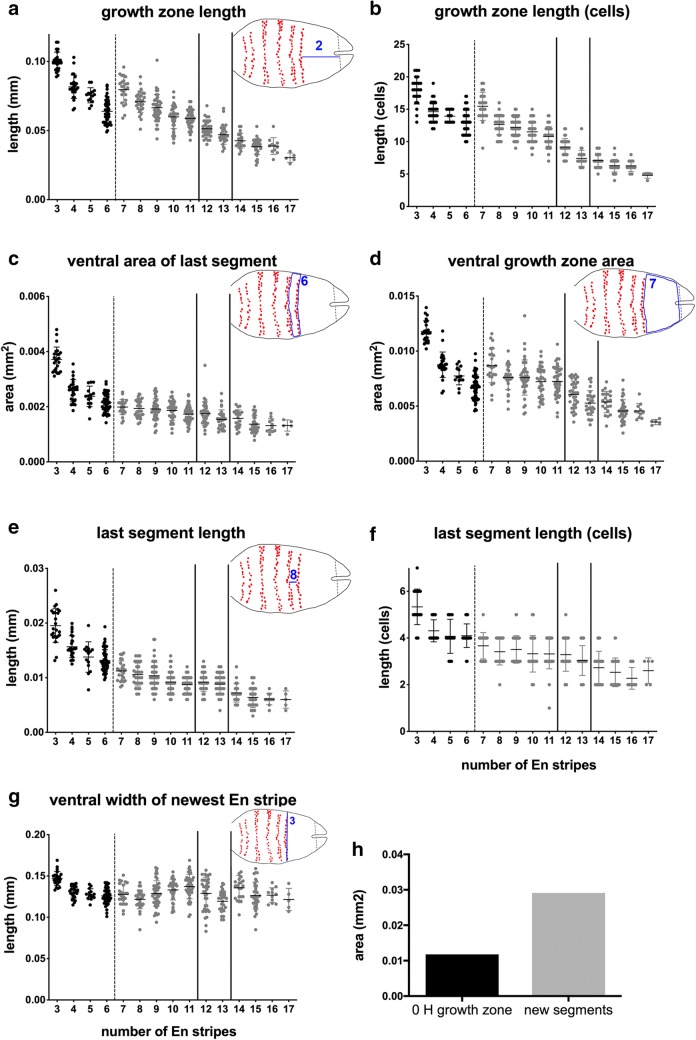
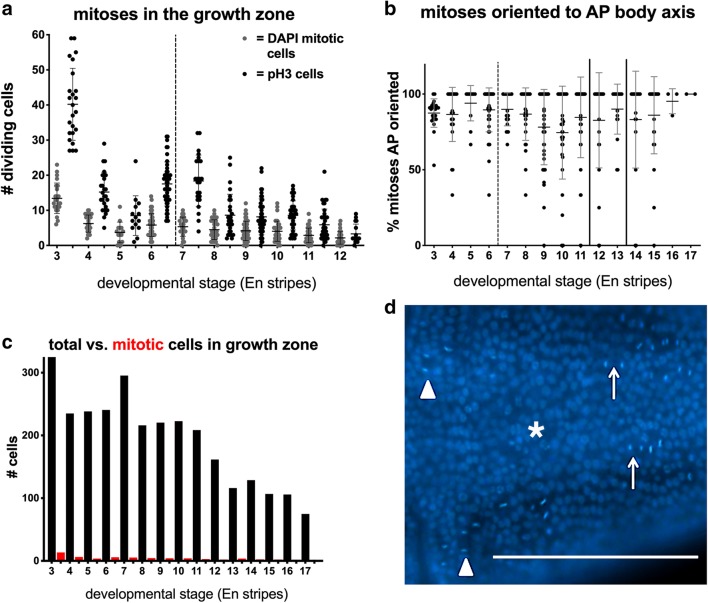
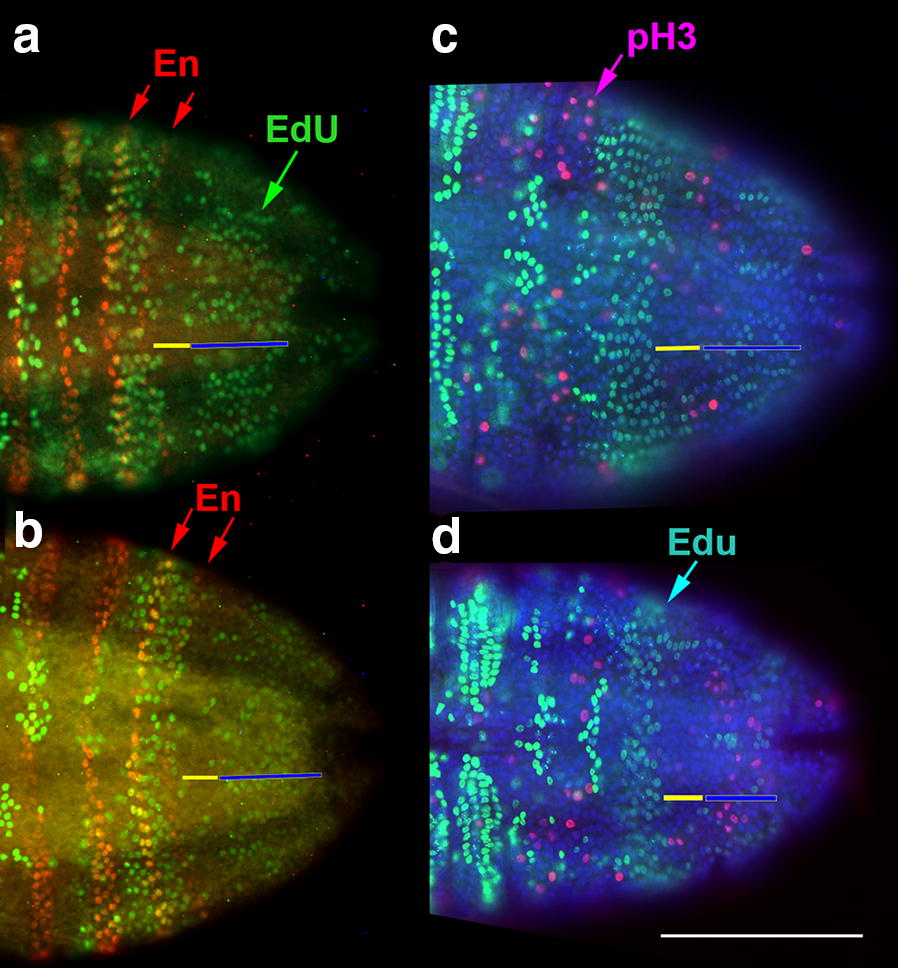
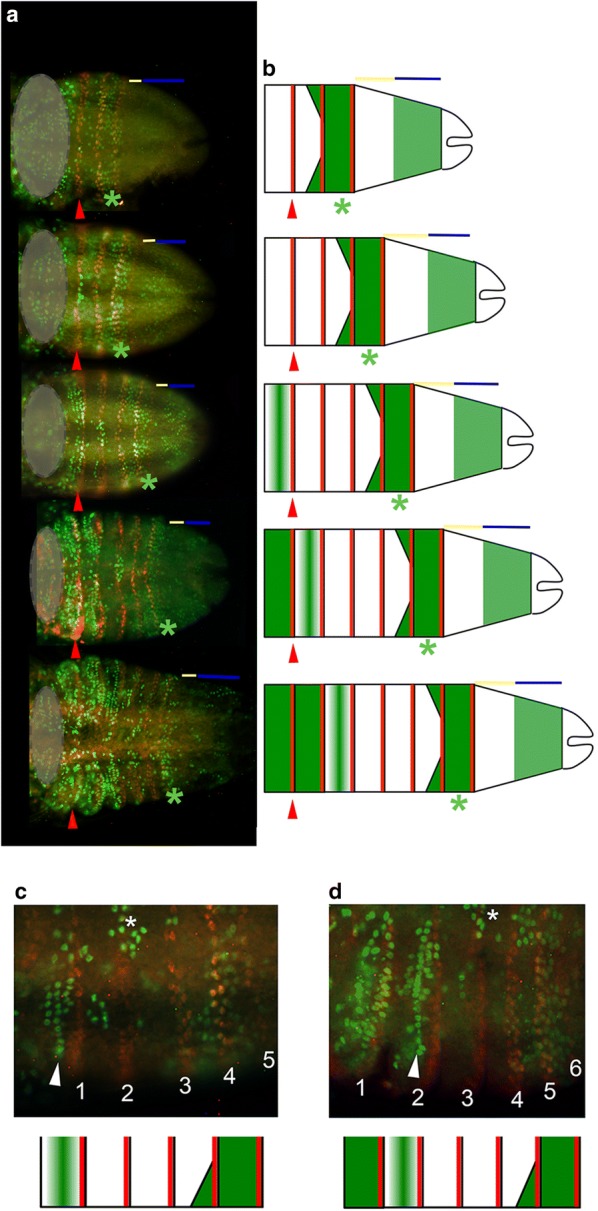
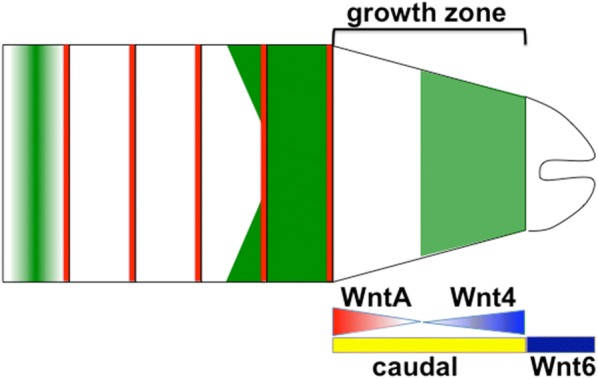
Results: Using precisely staged larvae of the crustacean, Thamnocephalus platyurus, we systematically examine cell division patterns and morphometric changes associated with posterior elongation during segmentation. We show that cell division occurs during normal elongation but that cells in the growth zone need only divide ~ 1.5 times to meet growth estimates; correspondingly, direct measures of cell division in the growth zone are low. Morphometric measurements of the growth zone and of newly formed segments suggest tagma-specific features of segment generation. Using methods for detecting two different phases in the cell cycle, we show distinct domains of synchronized cells in the posterior trunk. Borders of cell cycle domains correlate with domains of segmental gene expression, suggesting an intimate link between segment generation and cell cycle regulation.

Conclusions: Emerging measures of cellular dynamics underlying posterior elongation already show a number of intriguing characteristics that may be widespread among sequentially segmenting arthropods and are likely a source of evolutionary variability. These characteristics include: the low rates of posterior mitosis, the apparently tight regulation of cell cycle at the growth zone/new segment border, and a correlation between changes in elongation and tagma boundaries.

Keywords: Arthropod; EdU; Growth zone; Mitosis; Segmentation; Wnt.


Conflict of interest statement

Competing interestsThe authors declare that they have no competing interests.

Figures

Fig. 1
Fig. 1
Thamnocephalus development and morphometric measures. ac En protein staining in larvae with a three thoracic En stripes, b six thoracic En stripes, and c eight thoracic En stripes. Asterisks mark the first thoracic segment in each larva (the two stripes visible anterior to this are the first and second maxillary segments) and in c show the outpocketing of the segmental limb bud from the body wall. In b, c white arrow point to scanning electron micrographs of similarly staged larvae. d Thamnocephalus larva illustrating measurements used in this study (defined in “Materials and methods”): 1—body length, 2—growth zone length, 3—growth zone width “A” (width of newly added En stripe), 4—growth zone width “B”, 5—ventral trunk area, 6—ventral area of last segment, 7—ventral growth zone area, 8—last segment length. Note, the area measures are in color; length measures are given in white and denoted with an arrowhead. Scale bar = 100 μm. En expression (red). All larvae are shown with anterior to the left, ventral side up
Fig. 2
Fig. 2
Elongation of the body at successive developmental stages in Thamnocephalus. a Body length plotted against developmental stage. The animals roughly double in length as the body segments are specified. b Percent change in body length plotted against developmental stage, demonstrating the impact of the first molt on change in body length. c Overall ventral area of the trunk increases at each stage (after four En stripes added). Black bars represent the thoracic segments added prior to the first molt (dashed line), subsequent thoracic segments are gray. Genital segments (modified abdominal segments 1 and 2) are marked by solid lines and followed by additional abdominal segments. Box and whisker representation of these data in Additional file 3. On average, 23 larvae per stage were scored for a total of 433 larvae, exact distribution of larvae in each hour and developmental stage included in Additional file 15
Fig. 3
Fig. 3
Change in growth zone dimensions in growing Thamnocephalus larvae. a Growth zone length decreases except after the first molt. This trend is the same when measured by counting cells (b). c The ventral area of the last added segment decreases in Thamnocephalus. d The ventral area of the growth zone decreases, except after the first molt. e The newest segments are longest during early stages. f When measured by counting cells, the length of the newest segment added mimics the linear dimension in e. g Unlike other dimensions, the width of the newly specified Engrailed stripe remains relatively constant during development (growth zone width “A” measure). h A comparison of the average size of the initial growth zone upon hatching (black column) versus the area required to make all additional segments (gray column), where the latter is calculated based on the sum of each newly added segment over the measured course of development. Trunk icon diagram measures represented in each panel and illustrate how ventral area was measured for these comparisons. Bar colors and lines, as in Fig. 2
Fig. 4
Fig. 4
PCA biplot with tagma grouping. 423 individuals are plotted along PC1 and PC2 and grouped by tagma (in which the measures were made). PC1 explains 64% of the total variance in the data and separates individuals by tagma; a linear regression of PC1 on tagma indicates that “tagmata” are a good predictor of PC1 (adj R2 = 0.78; p < 0.001). Each tagma group is significantly different from one another (Type II MANOVA; F9,1272 = 103.06, p < 0.001). In addition, thoracic pre- and post-molt segments form clusters that are significantly different from all other tagma
Fig. 5
Fig. 5
Mitosis in the growth zone of Thamnocephalus. a Scoring pH3-positive cells (black columns) in the growth zone captures consistently higher numbers of cells in M-phase compared to cells measured with nuclear staining (gray columns, Hoechst). Mitosis rates are highest just after hatching and increase prior to the first molt (dotted line). b Regardless of developmental stage, ~ 80% of the actively dividing cells (Hoechst) in the growth zone are oriented along the AP body axis. c Total calculated number of cells in the growth zone (black columns) compared to average number in mitosis (red) at successive developmental stages. (For comparison, the first red column is pH3 positive cells the second Hoechst. pH3 data were not collected after 12 h and the averages for the Hoechst scored mitotic figures drop to 1 and 2.) d Representative photo of AP-oriented cells in the GZ (arrows) in an early larva, although not stained with Engrailed, the approximate position of the last En stripe is indicated (asterisk). Note the medial–lateral oriented cells in the developing segments (arrowhead). Scale bar equals 100 µm
Fig. 6
Fig. 6
Cells synchronized in S phase in newest segment while the anterior growth zone has few cells in S phase. a, b After 30 min of exposure to EdU, a band of cells in S phase is visible (green) in the last added segment (red arrows indicate last two En stripes) in Thamnocephalus. This pattern is maintained throughout the early stages as seen in representative 1 h (a) and 2 h (b) larvae. The band lies almost entirely within the last segment after En segment specification. c, d In both 1 h (c) and 2 h (d) larvae, cells in the last added segment (EdU band, light green) do not show pH3 staining (pink) indicative of M-phase. Anterior growth zone is indicated by yellow bars; posterior growth, blue bars. Scale bars equal 100 μm
Fig. 7
Fig. 7
EdU incorporation in anterior segments shows stereotyped progression in early Thamnocephalus larvae. a Representative larvae with three to seven segments, oriented anterior left; the trunk is posterior (right) to the gray circle (which covers the head segments for clarity). b Diagrammatic representation of larvae highlighting the progression of EdU incorporation in the trunk. a, b In each stage, the first thoracic segment (red arrowhead) and the EdU band (green asterisk) are indicated. The anterior growth zone (yellow bars) is devoid of EdU, while the posterior growth zone (blue bars) has variable numbers of cells incorporating EdU. In the last added segment, all cells incorporate EdU (green asterisk), forming a band of EdU that sometimes extends into the lateral edges of the penultimate segment. The two segments anterior to this are devoid of EdU. Anterior still, segments begin to progress through S-phase, beginning as a discretely aligned row of cells at the apical ridge of the segment that then expands throughout the segment. c, d Higher magnification of a series of hemi-segments to illustrate progression of EdU incorporation in the trunk. Thoracic segments are numbered and the EdU incorporating cells aligned along the apical ridge are indicated (arrowhead). The neuroectoderm cycles through S phase a few segments anterior to the EdU band (asterisk). Both a specimen (top) and corresponding diagrammatic representation (bottom) are given
Fig. 8
Fig. 8
Caudal and Wnt gene expression maps directly to boundaries of EdU domains. Posterior of larvae showing both in situ expression domains and EdU incorporation. In each case, anterior is left and the posterior edge of the EdU band (red arrowhead) is denoted. a Cad expression extends throughout the entire growth zone and borders the telson, overlapping the posterior Wnt4 and WntA expression. b Posterior WntA expression is mainly in the anterior growth zone, where there are very few to noEdU positive cells. The anterior border of cad (a) and WntA (b) both flank the posterior edge of the synchronized EdU band in the newest specified segment. c Posterior Wnt4 expression excludes the band with rare EdU staining and overlaps with the unsynchronized EdU region in the posterior growth zone. Wnt4 also appears to have a concentration gradient from posterior border towards anterior border. The anterior border of Wnt4 expression meets the posterior border of WntA expression. d Wnt6 is expressed in the telson and e in the cells that form the apical ridge of the limb buds, which also show EdU expression (white arrows)
Fig. 9
Fig. 9
Diagram of growth zone in Thamnocephalus. The Thamnocephalus growth zone is divided into anterior and posterior regions based on cell behaviors and gene expression. The posterior domain corresponds to Wnt4 expression (blue gradient); cell cycling in this region is present but low. Although mitosis in the posterior growth zone is not temporally or spatially synchronized, all mitosis in this domain is restricted in anterior–posterior orientation. The anterior growth zone corresponds to WntA expression (red gradient) and lacks cells in S phase. Cells in this region are possibly arrested either in early S phase or at the entry from G1 to S phase, since immediately after the anterior growth zone cells enter S phase again in the newest specified segment (dark green in last added segment). The synchronized S phase and subsequent mitoses in the segments generate the bulk of the visible elongation of the larvae. Wnt6 expression (dark blue bar) is in the telson, posterior to the growth zone while caudal expression (yellow bar) is throughout the growth zone. S phase domains in green, En-expressing cells in red

References

    1. Lawrence PA. The making of a fly: the genetics of animal design. Oxford: Blackwell Scientific Publications; 1992.
    1. Chipman AD. Thoughts and speculations on the ancestral arthropod segmentation pathway. In: Fusco G, editor. Evolving pathways: key themes in evolutionary developmental biology. Cambridge: Cambridge University Press; 2008. pp. 342–356.
    1. Scholtz G. Teloblasts in decapod embryos: an embryonic character reveals the monophyletic origin of freshwater crayishes (Crustacea, Decapoda) Zool Anz. 1993;230:45–54.
    1. Snodgrass RE. Evolution of the annelida, onychophora, and arthropoda. Smithson Misc Collect. 1938;97:1–159.
    1. Anderson DT. Larval development and segment formation in the branchiopod crustaceans Limnadia stanleyana King (Conchostraca) and Artemia salina (L.) (Anostraca). Aust. J Zool. 1967;15:47–91.

LinkOut - more resources