. 2020 Jan 22;6(1):41-53.
doi: 10.1021/acscentsci.9b01063. Epub 2019 Dec 27.

GTP Cyclohydrolase 1/Tetrahydrobiopterin Counteract Ferroptosis through Lipid Remodeling

Affiliations

GTP Cyclohydrolase 1/Tetrahydrobiopterin Counteract Ferroptosis through Lipid Remodeling

Vanessa A N Kraft et al. ACS Cent Sci. .

Abstract

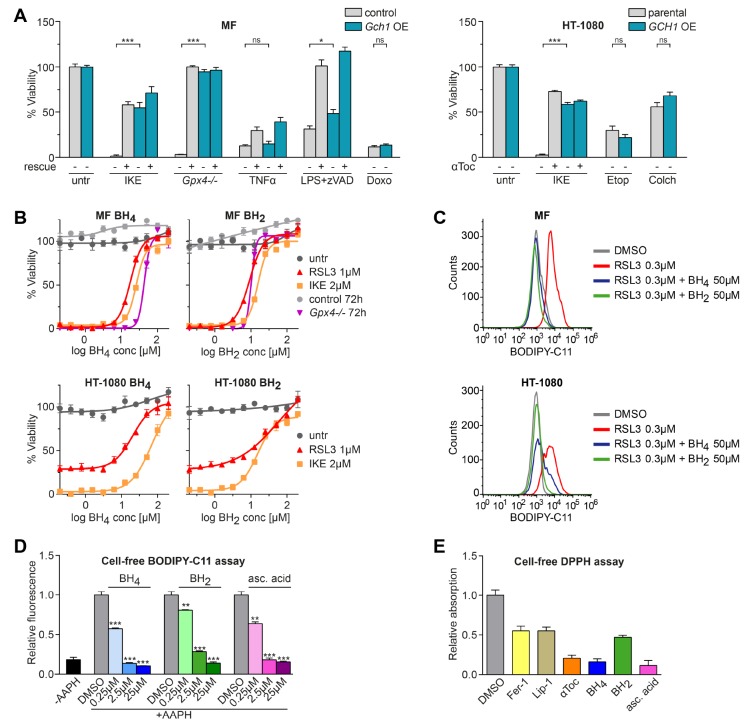
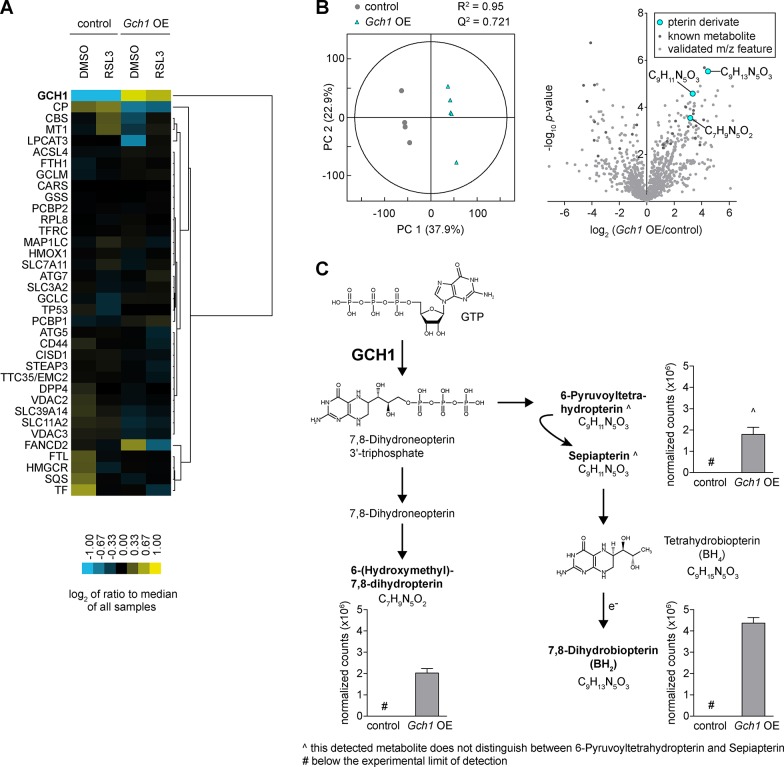
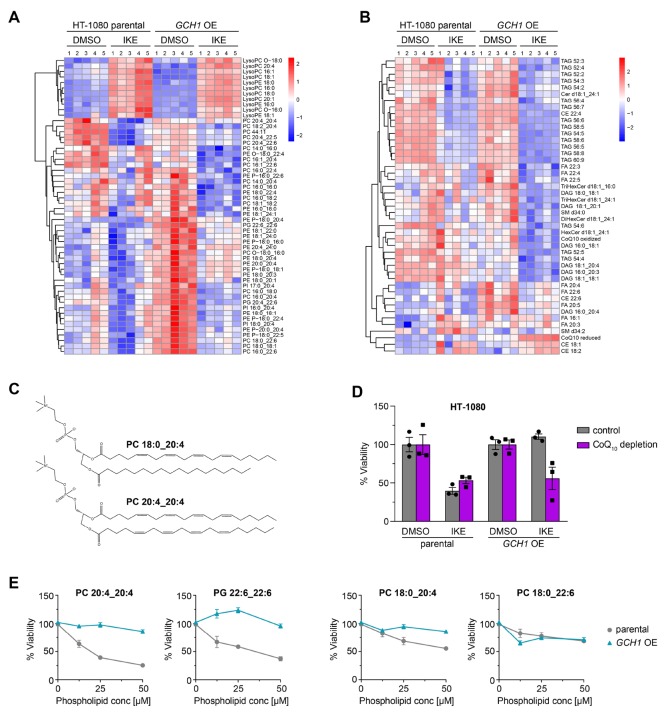
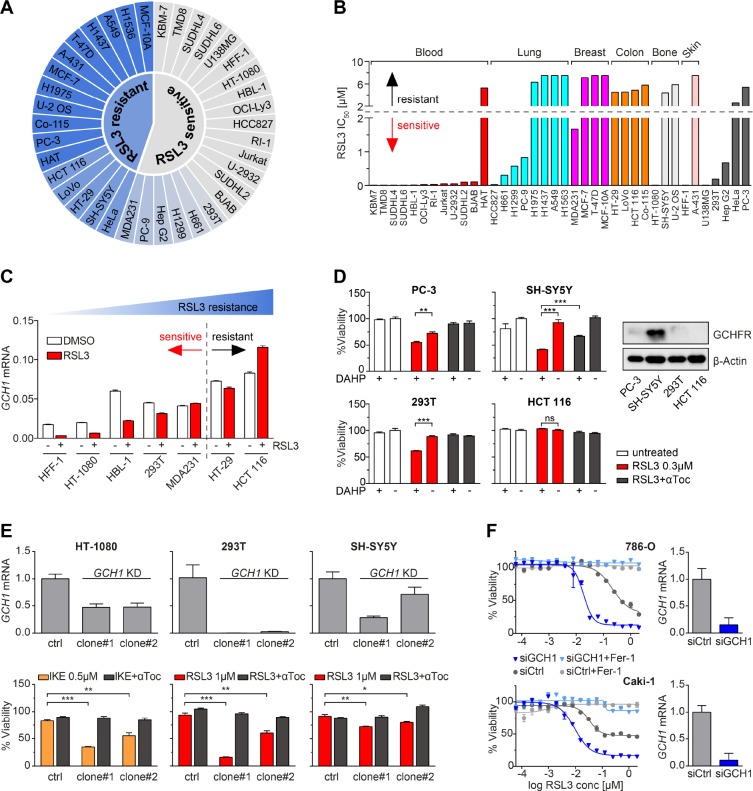
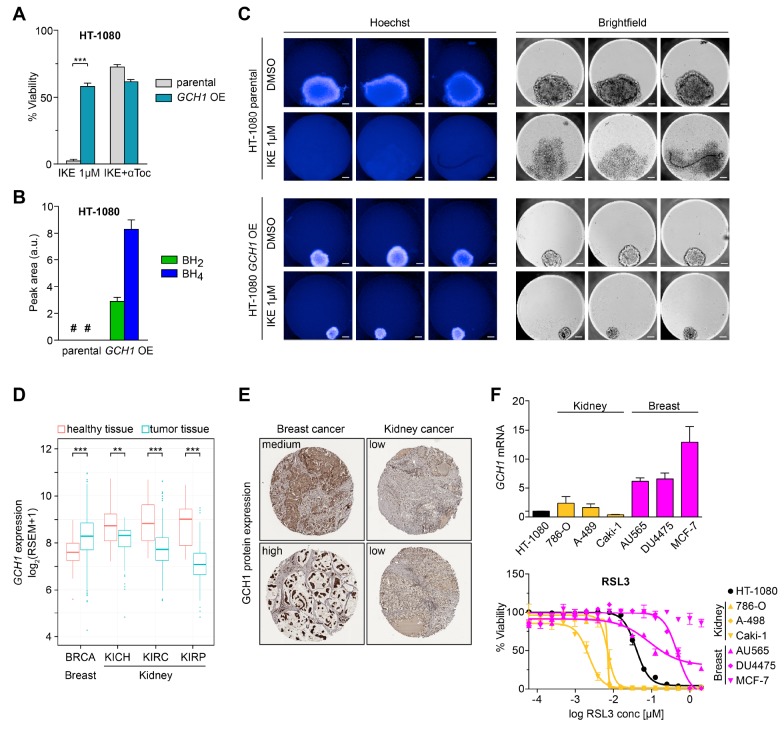
Ferroptosis is an iron-dependent form of regulated cell death linking iron, lipid, and glutathione levels to degenerative processes and tumor suppression. By performing a genome-wide activation screen, we identified a cohort of genes antagonizing ferroptotic cell death, including GTP cyclohydrolase-1 (GCH1) and its metabolic derivatives tetrahydrobiopterin/dihydrobiopterin (BH4/BH2). Synthesis of BH4/BH2 by GCH1-expressing cells caused lipid remodeling, suppressing ferroptosis by selectively preventing depletion of phospholipids with two polyunsaturated fatty acyl tails. GCH1 expression level in cancer cell lines stratified susceptibility to ferroptosis, in accordance with its expression in human tumor samples. The GCH1-BH4-phospholipid axis acts as a master regulator of ferroptosis resistance, controlling endogenous production of the antioxidant BH4, abundance of CoQ10, and peroxidation of unusual phospholipids with two polyunsaturated fatty acyl tails. This demonstrates a unique mechanism of ferroptosis protection that is independent of the GPX4/glutathione system.


Conflict of interest statement

The authors declare the following competing financial interest(s): B.R.S. holds equity in and consults with Inzen Therapeutics and is an inventor on patents and patent applications related to IKE and ferroptosis. J.A.S. holds patents related to ferroptosis. The other authors declare no competing interests.

Figures

Figure 1
Figure 1
A CRISPR activation screen identifies Gch1 as ferroptosis antagonist. (A) Venn diagram of overlapping top 30 genes found in each overexpression screen against ferroptosis inducers 0.3 μM RSL3, 2 μM IKE, and Gpx4–/– by 1 μM tamoxifen. (B) Relative Gch1 mRNA expression levels and dose response curves against RSL3 treatment in Gch1-overexpressing MF-dCas9-Gch1 (Gch1 OE) cells and empty vector control (control) immortalized mouse fibroblasts. Addition of 10 μM α-tocopherol (αToc) serves as rescue control for ferroptosis. (C) Relative GCH1 mRNA expression levels and dose response curve against RSL3 treatment in HT-1080 cells overexpressing GCH1-IRES-Puro construct (GCH1 OE) and parental HT-1080 cells (parental) ± 2 μM ferrostatin-1 (Fer-1) rescue. Viability data are plotted as mean ± SEM of n = 3 (B) or n = 2 (C) technical replicates of at least three repetitions of the experiment with similar outcomes. Relative mRNA expression is shown as mean ± SD of n = 3 technical replicates of three independent repetitions of the experiment with similar results.
Figure 2
Figure 2
Gch1 overexpression and its downstream metabolites BH4/BH2 rescue from ferroptosis. (A) Survival of MF-dCas9-Gch1 (Gch1 OE) compared to empty vector MF control (control) cells and GCH1-IRES-Puro (GCH1 OE) cells compared to parental HT-1080 cells (parental), respectively, against inducers of cell death: Ferroptosis induced with 2 μM IKE and Gpx4–/– by using 1 μM tamoxifen with 10 μM α-tocopherol (αToc) rescue. Extrinsic apoptosis induced by 20 ng/mL tumor necrosis factor α (TNFα) with 10 μM z-VAD-FMK (zVAD) rescue. Intrinsic apoptosis induced by 20 μM doxorubicin (Doxo), 25 μM etoposide (Etop), and 12.5 μM colchicine (Colch). Necroptosis induced by 1 μg/mL lipopolysaccharide (LPS) cotreatment with 10 μM zVAD with 10 μM necrostatin-1 (Nec-1) rescue. (B) Dose response curves of BH2 and BH4 starting at 200 μM rescuing from ferroptosis in MF control and parental HT-1080 cells induced by 1 μM RSL3, 2 μM IKE, and Gpx4–/– by 1 μM tamoxifen. (C) Effect of BH2 and BH4 on lipid peroxidation induced by 0.3 μM RSL3 induction in MF control and parental HT-1080 cells measured by BODIPY 581/591 C11 stain (BODIPY-C11). A typical FACS histogram of n = 4 technical replicates of three independent repetitions is depicted. (D) Dose-dependent effect of BH4, BH2, and ascorbic acid (asc. acid) addition on BODIPY-C11 oxidation by 2,2′-azobis(2-methylpropionamidine) dihydrochloride (AAPH) in a cell-free system compared to DMSO control. (E) Antioxidative capacity of ferroptosis-relevant substances at equimolar concentration quantified by cell-free 2,2-diphenyl-1-picrylhydrazyl (DPPH) assay. Viability is plotted as mean ± SEM with at least duplicate (A) or n = 4 (B) technical replicates; three independent experiments were performed with similar results. Cell-free assays (D, E) are reported as mean ± SD of n = 3 technical replicates of three independent experiments with similar outcomes.
Figure 3
Figure 3
Gch1 overexpression enhances folate pathway derivatives but does not affect known ferroptosis regulators. (A) Protein levels by heat map of known ferroptosis regulators upon 0.3 μM RSL3 treatment for 3 h in Gch1-overexpressing MF cells (Gch1 OE) compared to control cells (control). Data were average of n = 4 or 5 independent biological replicates per condition. (B) Partial least-squares discriminant analysis of Gch1 OE cells compared to control and volcano plot of whole-cell-shotgun metabolomics analysis. (C) Upregulated metabolic precursors of BH4 and BH2 in KEGG pathway of GCH1 in Gch1 OE cells compared to control (n = 5 independent biological replicates).
Figure 4
Figure 4
Untargeted lipidomics reveals GCH1 overexpression cells protect from ferroptotic degradation of specific lipids. Heat map (one-way ANOVA; FDR-corrected p-value <0.05) showing changes in phospholipid profile (A), and glycerolipid, sphingolipid, and free fatty acid profiles (B) of DMSO or 10 μM IKE treated GCH1-overexpressing (GCH1 OE) and parental HT-1080 cells. Each row represents Z-scored-normalized intensities of the differentiated lipid species. Each column represents the mean of n = 2 technical replicates of n = 5 independent biological replicates. The relative abundance of lipid is color-coded from red indicating high signal intensity to dark blue indicating low intensity and clustered using Pearson correlations. Abbreviations: PC, phosphatidylcholine; PE, phosphatidyl-ethanolamine; PI, phosphatidylinositol; PG, phosphatidylglycerol; LPC, lysoPC; LPE, LysoPE; PE P-, plasmalogen PE; PC/PE -O, ether-linked PE/PC; TAG, triacylglycerol; DAG, diacylglycerol; FA, fatty acid; CE, cholesterylester; CoQ10, coenzyme Q10; Cer, ceramide; HexCer, monohexosyl-Cer. (C) Line structure of representative phospholipids PC 18:0_20:4 with one saturated acyl chain and one polyunsaturated fatty acyl (PUFA) chain, as well as PC 20:4_20:4 with two PUFA chains. (D) Treatment of parental and GCH1 OE HT-1080 cells with 4-nitrobenzoate in the absence of CoQ10 with ferroptosis induction by 8 μM IKE. Viability is plotted as biological replicates ± SEM n = 3. (E) Treatment of parental and GCH1 OE HT-1080 cells with exogenous PC 20:4_20:4, 18:0_20:4, 18:0_22:6, and PG 22:6_22:6 (concentrations 0–50 μM). Viability is plotted as mean ± SEM of n = 4 replicates.
Figure 5
Figure 5
GCH1 expression level determines cancer cell resistance to ferroptosis. (A) Color scaled profiling of 38 cancer cell lines according to RSL3 sensitivity based on their respective IC50. (B) IC50 values of 38 cancer cell lines against RSL3, grouped by tissue of origin. (C) GCH1 mRNA levels of seven representative cancer cell lines upon RSL3 treatment compared to DMSO. (D) Synthetic lethality induced by 1 mM DAHP and 0.3 μM RSL3 treatment in PC-3, SH-SY5Y, 293T, and HCT 116 cells with 10 μM αToc rescue. Protein levels of GCHFR compared to β-actin in these cell lines shown by Western blot. (E) GCH1 mRNA levels and viability upon ferroptosis induction in HT-1080, 293T, and SH-SY5Y CRISPRi knockdown (GCH1 KD) in two clonal cell lines each compared to respective empty vector control line (ctrl) with 10 μM αToc rescue. (F) GCH1 mRNA levels and viability upon RSL3 treatment in 786-O and Caki-1 GCH1 siRNA knockdown cells (siGCH1) compared to control siRNA (siCtrl) with 2 μM ferrostatin-1 (Fer-1) rescue. Viability is reported as mean ± SEM of n = 3 (D, E) or n = 2 (F) technical replicates. Relative mRNA expression is shown as mean ± SD of n = 3 technical replicates.
Figure 6
Figure 6
GCH1 expression increases resistance to ferroptosis in 3D spheroids, and human patient transcriptomics and pathology reveal coordinated GCH1 levels and ferroptosis sensitivity. (A) Data from Figure 2A showing survival of HT-1080 GCH1-overexpressing (GCH1 OE) cells against IKE-induced ferroptosis compared to parental cells (parental) with 10 μM αToc rescue. (B) BH4 and BH2 levels in HT-1080 GCH1 OE cells compared to parental cells of n = 6 biological replicates each. (C) Three-dimensional spheroid culture of GCH1 OE cells compared to parental cells and treatment with IKE. Three spheroids per condition were investigated. Scale bar = 100 μM. (D) GCH1 mRNA expression in tumor samples compared to healthy para-tumor tissue in breast and kidney cancers. BRCA, p = 2.39 × 10⁻¹⁷; KICH, p = 0.02; KIRC, p = 7.54 × 10⁻²⁷; p = KIRP, 10.7 × 10⁻²⁵. (E) GCH1 protein expression in breast and renal cancer tissue (Human Protein Atlas). (F) GCH1 mRNA and viability upon RSL3 treatment in kidney and breast cancer cell lines compared to HT-1080 cells. Viability is shown as mean ± SEM of n = 2 replicates of three independent repetitions of the experiment with similar outcomes. # means non detectable.

References

    1. Dixon S. J.; Lemberg K. M.; Lamprecht M. R.; Skouta R.; Zaitsev E. M.; Gleason C. E.; Patel D. N.; Bauer A. J.; Cantley A. M.; Yang W. S.; et al. Ferroptosis: an iron-dependent form of nonapoptotic cell death. Cell 2012, 149 (5), 1060.10.1016/j.cell.2012.03.042. - DOI - PMC - PubMed
    1. Stockwell B. R.; Friedmann Angeli J. P.; Bayir H.; Bush A. I.; Conrad M.; Dixon S. J.; Fulda S.; Gascon S.; Hatzios S. K.; Kagan V. E.; et al. Ferroptosis: A Regulated Cell Death Nexus Linking Metabolism, Redox Biology, and Disease. Cell 2017, 171 (2), 273.10.1016/j.cell.2017.09.021. - DOI - PMC - PubMed
    1. Yang W. S.; Stockwell B. R. Ferroptosis: Death by Lipid Peroxidation. Trends Cell Biol. 2016, 26 (3), 165.10.1016/j.tcb.2015.10.014. - DOI - PMC - PubMed
    1. Conrad M.; Kagan V. E.; Bayir H.; Pagnussat G. C.; Head B.; Traber M. G.; Stockwell B. R. Regulation of lipid peroxidation and ferroptosis in diverse species. Genes Dev. 2018, 32 (9–10), 602.10.1101/gad.314674.118. - DOI - PMC - PubMed
    1. Maiorino M.; Conrad M.; Ursini F. GPx4, Lipid Peroxidation, and Cell Death: Discoveries, Rediscoveries, and Open Issues. Antioxid. Redox Signaling 2018, 29 (1), 61.10.1089/ars.2017.7115. - DOI - PubMed