Review
. 2021 Mar 1;60(10):5010-5035.
doi: 10.1002/anie.201909880. Epub 2020 Oct 12.

Porphyrin-Based Metal-Organic Frameworks for Biomedical Applications

Affiliations
Review

Porphyrin-Based Metal-Organic Frameworks for Biomedical Applications

Jiajie Chen et al. Angew Chem Int Ed Engl. .

Abstract

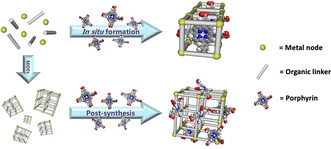
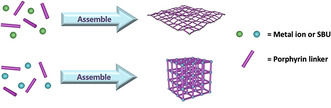
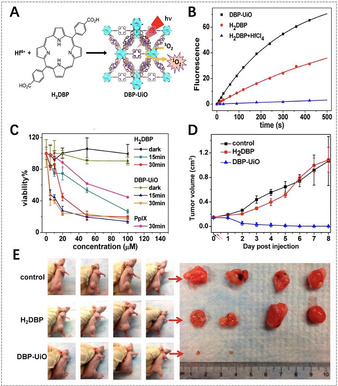
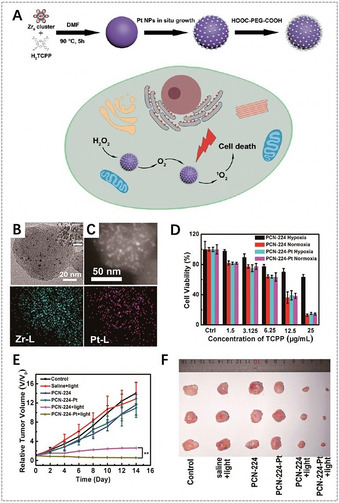
Porphyrins and porphyrin derivatives have been widely explored for various applications owing to their excellent photophysical and electrochemical properties. However, inherent shortcomings, such as instability and self-quenching under physiological conditions, limit their biomedical applications. In recent years, metal-organic frameworks (MOFs) have received increasing attention. The construction of porphyrin-based MOFs by introducing porphyrin molecules into MOFs or using porphyrins as organic linkers to form MOFs can combine the unique features of porphyrins and MOFs as well as overcome the limitations of porphyrins. This Review summarizes important synthesis strategies for porphyrin-based MOFs including porphyrin@MOFs, porphyrinic MOFs, and composite porphyrinic MOFs, and highlights recent achievements and progress in the development of porphyrin-based MOFs for biomedical applications in tumor therapy and biosensing. Finally, the challenges and prospects presented by this class of emerging materials for biomedical applications are discussed.

Keywords: biosensing; metal-organic frameworks; porphyrins; tumor therapy.


Conflict of interest statement

The authors declare no conflict of interest.

Figures

Figure 1
Figure 1
Prominent applications of porphyrins and porphyrin derivatives.
Figure 2
Figure 2
Two different processes for integrating porphyrins in MOFs: in situ formation and post‐synthesis.
Figure 3
Figure 3
Synthesis of porphyrinic MOFs with 2D or 3D structure.
Figure 4
Figure 4
The main biomedical applications of porphyrin‐based MOFs. Reproduced with permission. [79] Copyright 2017, Nature Publishing Group. Reproduced with permission. [66] Copyright 2018, Wiley‐VCH.
Figure 5
Figure 5
A) Synthesis of DBP‐UiO NMOFs and generation of 1O2. B) 1O2 generation of DBP‐UiO, H2DBP, and H2DBP+HfCl4 detected by Singlet Oxygen Sensor Green (SOSG) assay. C) In vitro PDT cytotoxicity of different components (PpIX=protoporphyrin IX). D) In vivo tumor volume changes after PDT in the presence of different components (black and red arrows refer to the injection and irradiation time points, respectively). E) Photographs of the mice and the corresponding tumors after PDT. (A–E) Reproduced with permission. [42] Copyright 2016, American Chemical Society.
Figure 6
Figure 6
A) Synthesis of PCN‐224‐Pt NMOFs for enhanced PDT. B) Transmission electron microscopy (TEM) image of PCN‐224‐Pt NMOFs. C) Top: High‐angle annular dark‐field scanning transmission electron microscopy (HAADF‐STEM) image of PCN‐224‐Pt NMOFs; bottom: the corresponding elemental mappings of the Zr‐L edge (left) and Pt‐L edge (right) signals. D) In vitro PDT cytotoxicity of PCN‐224 and PCN‐224‐Pt under different conditions. E) Changes of relative tumor volume in vivo after various treatments. F) Photographs of the corresponding tumors after various treatments. (A–F) Reproduced with permission. [39] Copyright 2018, American Chemical Society.
Figure 7
Figure 7
A) Illustration of AuNR@MOFs for synergistic chemotherapy and phototherapy. TEM images of B) AuNR and C) AuNR@MOFs. D) HAADF‐STEM image of AuNR@MOFs and the corresponding elemental mappings. E) In vitro cytotoxicity of AuNR@MOFs@CPT with different treatments. F) Photothermal images of the mice treated with PBS and AuNR@MOFs@CPT, respectively, upon 808 nm laser irradiation. G) Changes of relative tumor volume in vivo after various treatments (red arrows refer to the time points of treatment). H) The tumor weights of different groups after treatment for 18 days. (A–H) Reproduced with permission. [38a] Copyright 2018, Wiley‐VCH.
Figure 8
Figure 8
A) The proposed mechanism of antitumor immune responses induced by the combination of PDT and α‐PD‐1. B) Synergistic therapy using TBP‐nMOFs. C) Comparative analysis after various treatments (from left to right): the tumor weight after 22 days, the percentage of CD8+ cells, the generation of IFN‐γ and TNF‐α in mice sera obtained on the 12th day. D) Bioluminescence imaging of the mice and the lung metastatic sites of the luciferase‐4T1 (luc‐4T1) tumors corresponding to the above five treatments. (A–D) Reproduced with permission. [70] Copyright 2018, American Chemical Society.
Figure 9
Figure 9
A) Illustration of l‐Arg‐incorporated PCN‐224 NMOFs for combined gas therapy and PDT. B) ROS generation in different groups detected by a 2′,7′‐dichlorofluorescin diacetate (DCFH‐DA) probe. C) NO generation in different groups. D) In vitro cytotoxicity of 4T1 cells after different treatments. E) Changes of relative tumor volume in vivo after various treatments (red arrows refer to the light irradiation time points). (A–E) Reproduced with permission. [52c] Copyright 2018, Elsevier Ltd.
Figure 10
Figure 10
Fluorescence images of A) the mouse (yellow dotted lines refer to the liver region, red dotted lines refer to the intestine region, and green dotted lines refer to the lymph node) and B) the tumor‐bearing mouse (yellow arrows refer to the small lymph node, blue arrows refer to the subcutaneous transplantable tumor) recorded at excitation of 530 nm and emission of 700 nm after injection of NPMOFs. C) Fluorescence images of dissected organs of a tumor‐bearing mouse. (A–C) Reproduced with permission. [37a] Copyright 2017, Wiley‐VCH.
Figure 11
Figure 11
A) Fluorescence images of the tumor‐bearing mouse before and after injection of Fe3O4@C@PMOF (red arrow refers to the liver region, yellow arrow refers to the tumor region). B) T 2‐weighted MRI of the tumor‐bearing mouse (upper red dot lines refer to the liver region, lower red dot lines refer to the tumor region). C) Infrared thermal photographs of tumor‐bearing mice in different groups (black arrows refer to the tumor region). D) Changes of relative tumor volume in vivo after various treatments (black and red arrows refer to the injection and irradiation time points, respectively). (A–D) Reproduced with permission. [79] Copyright 2017, Nature Publishing Group.
Figure 12
Figure 12
A) Synthesis of TCPP(Fe)@MOF‐SA and its electrochemical DNA sensing. B) Differential pulse voltammogram (DPV) responses of TCPP(Fe)@MOF‐SA to different concentrations of the target DNA from 0 to 10 nm. C) DPV responses of FeTCPP@MOF‐SA to 100 pm of different DNA sequences: a) target DNA, b) single‐base‐mismatched DNA, c) two‐base‐mismatched DNA, d) three‐base‐mismatched DNA, and e) random DNA in the catalytic system of o‐PD/H2O2. (A–C) Reproduced with permission. [86a] Copyright 2015, American Chemical Society. D) Preparation of the hemin‐encapsulated Fe‐MIL‐88 based electrochemical biosensor and the TB detection principle. E) DPV of TB detection at different concentrations from 0 to 30 nm. F) Specificity of the biosensor toward different samples: a) no analyte, b) 100 nm Apo‐A1, c) 100 nm Hb, d) 100 nm l‐Cys, e) 10 nm TB, and f) 100 nm Apo‐A1+100 nm Hb+100 nm l‐cys+10 nm TB. (D–F) Reproduced with permission. [26c] Copyright 2015, Royal Society of Chemistry.
Figure 13
Figure 13
A) Synthesis of mixed‐ligand R‐UiO. B) TEM image of R‐UiO. C) Emission spectra and D) phosphorescent decay of R‐UiO in Hank's Balanced Salt Solution (HBSS) buffer under different oxygen partial pressures with excitation wavelengths of 514 nm and 405 nm. E) Calibration curve of the phosphorescence/fluorescence intensity of R‐UiO on confocal laser scanning microscopy (CLSM) under different O2 pressures. F) Ratiometric luminescence images of CT26 cells after treatment with R‐UiO under hypoxia, normoxia, and aerated conditions (from left to right) with an excitation wavelength of 514 nm. (A–F) Reproduced with permission. [36b] Copyright 2016, American Chemical Society.

References

    1. Gottfried J. M., Surf. Sci. Rep. 2015, 70, 259–379.
    1. Adler A. D., Longo F. K. F. R., Kim J., J. Inorg. Nucl. Chem. 1970, 32, 2443–2445.
    1. None
    1. Kadish K. M., Smith K. M., Guilard R., The Porphyrin Handbook, Vols. 1–20, Academic Press, San Diego, 2000. –2003;
    2. Kadish K. M., Smith K. M., Guilard R., Handbook of Porphyrin Science Vols. 1–35, World Scientific Publishing Co., 2010–2014.
    1. Longevial J.-F., Clément S., Wytko J. A., Ruppert R., Weiss J., Richeter S., Chem. Eur. J. 2018, 24, 15442–15460. - PubMed

MeSH terms

LinkOut - more resources