

No carbon limitation after lower crown loss in Pinus radiata
- PMID: 31990290
- PMCID: PMC7218809
- DOI: 10.1093/aob/mcaa013
No carbon limitation after lower crown loss in Pinus radiata
Abstract
Background and aims: Biotic and abiotic stressors can cause different defoliation patterns within trees. Foliar pathogens of conifers commonly prefer older needles and infection with defoliation that progresses from the bottom crown to the top. The functional role of the lower crown of trees is a key question to address the impact of defoliation caused by foliar pathogens.
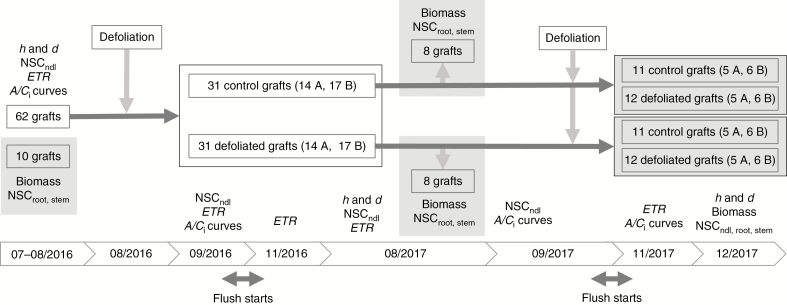
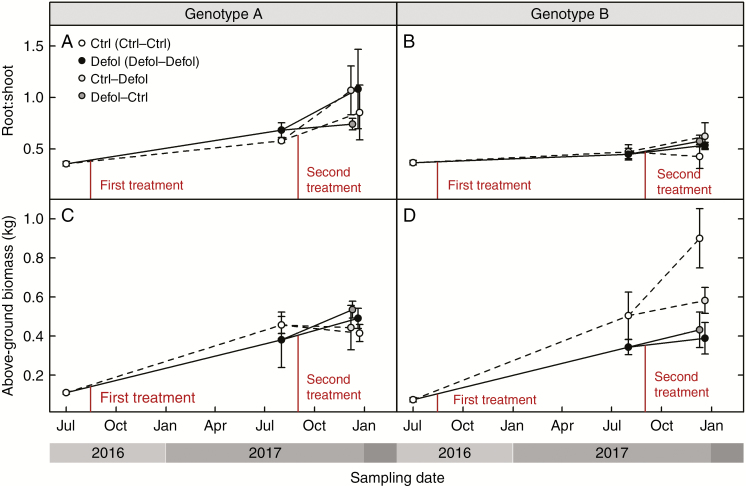
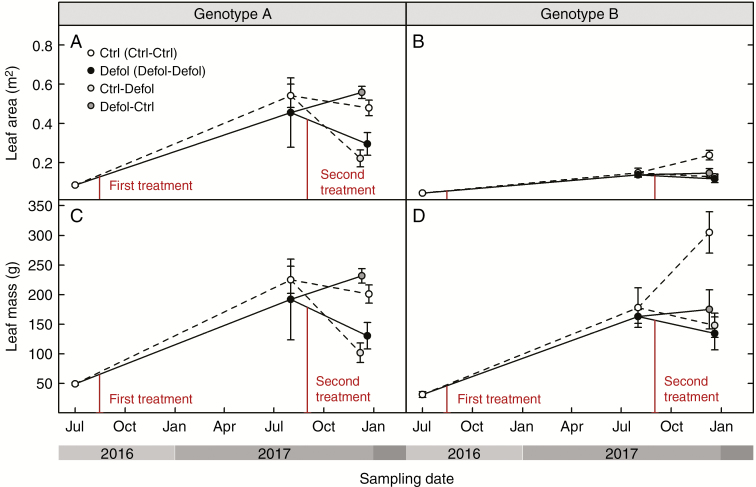
Methods: A 2 year artificial defoliation experiment was performed using two genotypes of grafted Pinus radiata to investigate the effects of lower-crown defoliation on carbon (C) assimilation and allocation. Grafts received one of the following treatments in consecutive years: control-control, control-defoliated, defoliated-control and defoliated-defoliated.
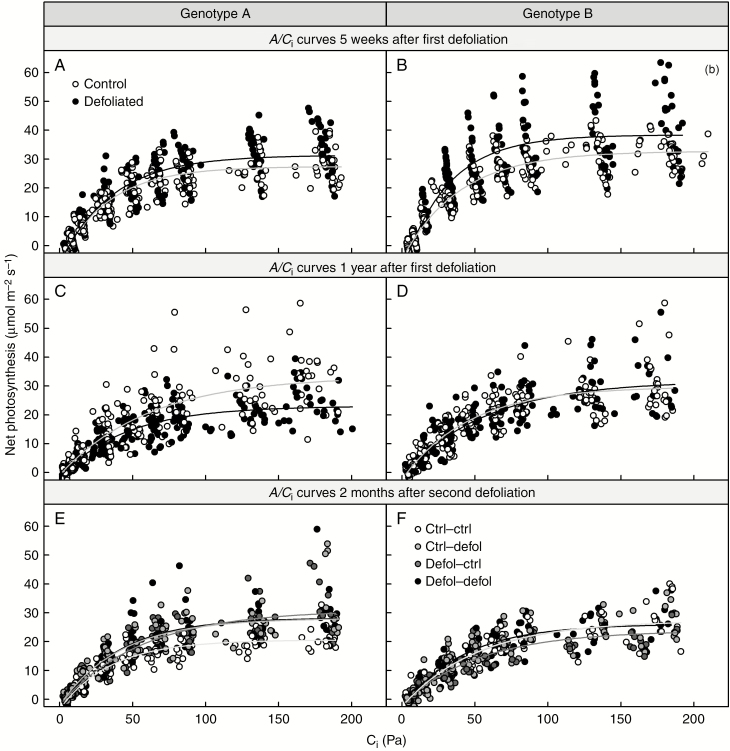
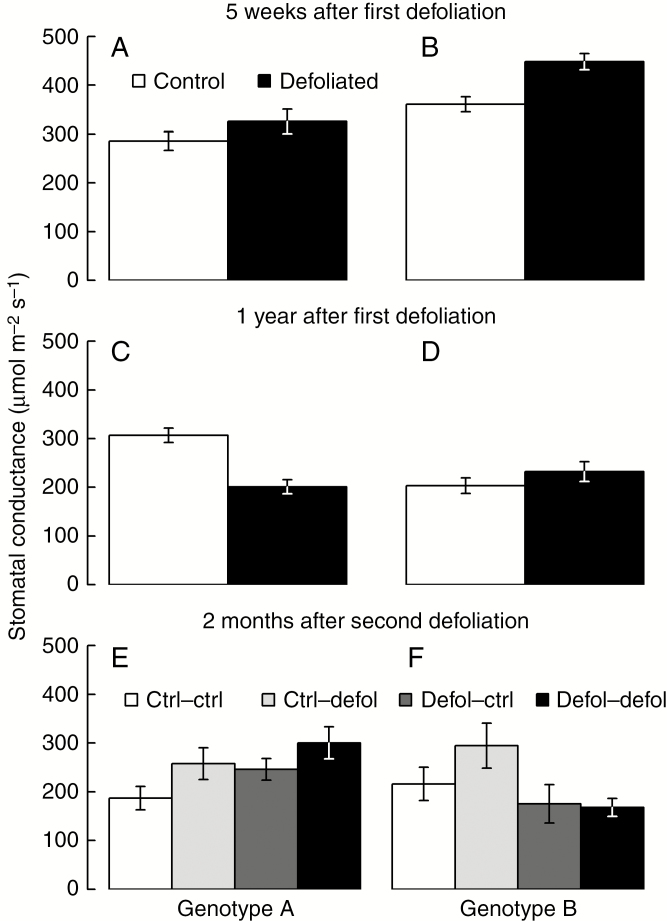
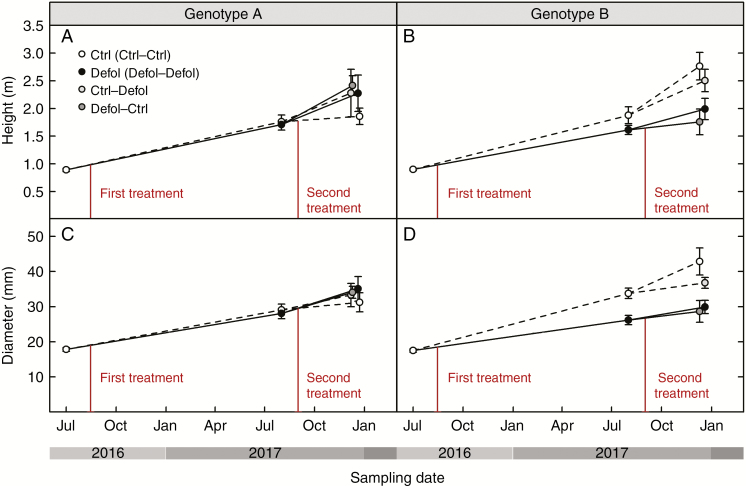
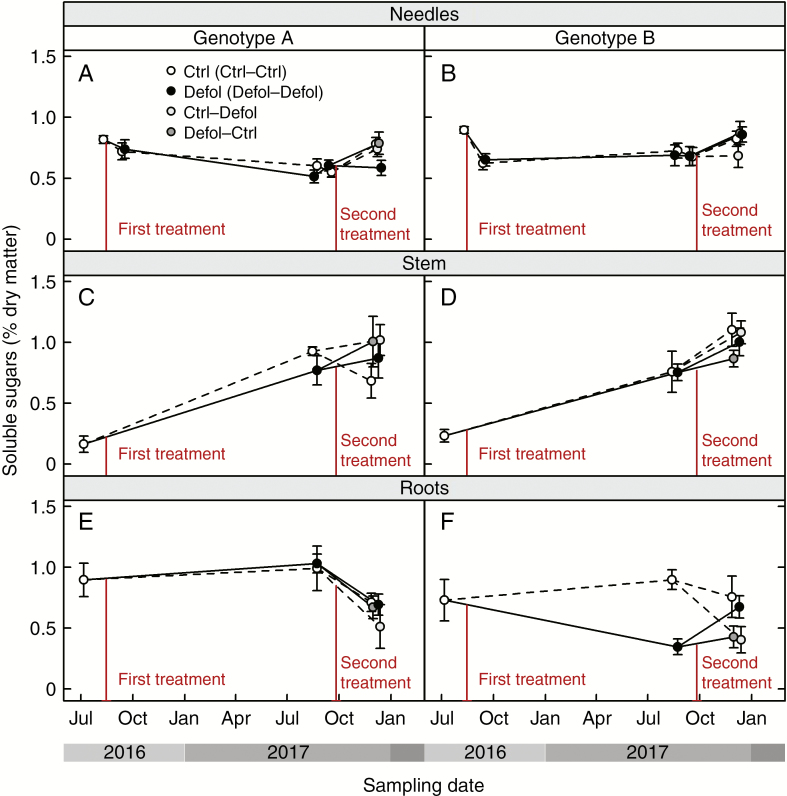
Results: No upregulation of photosynthesis either biochemically or through stomatal control was observed in response to defoliation. The root:shoot ratio and leaf mass were not affected by any treatment, suggesting prioritization of crown regrowth following defoliation. In genotype B, defoliation appeared to impose C shortage and caused reduced above-ground growth and sugar storage in roots, while in genotype A, neither growth nor storage was altered. Root C storage in genotype B decreased only transiently and recovered over the second growing season.
Conclusions: In genotype A, the contribution of the lower crown to the whole-tree C uptake appears to be negligible, presumably conferring resilience to foliar pathogens affecting the lower crown. Our results suggest that there is no C limitation after lower-crown defoliation in P. radiata grafts. Further, our findings imply genotype-specific defoliation tolerance in P. radiata.
Keywords: A/C i curves; Pinus radiata; biomass; defoliation; foliar pathogens; growth; leaf area; non-structural carbohydrates; photosynthesis; root:shoot.
© The Author(s) 2020. Published by Oxford University Press on behalf of the Annals of Botany Company. All rights reserved. For permissions, please e-mail: journals.permissions@oup.com.
Figures
References
-
- Ackerly D. 1999. Self-shading, carbon gain and leaf dynamics: a test of alternative optimality models. Oecologia 119: 300–310. - PubMed
-
- Adams HD, Zeppel MJB, Anderegg WRL, et al.. 2017. A multi-species synthesis of physiological mechanisms in drought-induced tree mortality. Nature Ecology and Evolution 1: 1285–1291. - PubMed
-
- Aguade D, Poyatos R, Gomez M, Oliva J, Martinez-Vilalta J. 2015. The role of defoliation and root rot pathogen infection in driving the mode of drought-related physiological decline in Scots pine (Pinus sylvestris L.). Tree Physiology 35: 229–42. - PubMed
-
- Alderfer RG, Eagles CF. 1976. The effect of partial defoliation on the growth and photosynthetic efficiency of bean leaves. Botanical Gazette 137: 351–355.
-
- Allen CD, Breshears DD, McDowell NG. 2015. On underestimation of global vulnerability to tree mortality and forest die-off from hotter drought in the Anthropocene. Ecosphe 6: art129.
Publication types
MeSH terms
Substances
LinkOut - more resources
Full Text Sources
