. 2020 Apr;159(4):465-478.
doi: 10.1530/REP-19-0358.

OPN binds alpha V integrin to promote endothelial progenitor cell incorporation into vasculature

Affiliations

OPN binds alpha V integrin to promote endothelial progenitor cell incorporation into vasculature

Theodore T Wing et al. Reproduction. 2020 Apr.

Abstract

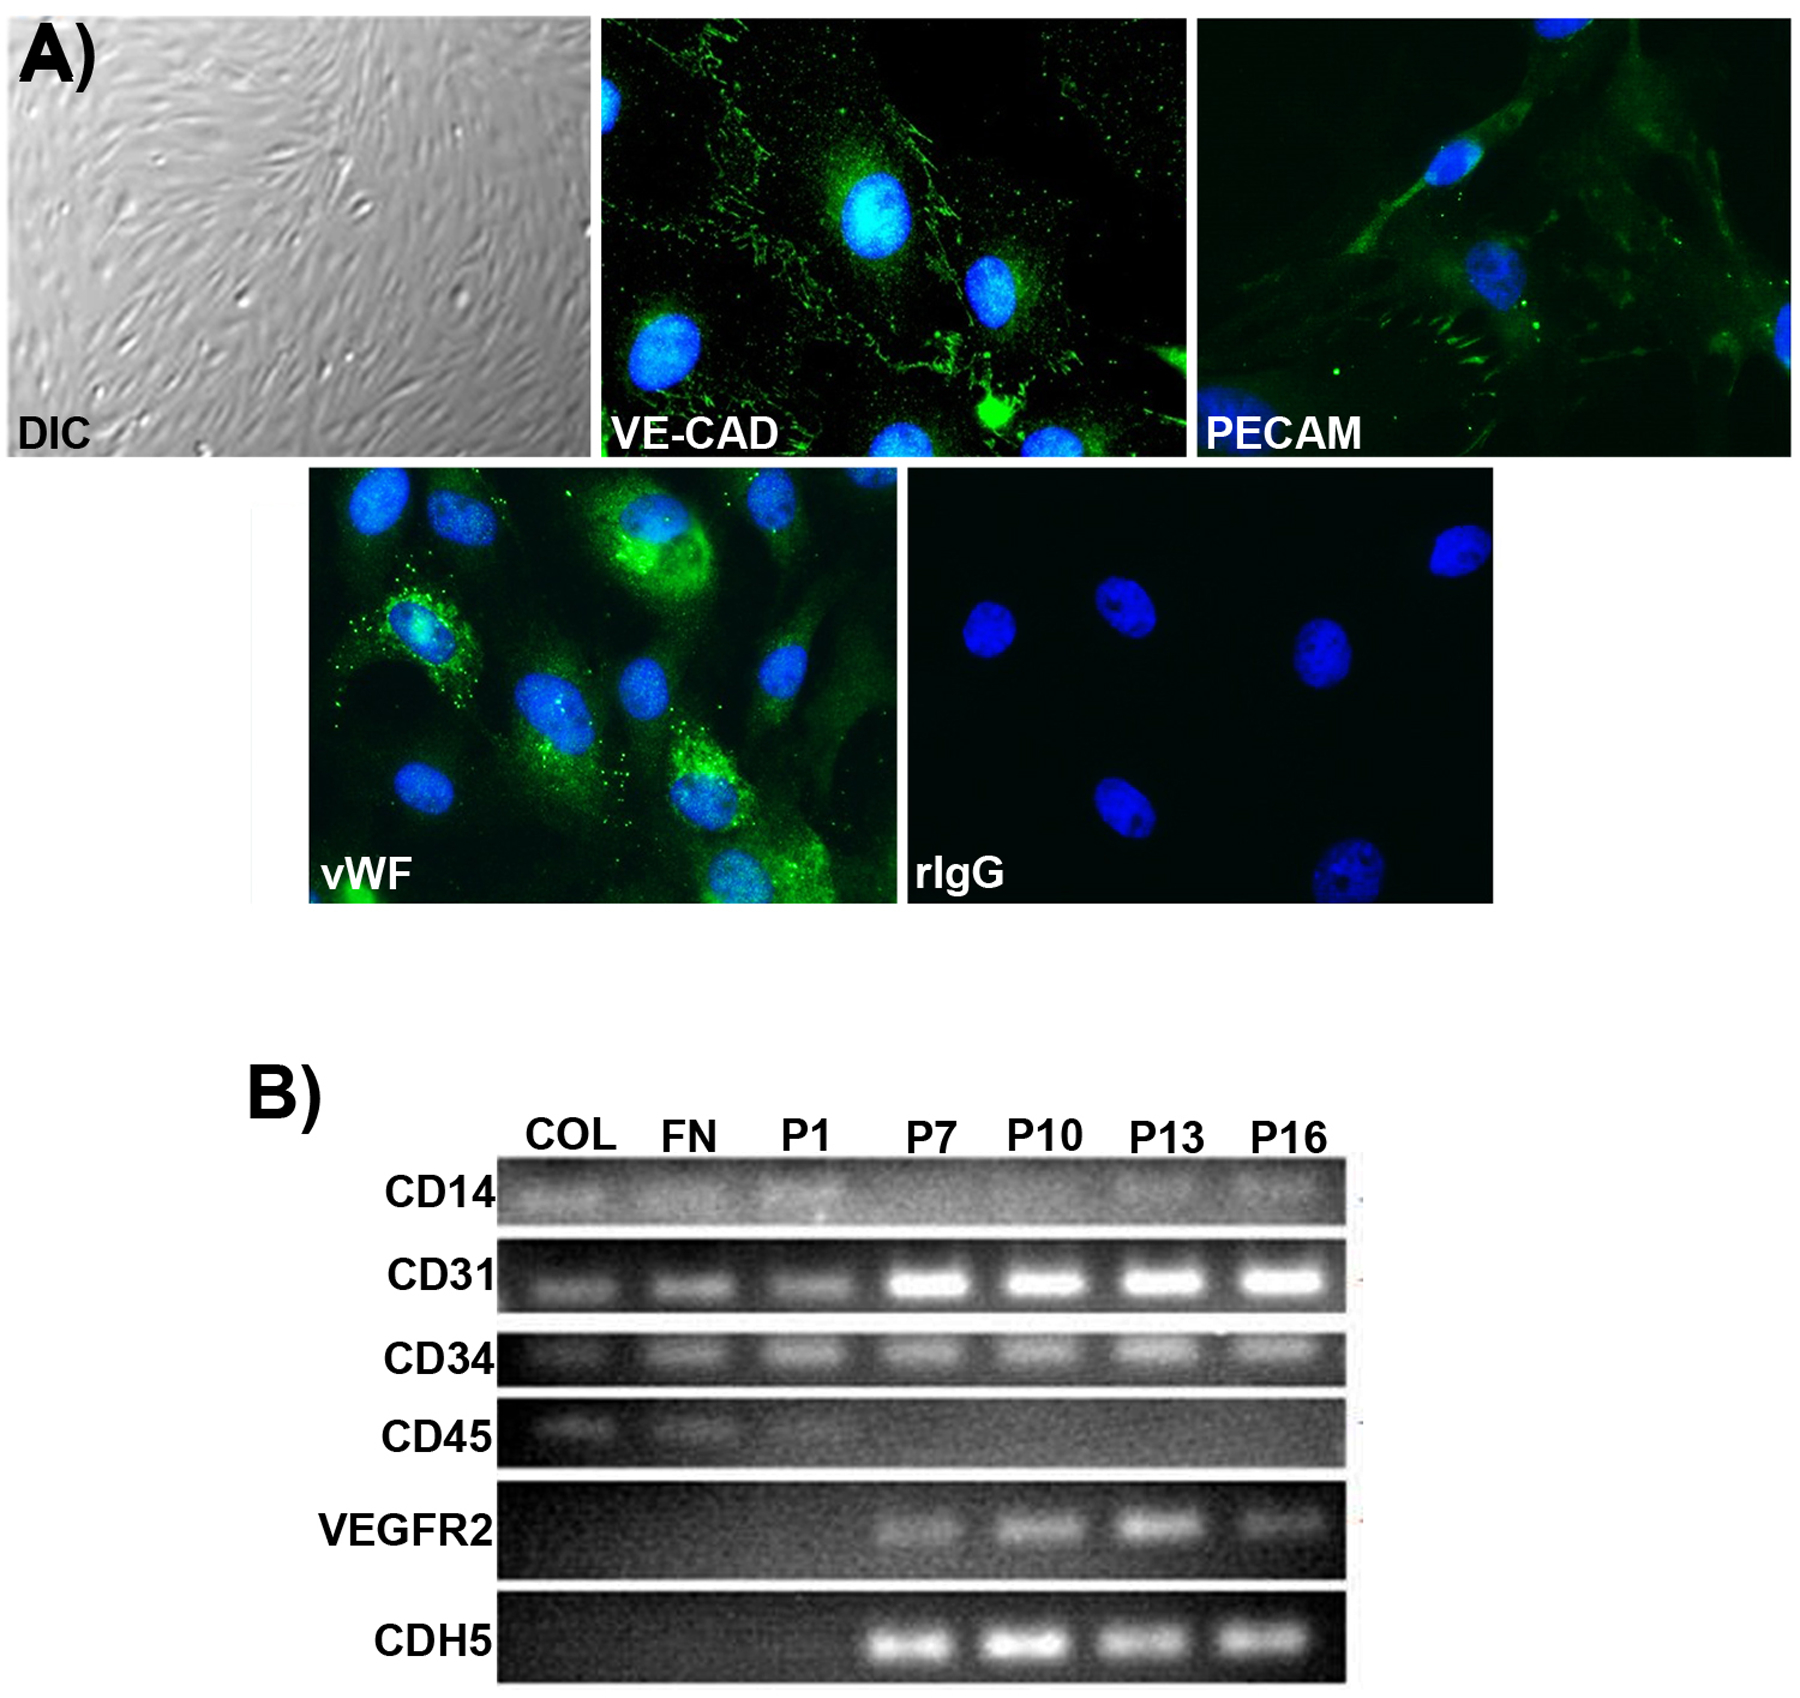
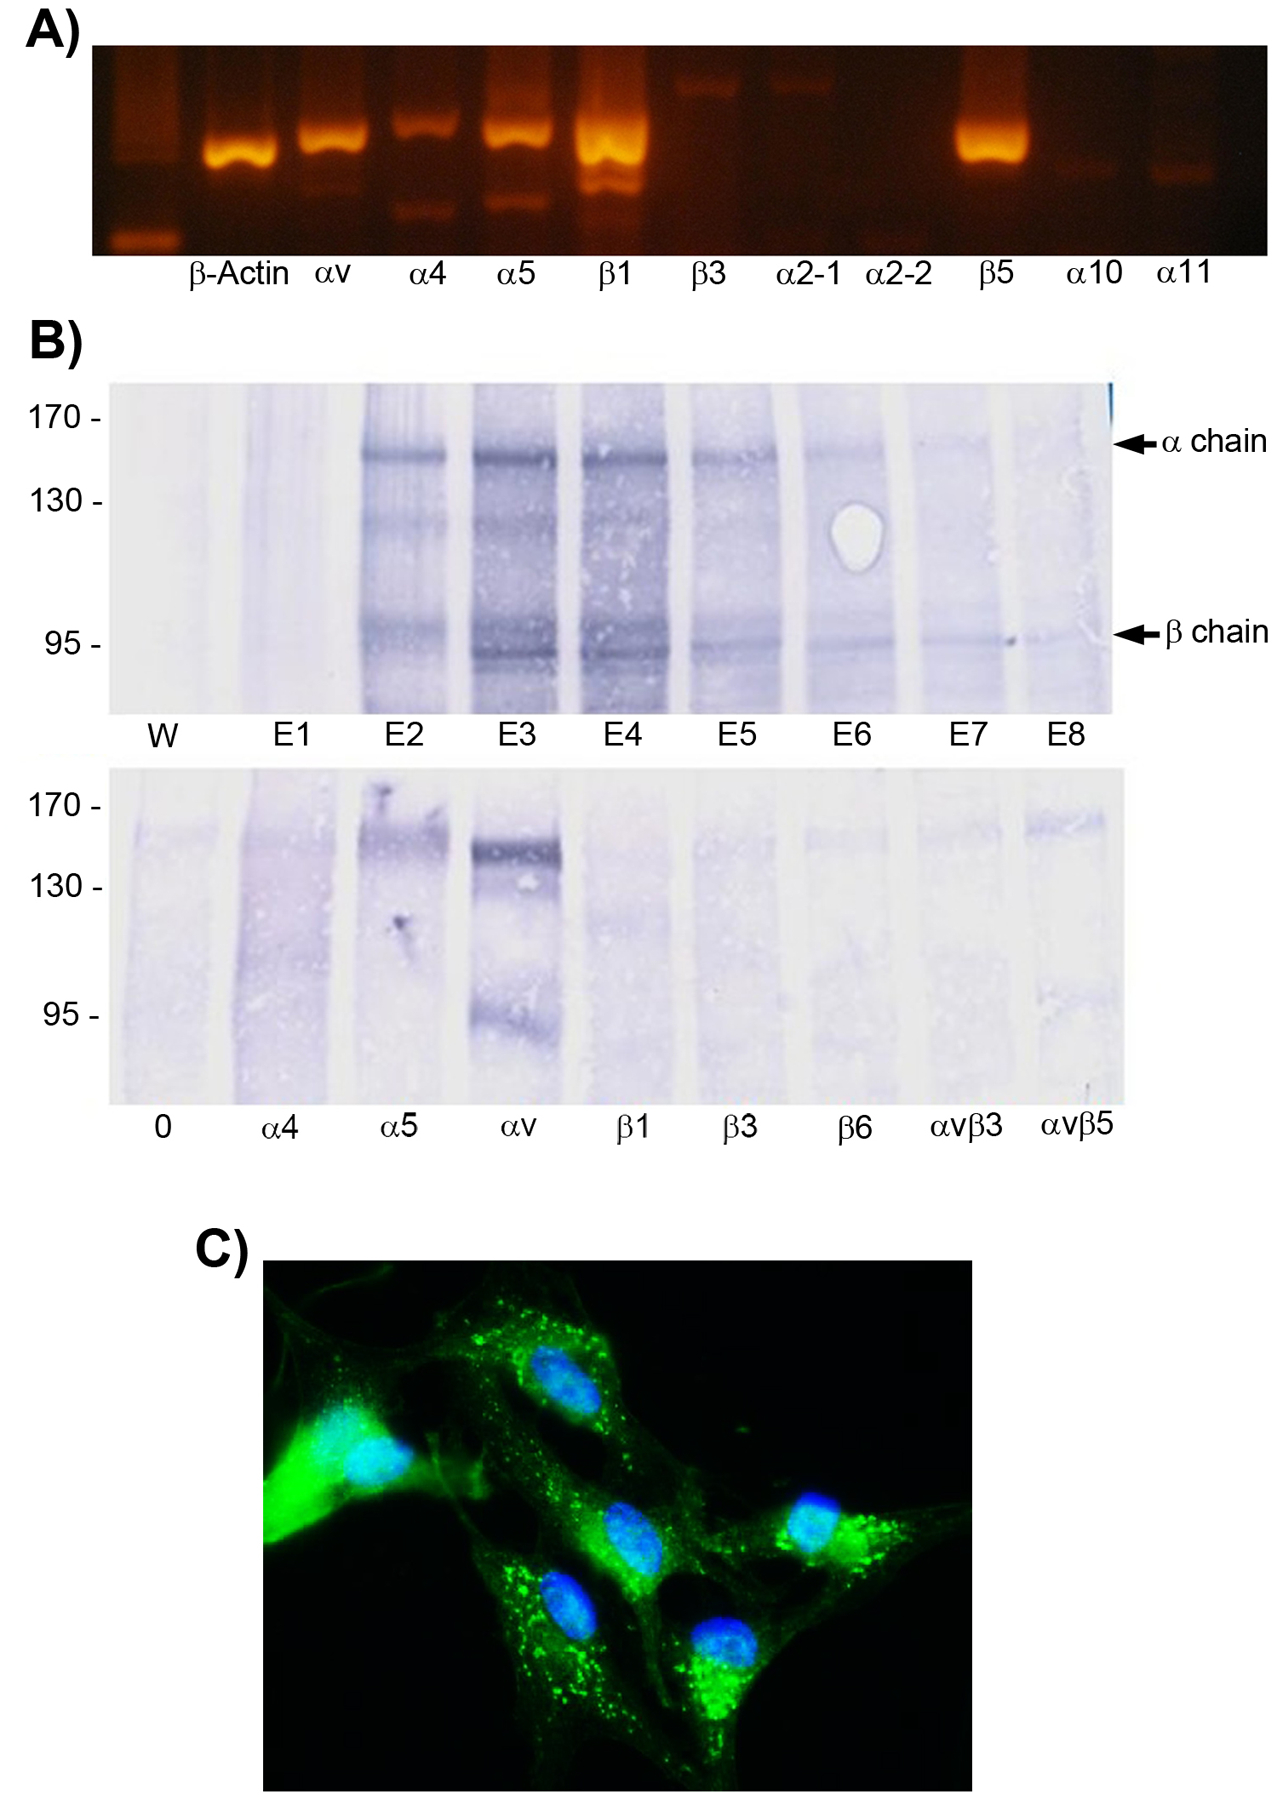
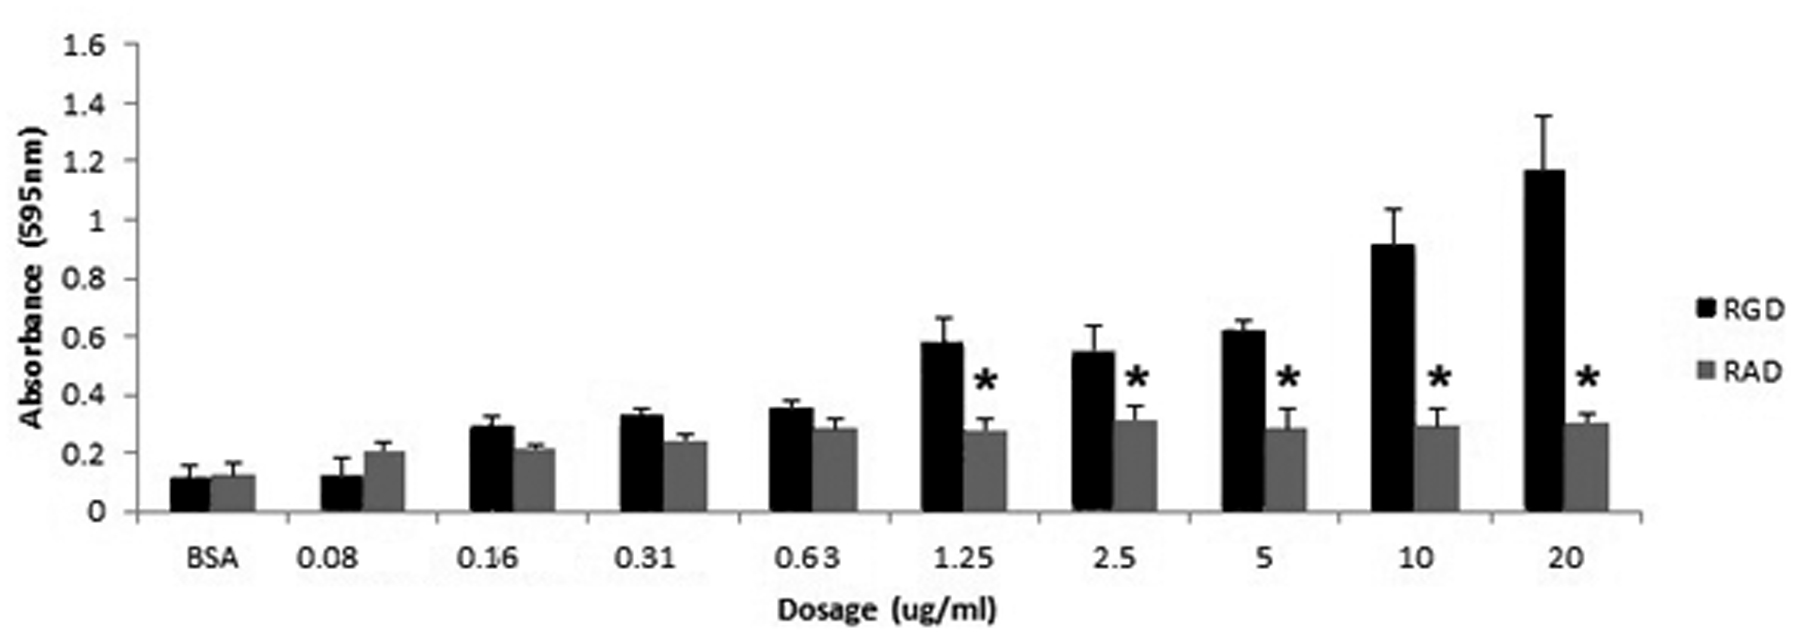
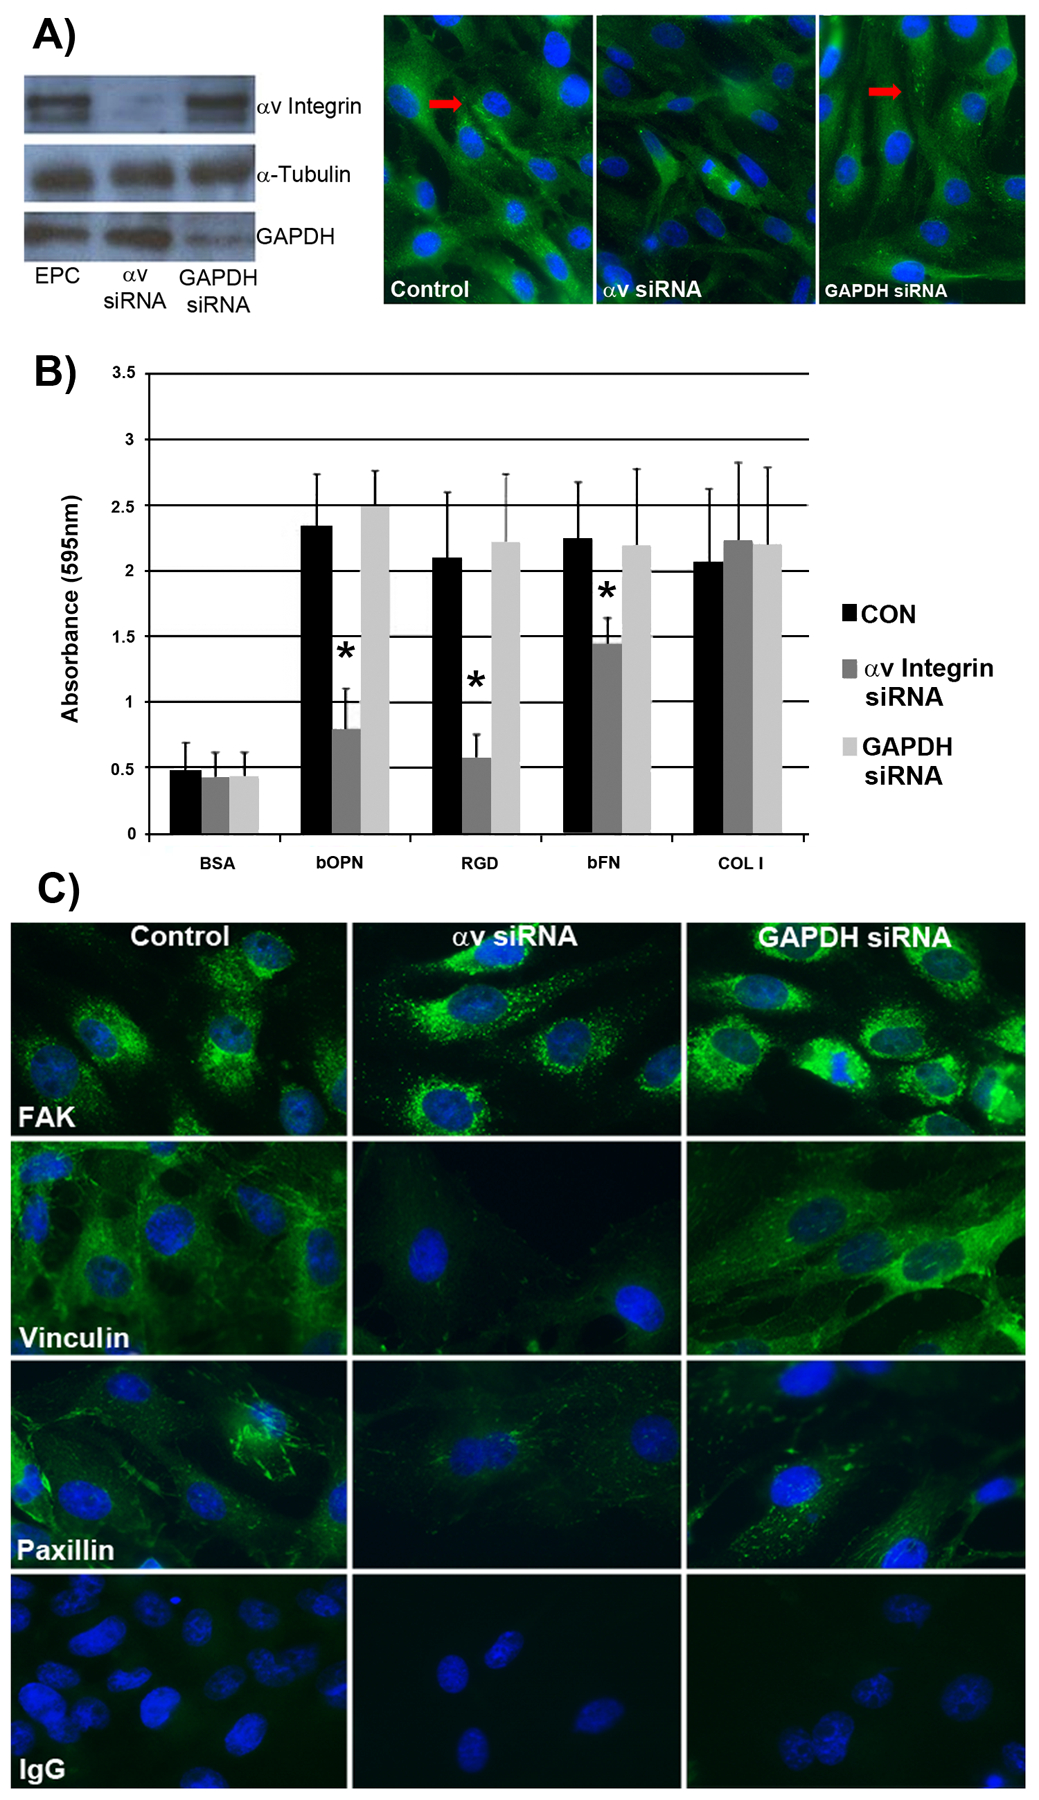
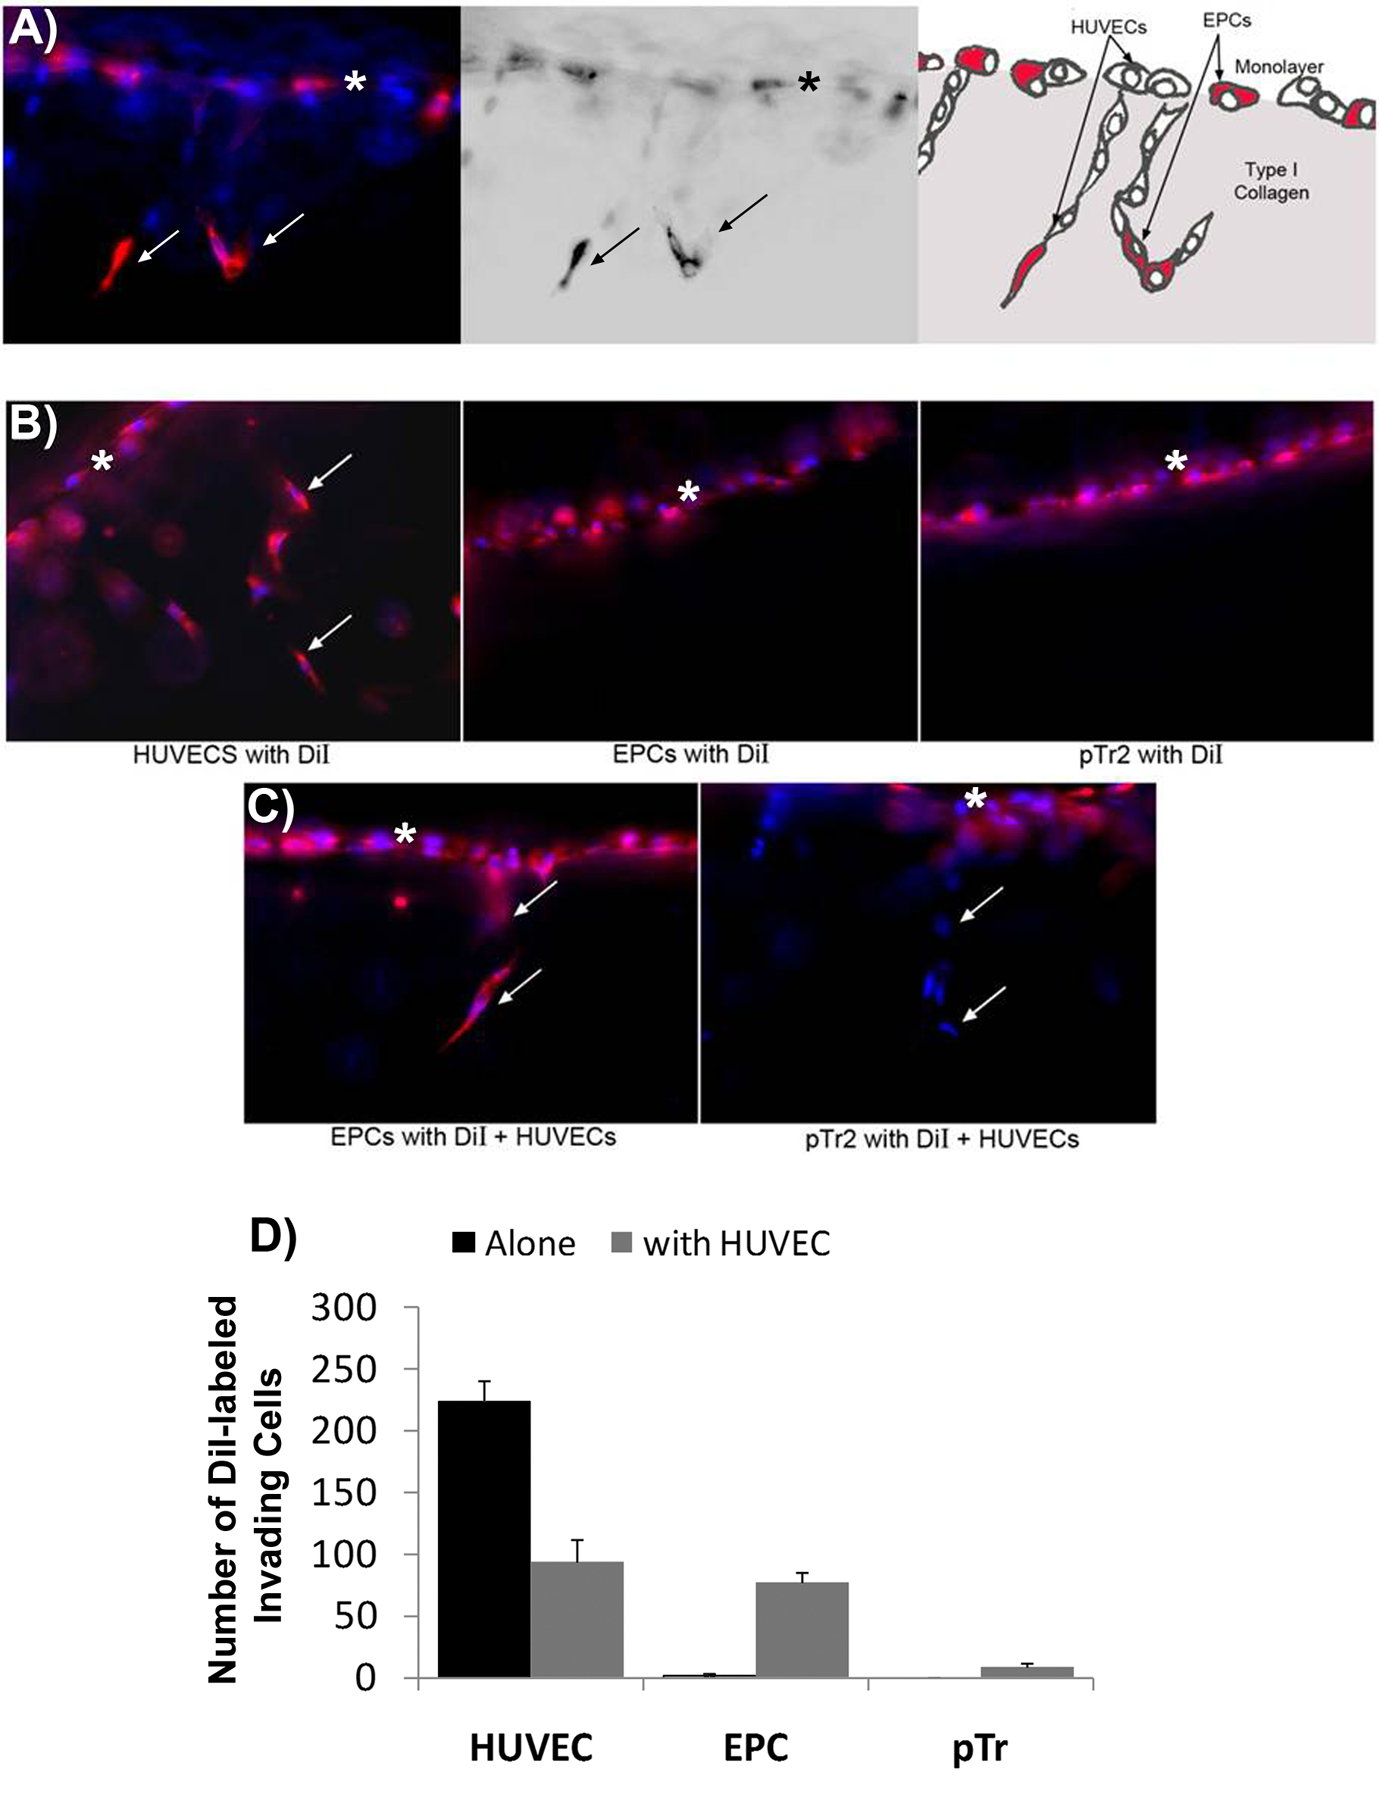
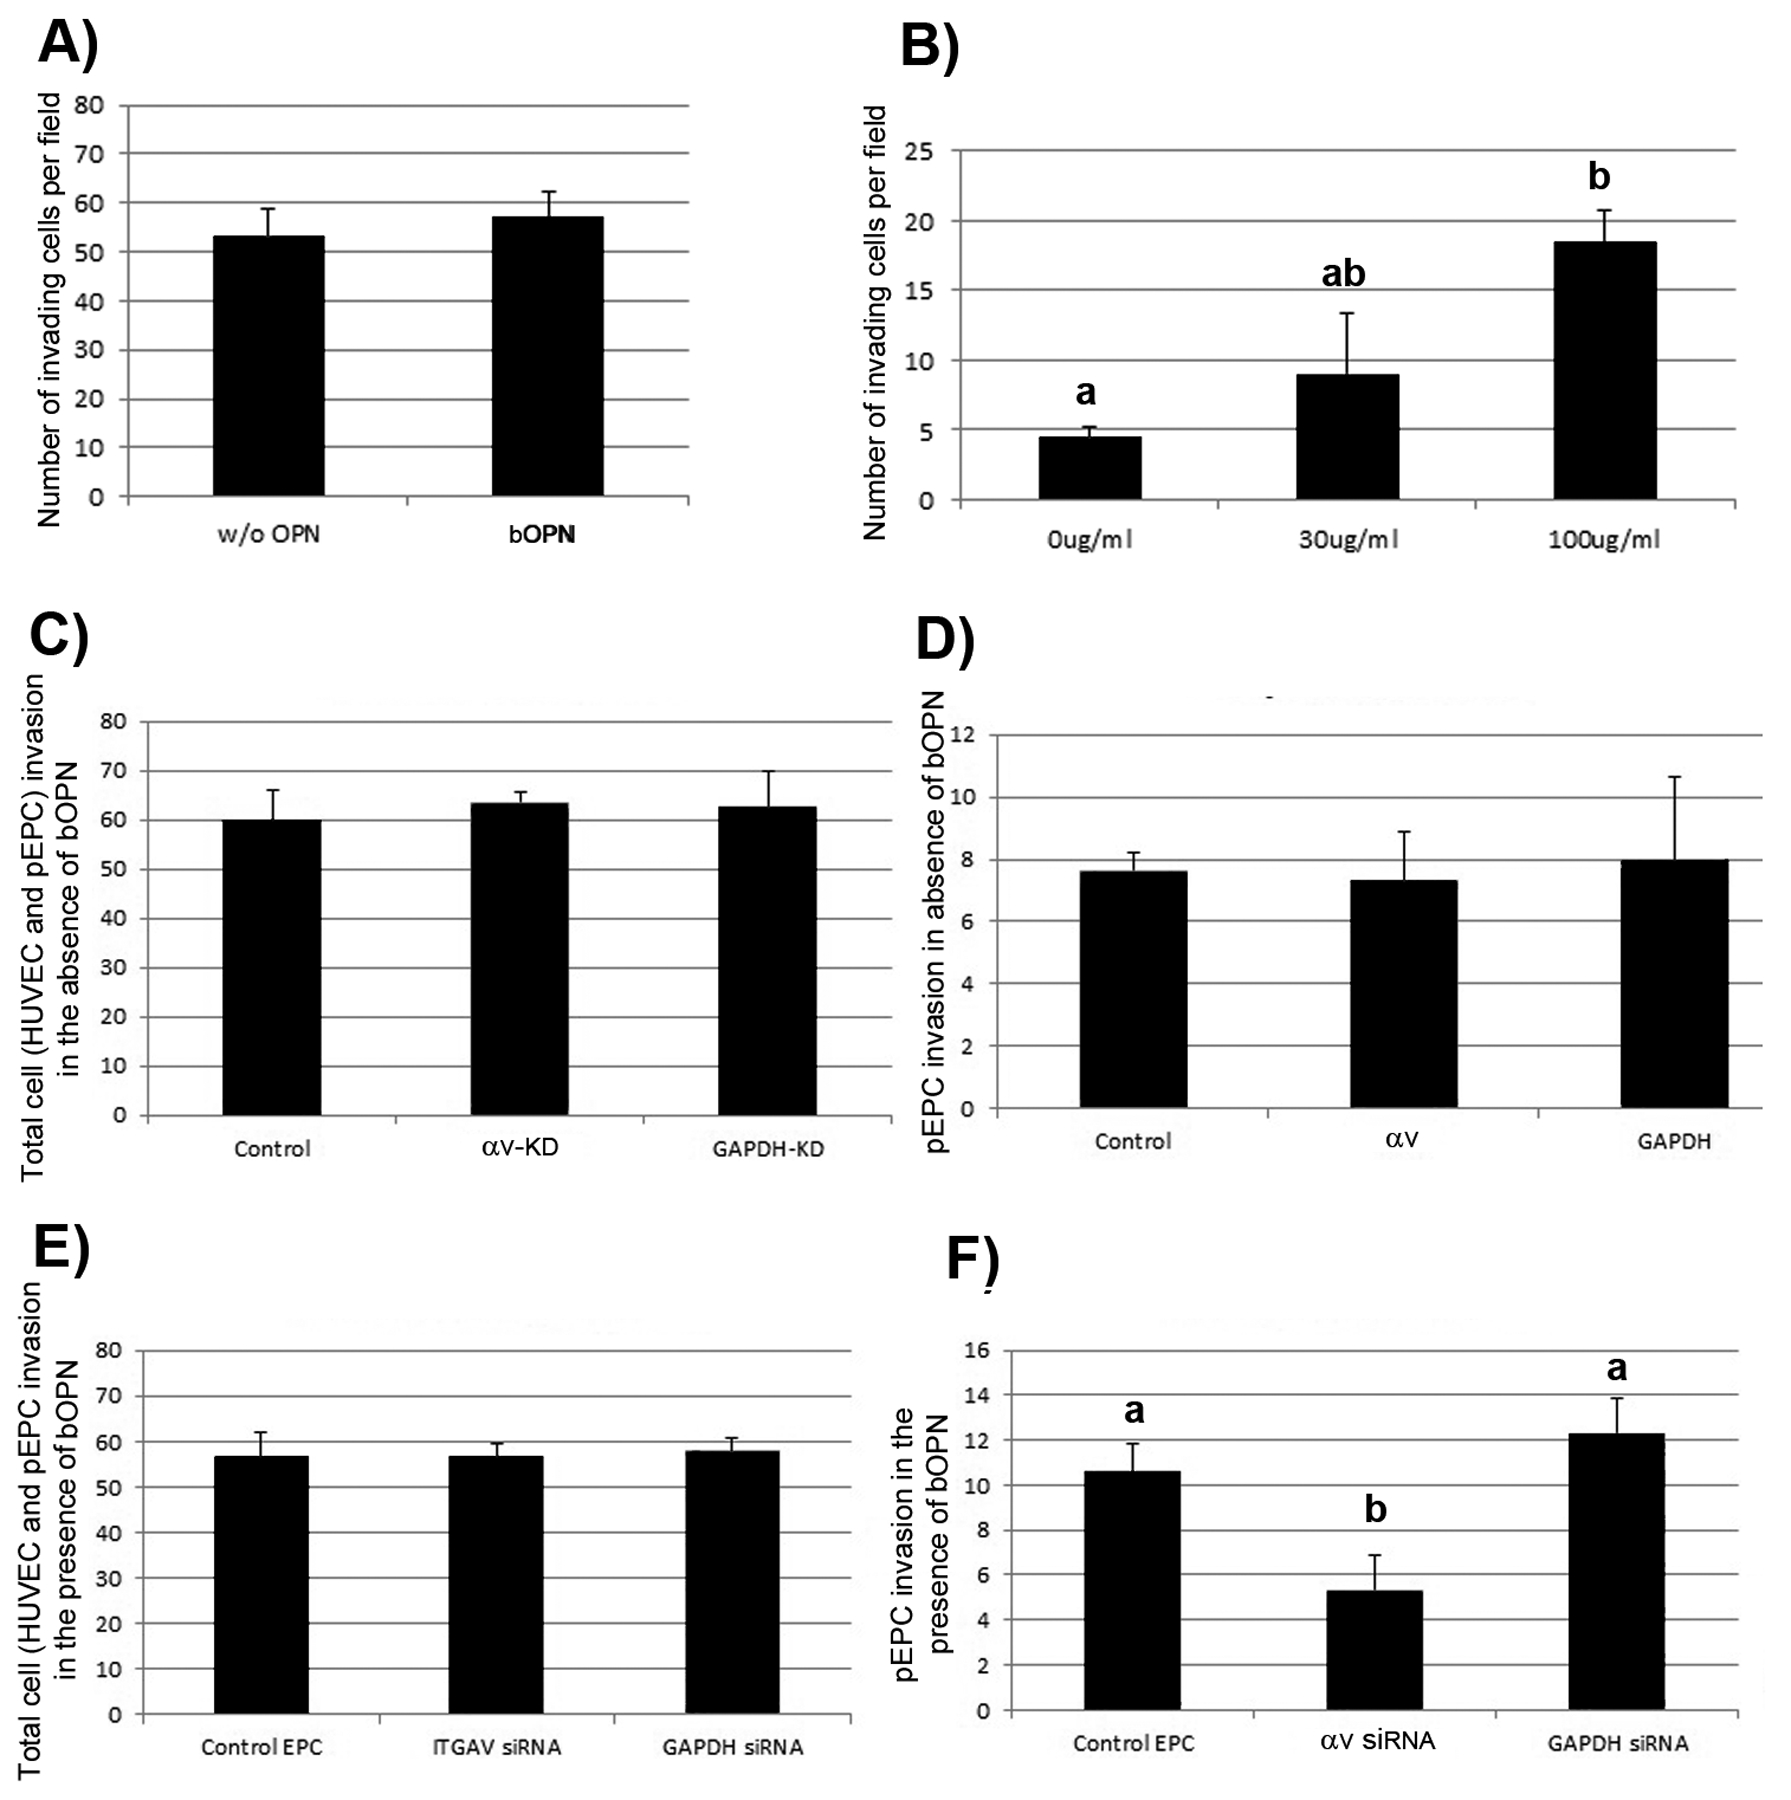
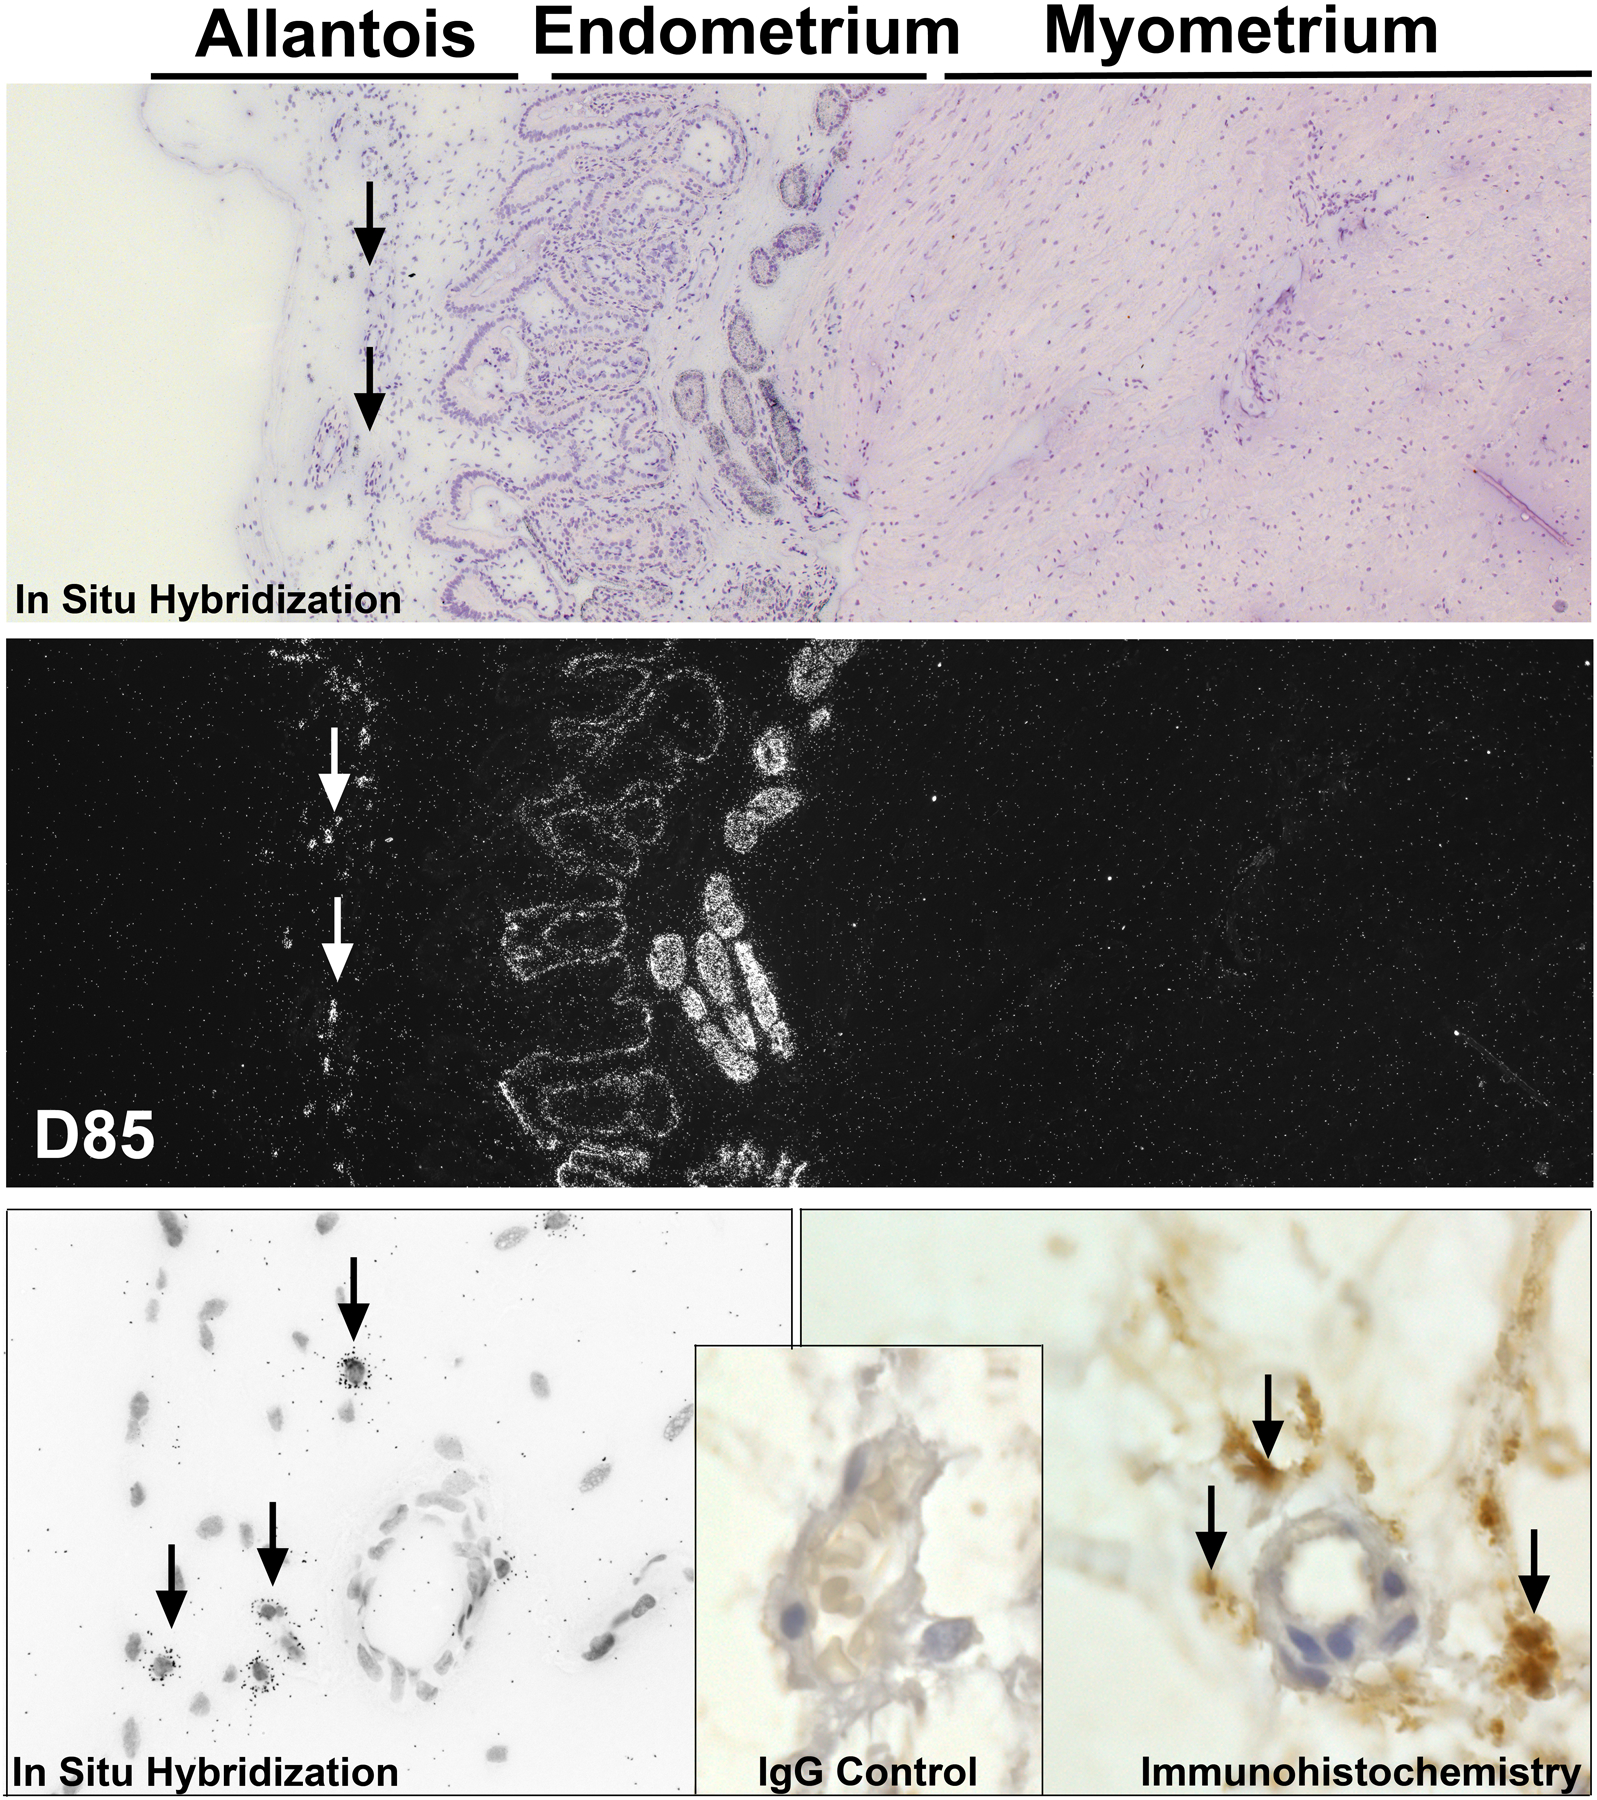
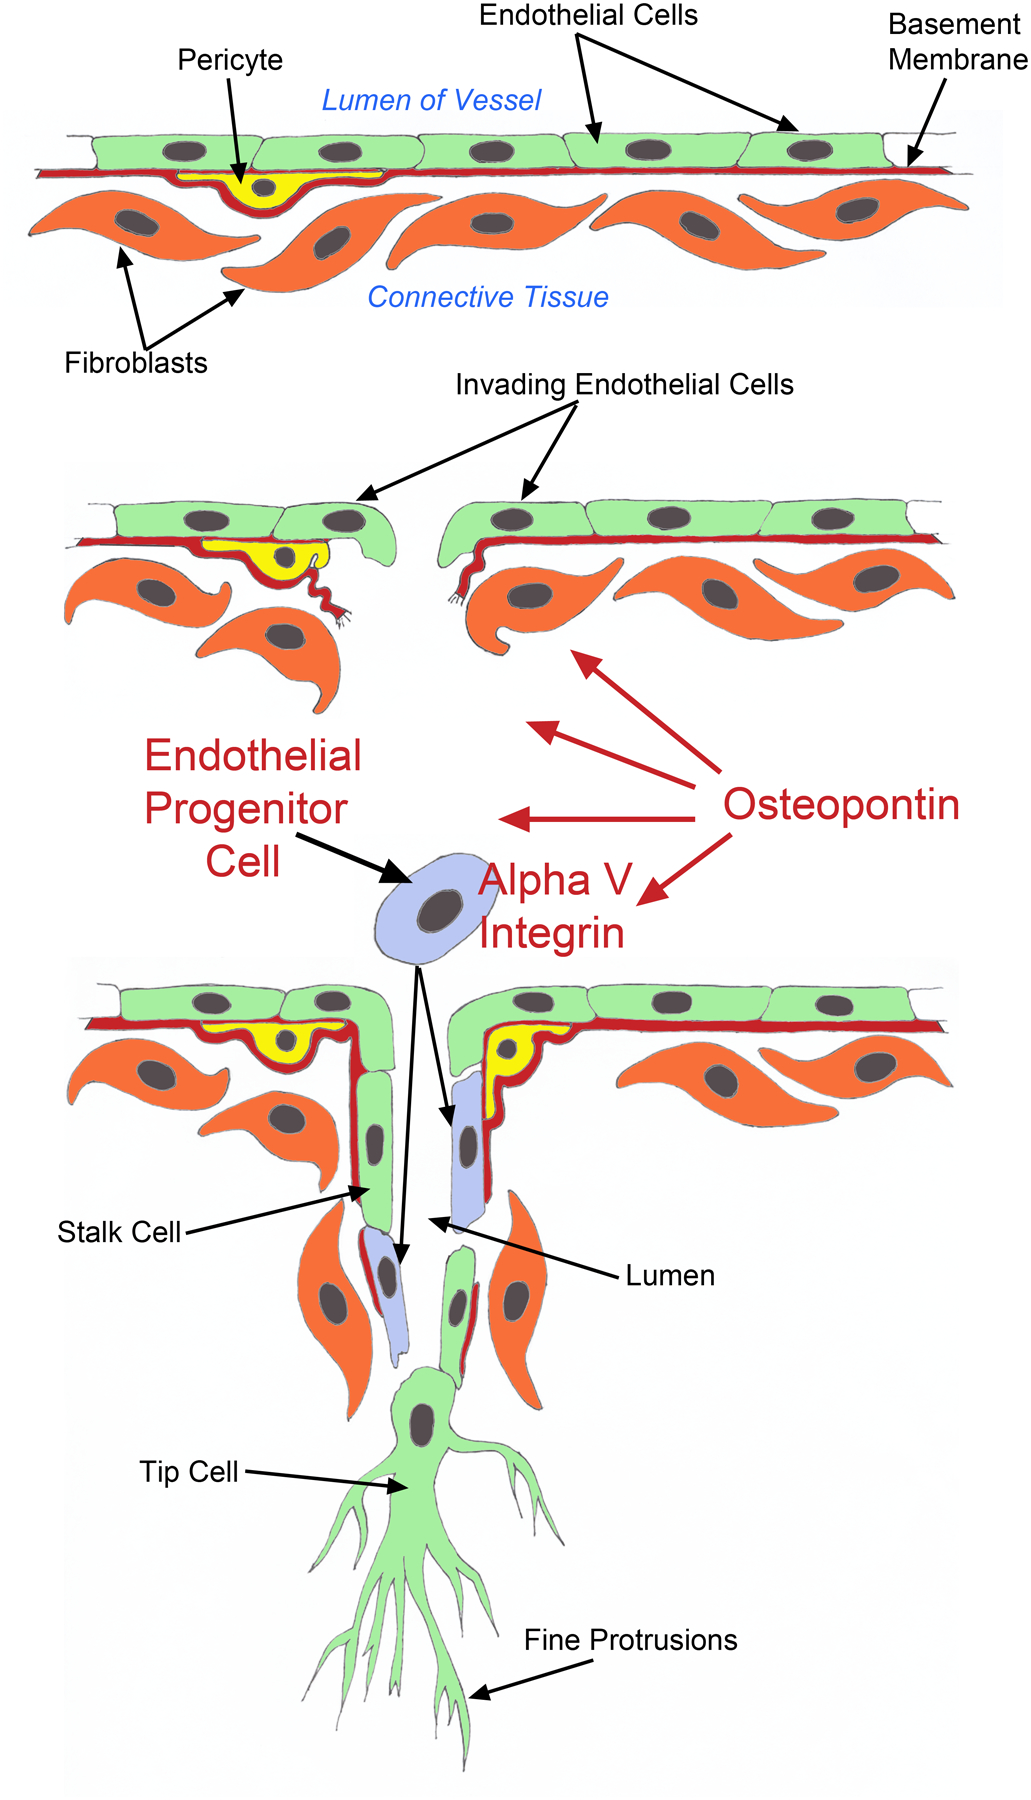
Angiogenesis is fundamental to the expansion of the placental vasculature during pregnancy. Integrins are associated with vascular formation; and osteopontin is a candidate ligand for integrins to promote angiogenesis. Endothelial progenitor cells (EPCs) are released from bone marrow into the blood and incorporate into newly vascularized tissue where they differentiate into mature endothelium. Results of studies in women suggest that EPCs may play an important role in maintaining placental vascular integrity during pregnancy, although little is known about how EPCs are recruited to these tissues. Our goal was to determine the αv integrin mediated effects of osteopontin on EPC adhesion and incorporation into angiogenic vascular networks. EPCs were isolated from 6 h old piglets. RT-PCR revealed that EPCs initially had a monocyte-like phenotype in culture that became more endothelial-like with cell passage. Immunofluorescence microscopy confirmed that the EPCs express platelet endothelial cell adhesion molecule, vascular endothelial cadherin, and von Willebrand factor. When EPCs were cultured on OPN-coated slides, the αv integrin subunit was observed in focal adhesions at the basal surface of EPCs. Silencing of αv integrin reduced EPC binding to OPN and focal adhesion assembly. In vitro siRNA knockdown in EPCs,demonstrated that OPN stimulates EPC incorporation into human umbilical vein endothelial cell (HUVEC) networks via αv-containing integrins. Finally, in situ hybridization and immunohistochemistry localized osteopontin near placental blood vessels. In summary, OPN binds the αv integrin subunit on EPCs to support EPC adhesion and increase EPC incorporation into angiogenic vascular networks.


Conflict of interest statement

Declaration of Interest

There is no conflict of interest that could be perceived as prejudicing the impartiality of the research reported. Greg Johnson is on the editorial board of Reproduction. Greg. Johnson was not involved in the review or editorial process for this paper, on which he/she is listed as an author.

Figures

Figure 1.
Figure 1.
Cultured pEPCs have an endothelial cell phenotype. A) Differential interference contrast (DIC) imaging and immunofluorescence staining demonstrate a cobblestone morphology, expression of VE-cadherin (VE-CAD) and PECAM-1 (PECAM) proteins at the junctions between cells, and vWF in Weibel-Palade bodies (passage 22). Non-relevant rabbit immunoglobulin (rIgG) was used as a negative control (width of field for the DIC image = 540 μm, and fluorescence images = 140μm). B) RT-PCR demonstrates that expression of CD31, VEGFR2, and CDH5 increased from passage 1 to passage 16, while expression of CD14 and CD45 decreased with passage. Expression of CD133 was not detected (data not shown) and CD34 remained constant across passages. Collagen, COL; FN, Fibronectin; P, Passage.
Figure 2.
Figure 2.
A) Integrin expression by pEPCs. RT-PCR analyses of integrin subunits expressed in pEPCs from passage 22. A band indicates the presence of a particular integrin subunit. B) Alpha v integrin on EPCs directly binds to OPN. Top panel: pEPCs were surface-labeled with biotin. detergent extracts of the cells mixed with OPN-Sepharose, integrins bound to OPN eluted with EDTA, and wash (W) and EDTA eluates (E1–E8) separated by SDS-PAGE. Bottom panel: Immunoprecipitation of pooled EDTA eluates (E2–E4) was performed using Protein A-Sepharose and antibodies directed to the indicated integrin subunits. Samples were separated by SDS-PAGE under non-reducing conditions. C) Immunofluorescence staining of pEPCs cultured on OPN using antisera directed to the αv integrin subunit shows aggregates of immunoreactive αv integrin at the base of the cells suggesting the assembly of focal adhesions (width of field = 140 μm).
Figure 3.
Figure 3.
Porcine EPCs dose-dependently bind to recombinant rat OPN in an RGD-dependent manner. Adhesion assays were conducted with recombinant rat OPN containing an intact integrin binding sequence (RGD) or, rat OPN with a mutated integrin binding sequence (RAD). Porcine EPCs dose-dependently bound to recombinant rat OPN containing an RGD sequence, but not the mutated RAD control, indicating a dependence on the RGD sequence to promote pEPC attachment to OPN. Values represent average absorbance readings of adhered cells stained with Amido black (595 nm; 3 wells/data point).
Figure 4.
Figure 4.
Silencing of αv integrin in pEPCs using siRNA demonstrates that αv is required for pEPC attachment to OPN to form focal adhesions. A) Left panel: Western blots confirming successful knockdown of αv integrin and GAPDH by their respective siRNA targeting sequences. Right panel: Immunofluorescence staining for αv integrin showing αv integrin knockdown, but not GAPDH knockdown, decreases focal adhesion assembly as pEPCs bind to OPN in culture. The arrows represent punctate immunostaining for the signals representing focal adhesion formation at the base of pEPCs (width of field = 140 μm). B) Adhesion assays were conducted with bovine OPN (bOPN), recombinant rat OPN with an intact RGD sequence (RGD), bovine fibronectin (bFN), and type I collagen (COL I). Adherent cells were fixed, stained with Amido black, and quantified. Bovine serum albumin (BSA) served as a negative control and Type I collagen served as a positive control. Values represent absorbance readings (595 nm; 3×3 wells/data point). C) Immunofluorescence staining of control (non-treated) pEPCs, and pEPCs treated with αv or GAPDH siRNAs (75 nM, 48 h transfection) demonstrate that silencing of αv integrin reduces vinculin and paxillin incorporation into focal adhesions as pEPCs attach to the underlying matrix. A nonrelevant immunoglobulin IgG (width of field = 140 μm).
Figure. 5.
Figure. 5.
Porcine EPCs incorporate into sprouting HUVEC networks. DiI-labeled HUVECs, pEPCs or porcine trophectoderm (pTr) cells were allowed to invade into type I collagen gels and vertical sections of the gels were photographed from the side. Arrows indicate DiI-labeled cells invading beneath the monolayer (*). A) Schematic representation of DiI-labeled pEPCs that have incorporated into sprouting HUVEC (DAPI-labeled) networks. Note the mixture of DiI-labeled EPCs (pink) and non-labeled HUVECs (blue) present in the initial monolayer culture. Also note the presence of both blue and pink cells within the underlying collagen indicating in vitro cell invasion to form vascular structures. B) HUVECs cultured alone invade into type I collagen gels, whereas pEPCs (EPC) or pTr2 cells cultured alone do not invade. C) Porcine EPCs invade into type I collagen gels when cultured with HUVECs, but co-culture with HUVECs does not affect pTr2 cell invasion. D) Quantification of pEPC invasion into collagen matrices. The x axis denotes the cell type that is labeled with DiI. The y axis denotes the number of labeled invading cells when no unlabeled HUVECs are included in the culture (blue bars) or the number of labeled invading cells if unlabeled HUVECs are included in the culture (orange bars). Note that labeled EPCs do not invade unless accompanied in culture by unlabeled HUVECs. Also note that if all HUVECs are labeled with DiI (HUVEC, blue bar), then more labeled cells invade than if both labeled and unlabeled HUVECs (HUVEC, orange bar) are added to the culture. The number of DiI labeled invading cells was quantified from experiments shown in panels B and C. Three fields from each treatment group were used to obtain average number of invading cells per 1mm2 field (+/− SD). Data shown are representative of n=4 experiments.
Figure 6.
Figure 6.
OPN increases incorporation of pEPCs into sprouting HUVEC networks. A): DiI labeled HUVECs were allowed to invade in the presence of 0 μg/ml (w/o bOPN) or 100 μg/ml bOPN. B): unlabeled HUVECs were seeded along with DiI labeled pEPCs onto collagen gels, and soluble bOPN was added to culture medium in the bottom chamber at the concentrations indicated. Cultures were fixed, stained with DAPI, and the number of invading HUVEC (left panel) and pEPCs (right panel) was quantified. Four fields from each treatment group were used to obtain average number of invading cells per 1 mm2 field (+/− SD). Data shown are representative of 4 independent experiments (bars that are significantly different do not share the same letter). C-D) Alpha v integrin knockdown does not affect HUVEC and/or pEPC invasion in the absence of bOPN. DiI-labeled EPCs expressing no siRNA (Control) or siRNA directed to αv integrin (αv--KD) or GAPDH (GAPDH-KD) were co-cultured on the surface of collagen gels C): Total cell (HUVEC and pEPC) invasion in the absence of bOPN. D): pEPC invasion in the absence of bOPN. Four fields from each treatment group were used to obtain average number of invading cells per 1 mm2 field (+/− SD). Each experiment was performed in triplicate (p=0.10). E-F) bOPN requires αv integrin expressed on pEPCs to increase incorporation of pEPCs into sprouting HUVEC networks. DiI-labeled pEPCs expressing no siRNA (Control) or siRNA directed to αv integrin (αV-KD) or GAPDH (GAPDH-KD) were co-cultured in the presence of 100μg/ml soluble bOPN added to the culture medium in the bottom chamber. E): Total cell (HUVEC and pEPC) invasion in the presence of bOPN. F): pEPC invasion in the presence of bOPN. Four fields from each treatment group per experiment were used to obtain average number of invading cells per 1 mm2 field (+/− SD). Data shown represent 3 independent experiments (P<0.05).
Figure 7.
Figure 7.
OPN accumulates in the ECM around the placental vasculature. Localization of OPN mRNA, top panels (Corresponding brightfield and darkfield images from in situ hybridization) and bottom left panel (brightfield image at higher magnification), and localization of OPN protein by immunohistochemistry, bottom right panel. Arrows indicate OPN mRNA within cells or OPN protein in the ECM of the mesenchyme of the allantois.
Figure 8.
Figure 8.
OPN in the ECM surrounding placental blood vessels binds to αv integrin on circulating EPCs to stimulate EPC incorporation into the growing vasculature.

References

    1. Apparao KB, Illera MJ, Beyler SA, Olson GE, Osteen KG, Corjay MH, Boggess K & Lessey BA 2003. Regulated expression of osteopontin in the peri-implantation rabbit uterus. Biol Reprod 68:1484–1490. - PubMed
    1. Apte U, Banerjee B, McRee R, Wellberg E &Ramaiah S 2005. Role of Osteopontin in Hepatic Neutrophil Infiltration During Alcoholic Steatohepatitis. Toxicol Appl Pharmacol 207 25–38. - PubMed
    1. Asahara T, Murohara T, Sullivan A, Silver M, Van DerZee R, Li T, Witxenbichler B, Schatteman G & Isner JM 1997. Isolation of putative progenitor endothelial cells for angiogenesis. Science 275 964–967. - PubMed
    1. Asahara T, Masuda H, Takahashi T, Kalka C, Pastore C, Silver M, Kearne M, Magner M & Isner JM 1999. Bone marrow origin of endothelial progenitor cells responsible for postnatal vasculogenesis in physiological and pathological neovascularization. Circ Res 85 221–228. - PubMed
    1. Barker D 2004. Developmental Origins of Adult Health and Disease. J Epidemiol Community Health 58 114–115. - PMC - PubMed

Publication types