. 2020 Feb 27;5(4):e133042.
doi: 10.1172/jci.insight.133042.

Pneumonia recovery reprograms the alveolar macrophage pool

Affiliations

Pneumonia recovery reprograms the alveolar macrophage pool

Antoine Guillon et al. JCI Insight. .

Abstract

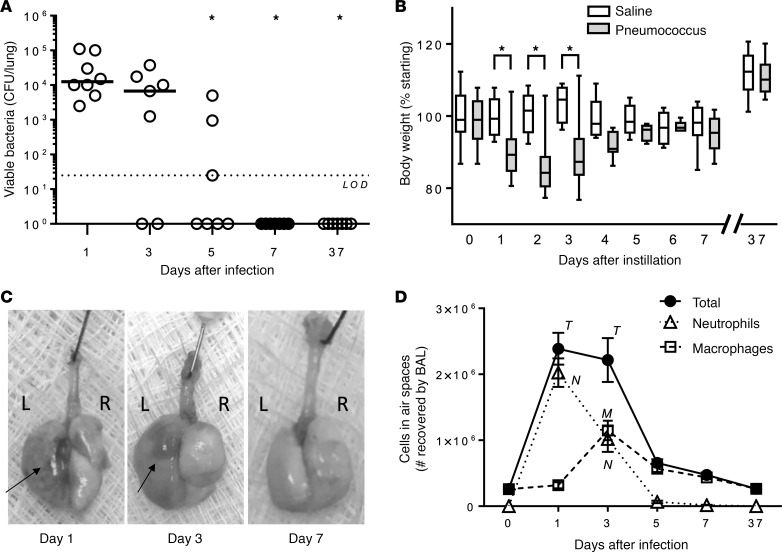
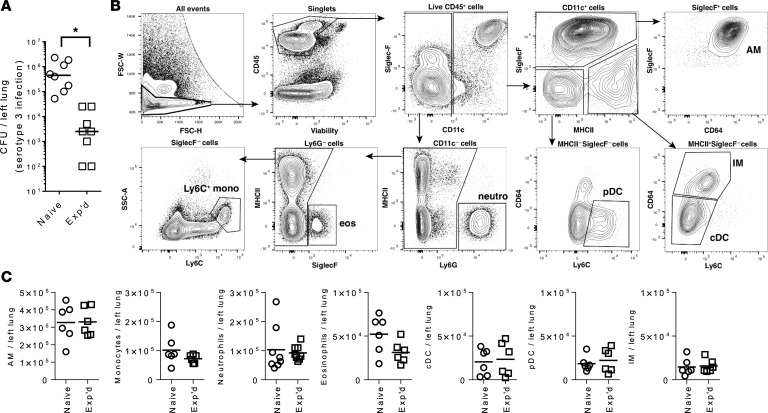
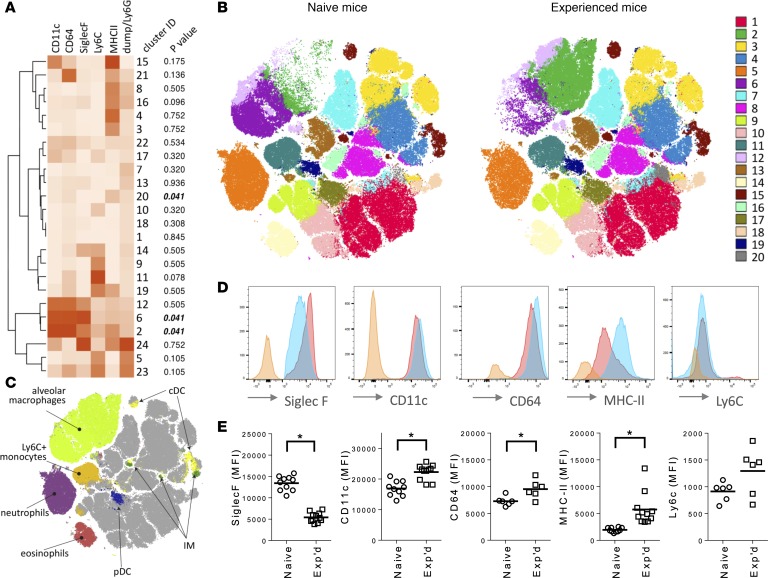
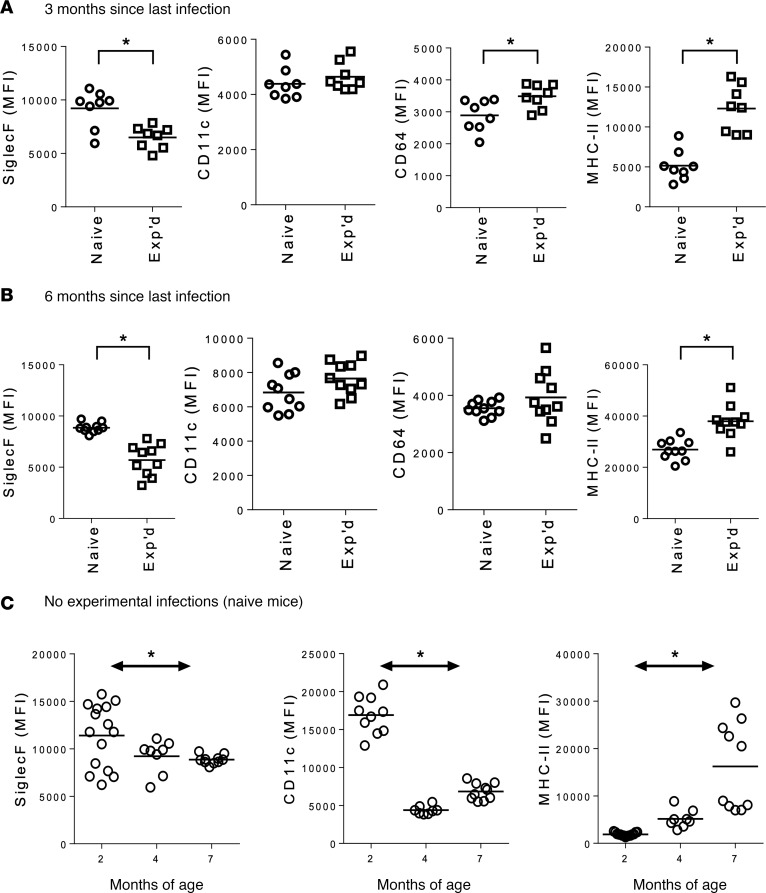
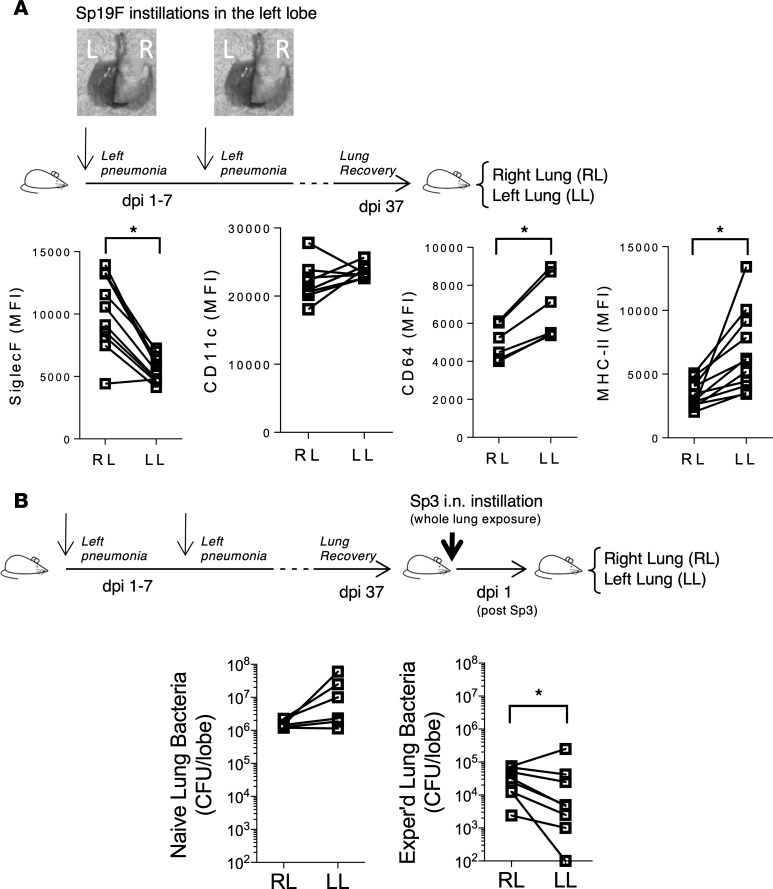
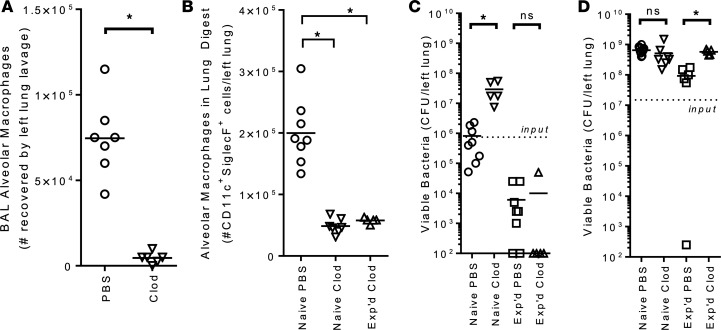
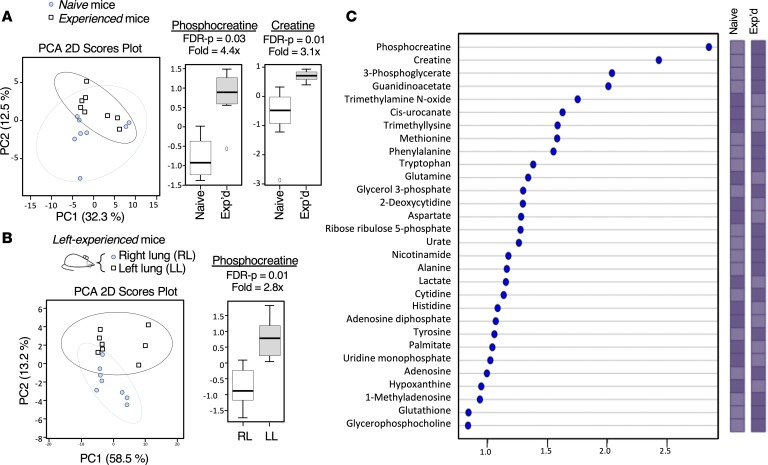
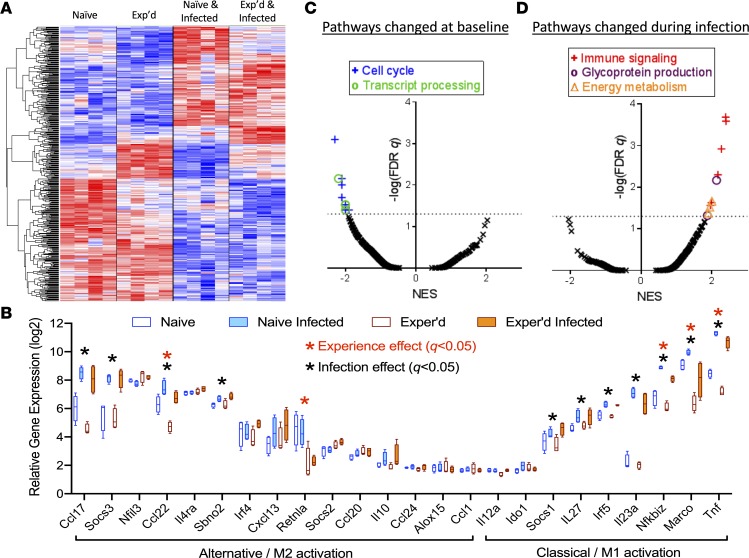
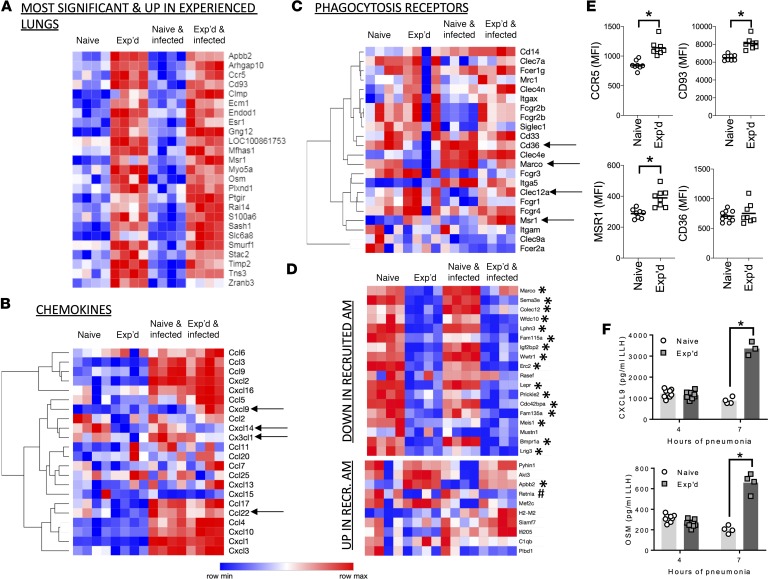
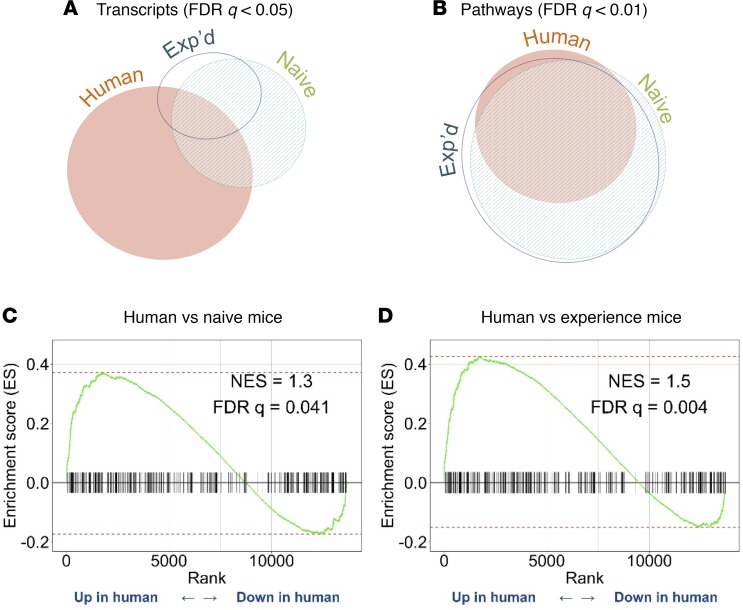
Community-acquired pneumonia is a widespread disease with significant morbidity and mortality. Alveolar macrophages are tissue-resident lung cells that play a crucial role in innate immunity against bacteria that cause pneumonia. We hypothesized that alveolar macrophages display adaptive characteristics after resolution of bacterial pneumonia. We studied mice 1 to 6 months after self-limiting lung infections with Streptococcus pneumoniae, the most common cause of bacterial pneumonia. Alveolar macrophages, but not other myeloid cells, recovered from the lung showed long-term modifications of their surface marker phenotype. The remodeling of alveolar macrophages was (a) long-lasting (still observed 6 months after infection), (b) regionally localized (observed only in the affected lobe after lobar pneumonia), and (c) associated with macrophage-dependent enhanced protection against another pneumococcal serotype. Metabolomic and transcriptomic profiling revealed that alveolar macrophages of mice that recovered from pneumonia had new baseline activities and altered responses to infection that better resembled those of adult humans. The enhanced lung protection after mild and self-limiting bacterial respiratory infections includes a profound remodeling of the alveolar macrophage pool that is long-lasting; compartmentalized; and manifest across surface receptors, metabolites, and both resting and stimulated transcriptomes.

Keywords: Bacterial infections; Innate immunity; Macrophages; Pulmonology.


Conflict of interest statement

Conflict of interest: The authors have declared that no conflict of interest exists.

Figures

Figure 1
Figure 1. Murine model of self-limiting pneumonia.
To determine effects of acute pneumonia, mice were infected with 106 CFU of serotype 19F instilled into the left lung lobe on day 0. To establish heterotypic immune protection, mice received a second infection with 106 CFU of serotype 19F instilled into the left lung lobe on day 7 and then were rested for 30 more days before lungs were examined. Sterile saline was used as control. Infected mice and controls were compared for (A) bacterial burden, (B) body weight, (C) gross morphology of lungs, and (D) leukocyte count in BAL, enumerated using a LUNA automated cell counter followed by a differential determined morphologically from cytocentrifuge preparations of BAL cells. In A, every individual symbol represents a single mouse, with horizontal lines showing median values for the group, and asterisks (*) indicate statistically significant (P < 0.05) differences from day 1 values using the Kruskal-Wallis test and Dunn’s post hoc multiple-comparisons test. In B, box and whisker plots show median, quartiles, and range, with asterisks (*) indicating significance (P < 0.05) of difference between saline and pneumococcus groups as determined using 2-way ANOVA and Holm-Šídák post hoc multiple-comparisons tests. In D, summary data show mean and SEM, with significance (P < 0.05) of difference from day 0 determined using 2-way ANOVA and Holm-Šídák post hoc multiple-comparisons test and communicated with letters representing cell type (T, total; N, neutrophils; M, macrophages). For B and D, pooled data represent a total n of 5–12 mice per group. For all, 2 independent experiments were performed. LOD, limit of detection.
Figure 2
Figure 2. Immunophenotyping of lung myeloid cells 1 month after recovery from mild pneumonia.
(A) Defense against a serotype 3 pneumococcal pneumonia in naive mice and experienced (Exp’d) mice with a history of serotype 19F pneumococcal infections as described in Figure 1. Naive or experienced mice were infected intranasally (i.n.) with 0.5 × 10⁶ to 1 × 10⁶ CFU, and lung bacterial burdens were determined after 24 hours of infection. Asterisk (*) indicates statistically significant (P < 0.05) difference between groups using Mann-Whitney U test. For B and C, mice received intratracheally (i.t.) left lobe serotype 19F infections (Exp’d) or saline instillations (Naive) on days 0 and 7, before left lung lobes were collected at day 37 with no further infections. (B) Gating strategy for myeloid cells in lung single-cell suspensions. Cells were isolated from enzymatically digested mouse lungs, and after the exclusion of doublets, debris, and dead cells, immune cells were identified by CD45 staining. Sequential gating strategy was used to identify myeloid cell subsets. Representative sample from the naive group is shown. (C) Absolute cell counts of identified myeloid cell subsets were obtained and compared. Numbers per mouse were plotted for each cell type, with data collected over 2 independent experiments and each data point representing an individual animal. Groups were compared using 2-tailed Student’s t test, and naive and experienced mice did not significantly differ for any cell type. AM, alveolar macrophages; cDC, conventional dendritic cells; eos, eosinophils; IM, interstitial macrophages; monos, monocytes; neutro, neutrophils; pDC, plasmacytoid dendritic cells.
Figure 3
Figure 3. Myeloid cell subsets differentiating experienced mice from naive mice.
For A–C, a flow cytometry data set containing equal numbers of live single-cell CD45+ events from left lung lobes of n = 6 mice in each of the 2 groups (naive or experienced) was phenotyped for relative surface expression of myeloid cell markers CD11c, CD64, Ly6C, Ly6G, MHC II, and SiglecF. (A) Leukocyte subsets in the lungs of naive and experienced mice. Unsupervised clustering of 24 cell subsets (numbered according to cell quantity) was generated using the PhenoGraph algorithm, with heatmap color intensity representing median surface expression for each marker across the entire data set including all cells from all mice. The Wilcoxon rank-sum test with Benjamini-Hochberg multiple-comparisons adjustments was used to compare relative numbers of events (cells) within each cluster between naive and experienced mice, with the FDR-adjusted P value shown for each cluster. (B) Distributions of leukocyte phenotypes in the lungs of naive and experienced mice. The 20 most abundant PhenoGraph clusters based on multidimensional single-cell data (A) were color-coded and plotted on a 2-dimensional (2D) graph using the opt-SNE algorithm for naive and experienced mice. Opt-SNE 2D coordinates are shown on x and y axes. (C) Distributions of manually gated myeloid cells on the opt-SNE map. Myeloid cell-types were binned as in Figure 2 based on expression levels of the surface markers of interest. (D) Expression of surface markers across alveolar macrophages from the lungs of naive or experienced mice, depicted as a representative histogram from a single naive (red) or experienced (blue) mouse. Orange histogram represents matched fluorescence minus one negative control. (E) Comparisons of individual surface markers on alveolar macrophages between naive and experienced mice. MFI values per mouse were plotted for each surface marker, with data collected over 2–3 independent experiments and each data point representing an individual animal and horizontal lines representing group means. Asterisks (*) indicate comparisons reaching statistical significance (P < 0.05) using unpaired 2-tailed Student’s t tests.
Figure 4
Figure 4. Effects of time on the remodeling of alveolar macrophage surface markers.
Alveolar macrophages from lung single-cell suspensions of naive and experienced mice were gated as described in Figure 2, and MFI of surface markers was shown for lungs collected (A) 3 months or (B) 6 months after i.t. instillations of serotype 19F pneumococcus (for the experienced mice) or sterile saline (for naive). Data in A and in B were each collected across 2 independent experiments, and asterisks (*) represent comparisons reaching statistical significance (P < 0.05) using unpaired 2-tailed Student’s t tests. (C) To determine effects of age in the absence of experimental infection, alveolar macrophages from lung single-cell suspensions were collected from naive mice of varying ages, as indicated. Data from C were from a single experiment, and asterisk (*) represents statistically significant (P < 0.05) effects of age using 1-way ANOVA. For all panels, each individual dot represents a single mouse, with horizontal lines representing group means.
Figure 5
Figure 5. Regional localization of alveolar macrophage remodeling.
(A) Mice were infected with 2 doses of 1 × 10⁶ to 3 × 10⁶ CFU of serotype 19F pneumococcus, with 1-week intervals between infections, and then rested at least 1 month. To generate the initial selective left lung infections, an angiocatheter was placed into the left bronchus through a tracheostomy to administer bacteria or sterile saline. Right and left lungs were harvested separately to generate single-cell suspensions. Surface marker MFI on alveolar macrophages (gated as in Figure 2) from right lobe (RL) and left lobe (LL) were compared within each mouse. Each pair of connected dots represents a single mouse. (B) A month after serotype 19F pneumococcus infections of the left lung lobe, mice were challenged i.n. with 7.5 × 10⁵ CFU serotype 3 pneumococcus. Bacterial burden was assessed after 24 hours in the RL versus LL. Each pair of connected dots represents a single mouse. Data were from 2 (A) or 3 (B) independent experiments. Asterisks (*) indicate comparisons that reached statistical significance (P < 0.05) using the nonparametric 2-tailed sign test.
Figure 6
Figure 6. Alveolar macrophage roles in defending naive and experienced lungs.
(A and B) Liposomal clodronate effectively depleted mouse lungs of alveolar macrophages. Mice received i.n. liposomes that contained either PBS or clodronate (Clod). (A) Alveolar macrophage numbers were assessed using microscopy and cellular morphology with BAL samples from naive mice. Every individual symbol represents a single mouse, with horizontal lines showing the mean for the group. Asterisk (*) represents a significant (P < 0.05) difference using unpaired 2-tailed Student’s t test. Results include data pooled from 2 independent experiments. (B) Alveolar macrophage numbers were assessed using flow cytometry and surface marker characteristics with lung single-cell suspensions from naive or experienced mice. Every individual symbol represents a single mouse, with horizontal lines showing the mean for the group. Asterisks (*) represent significant (P < 0.05) differences from the naive PBS group using 1-way ANOVA and Holm-Šídák post hoc multiple-comparisons tests. Results include data from 2 independent experiments. (C and D) Naive or experienced mice received i.n. liposomes that contained either PBS or clodronate 72 hours prior to i.n. infections with either (C) a medium dose (0.75 × 10⁶ CFU) or (D) a high dose (15 × 106 CFU) of serotype 3 pneumococcus. Infecting dose is depicted on graphs with a dotted line. Lung bacterial burdens were determined 24 hours after infection. Every individual symbol represents a single mouse, with horizontal lines showing mean for the group. Asterisks (*) indicate significant (P < 0.05) effects of clodronate using 2-way ANOVA on log-transformed data and Holm-Šídák post hoc multiple-comparisons tests (ns, not significant). Results include data from 3 independent experiments for each bacterial dose.
Figure 7
Figure 7. Altered metabolomes of alveolar macrophages after resolution of pneumococcal infections.
(A) Score plot of PCA performed on the LC/MS data of alveolar macrophages lavaged from whole lungs of naive (circle) and experienced (square) mice. The explained variances are shown in parentheses. (B) Score plot of PCA performed on the LC/MS data of alveolar macrophages lavaged selectively from the right (circle) or left (square) lung lobes of left-experienced mice that recovered from prior lobar pneumonias in the left lobe. The explained variances are shown in parentheses. For A and B, features selected by volcano plot that reached the threshold of 2 times fold change and P < 0.01 by 2-tailed Student’s t tests were represented in box plots, log-transformed and normalized to a constant sum. (C) Metabolites identified by PLS-DA and VIP scores (comparison of metabolomes of alveolar macrophages from naive and experienced mice). Significant contribution was considered if VIP > 1. Colored boxes on the right indicate relative concentrations of the corresponding metabolite (elevated in condition with darker box). Two independent experiments with 4 mice per group were performed (n = 8) for both designs.
Figure 8
Figure 8. Transcriptome remodeling of experienced alveolar macrophages, at rest and during infection.
(A) Hierarchical clustering and heatmap of 443 transcripts differentially expressed with FDR q < 0.05 in alveolar macrophages of experienced and naive mice. Each column represents a mouse and each row a gene. Color-coding indicates directionality (with blue, white, and red showing below-, at-, or above-average expression, respectively). (B) Relative expression of genes associated with “alternative/M2” or “classical/M1” activation states in mouse macrophages (42). Box, line, and whisker for each mRNA represent quartiles, median, and range, respectively, for n = 4 mice per group in the genome-wide transcriptome analyses. (C and D) Plots of reactome pathways resulting from GSEA analyses of the transcriptome profiles of alveolar macrophages from experienced compared with naive lungs, at rest (C) or 4 hours after infection with serotype 3 pneumococcus (D). All pathways that crossed the FDR q < 0.05 threshold were examined (listed in Tables 1 and 2), colored differently from black in the figures, and grouped by manual inspection (as detailed in Tables 1 and 2) into overarching pathways that were communicated in the figures via inset boxes. Normalized enrichment scores (NESs) below 0 indicate pathways decreased in the experienced lungs, while positive NESs indicate pathways increased in experienced lungs.
Figure 9
Figure 9. Transcripts and proteins altered by prior pneumonia experience.
Transcripts were culled from the full data sets of alveolar macrophages from naive or experienced mice with or without acute (4-hour) infections by serotype 3 pneumococcus and presented in AD. (A) The 25 transcripts that increased most significantly due to past history of infections. These had the lowest FDR q values for effect of pneumonia history and were increased rather than decreased in alveolar macrophages of experienced lungs. (B) The chemokine transcripts detected in alveolar macrophages. Arrows indicate FDR q < 0.05 for effect of pneumonia history. (C) The phagocytosis receptor transcripts detected in alveolar macrophages. Arrows indicate FDR q < 0.05 for effect of pneumonia history. (D) Transcripts differentiating recruited versus autochthonous alveolar macrophages in prior studies of replacement after clodronate depletion (19). Asterisks (*) indicate FDR q < 0.05 for effect of pneumonia history, with changes in the direction consistent with monocyte-derived alveolar macrophages in the experienced group, and hashtag (#) indicates FDR q < 0.05 for effect of pneumonia history, with changes in the opposite direction. (E) Surface protein levels of surface markers implicated in transcriptome studies as differing between naive and experienced mice at the mRNA level. MFI values on alveolar macrophages were plotted for each surface marker, with data collected over 2–3 independent experiments, and each data point representing an individual animal, and horizontal lines representing group means. Asterisks (*) indicate comparisons reaching statistical significance (P < 0.05) using unpaired 2-tailed Student’s t tests. (F) Protein levels of soluble cytokines implicated in transcriptome studies as differing between naive and experienced mice at the mRNA level. Concentrations were quantified by ELISA in left lung homogenates (LLH) from naive or experienced mice infected 4 or 7 hours with serotype 3 pneumococcus. Data were collected over 2–3 independent experiments, with each data point representing an individual animal and bars representing group means. Asterisks (*) indicate comparisons reaching statistical significance (P < 0.05) using 2-way ANOVA.
Figure 10
Figure 10. Comparison of mouse and human alveolar macrophage responses to pneumococcal infection.
(A and B) Euler diagrams representing relative sizes and overlap of (A) gene sets or (B) biological pathways that were significantly altered by pneumococcal stimulation of mouse alveolar macrophages that were naive or experienced (data sets collected here) or of human alveolar macrophages from Bewley et al. (40). (C and D) GSEA comparisons of human alveolar macrophage responses to pneumococcus, from Bewley et al. (40), with mouse alveolar macrophage responses to pneumococcus (from data collected here), including alveolar macrophages from mice that were (C) naive or (D) experienced.

Similar articles

Cited by

References

    1. Dickson RP, Erb-Downward JR, Martinez FJ, Huffnagle GB. The microbiome and the respiratory tract. Annu Rev Physiol. 2016;78:481–504. doi: 10.1146/annurev-physiol-021115-105238. - DOI - PMC - PubMed
    1. Quinton LJ, Mizgerd JP. Dynamics of lung defense in pneumonia: resistance, resilience, and remodeling. Annu Rev Physiol. 2015;77:407–430. doi: 10.1146/annurev-physiol-021014-071937. - DOI - PMC - PubMed
    1. Quinton LJ, Walkey AJ, Mizgerd JP. Integrative physiology of pneumonia. Physiol Rev. 2018;98(3):1417–1464. doi: 10.1152/physrev.00032.2017. - DOI - PMC - PubMed
    1. Rudan I, Boschi-Pinto C, Biloglav Z, Mulholland K, Campbell H. Epidemiology and etiology of childhood pneumonia. Bull World Health Organ. 2008;86(5):408–416. doi: 10.2471/BLT.07.048769. - DOI - PMC - PubMed
    1. Yu H, Wier LM, Elixhauser A. Hospital stays for children, 2009: statistical brief #118. In: Healthcare Cost and Utilization Project (HCUP) Statistical Briefs. Rockville, Maryland, USA: Agency for Healthcare Research and Quality; 2011.

Publication types