Randomized Controlled Trial
. 2020 May 1;130(5):2451-2464.
doi: 10.1172/JCI131700.

Cytotoxic CD4+ T lymphocytes may induce endothelial cell apoptosis in systemic sclerosis

Affiliations
Randomized Controlled Trial

Cytotoxic CD4+ T lymphocytes may induce endothelial cell apoptosis in systemic sclerosis

Takashi Maehara et al. J Clin Invest. .

Abstract

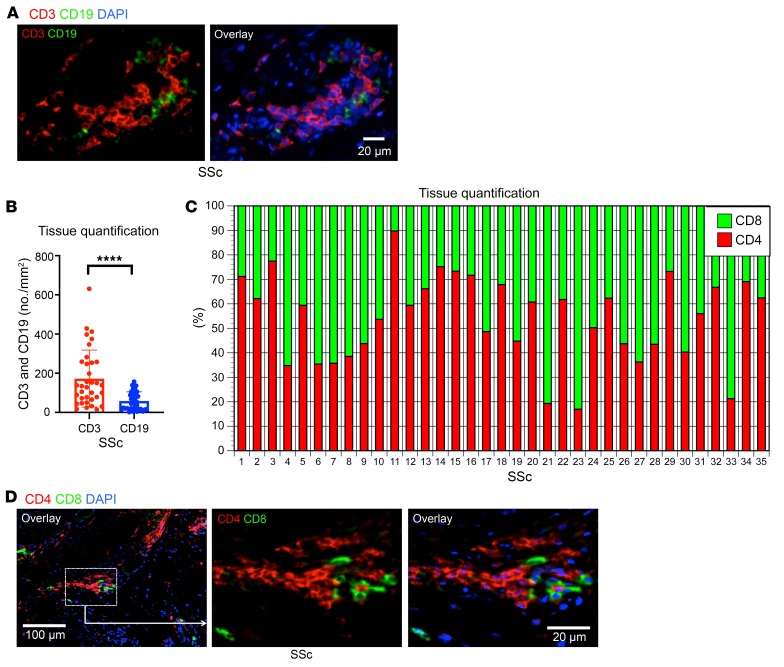
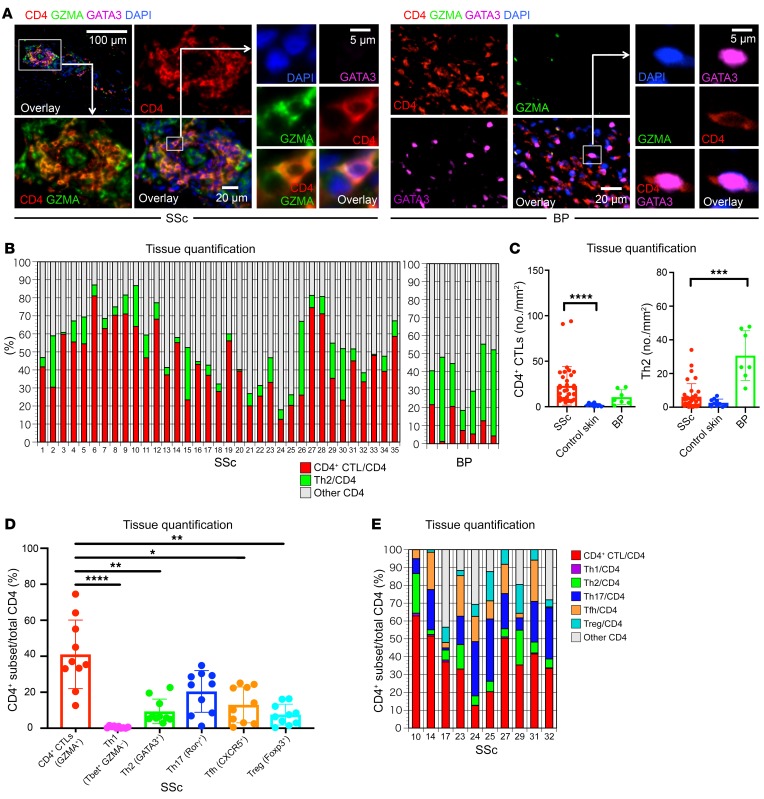
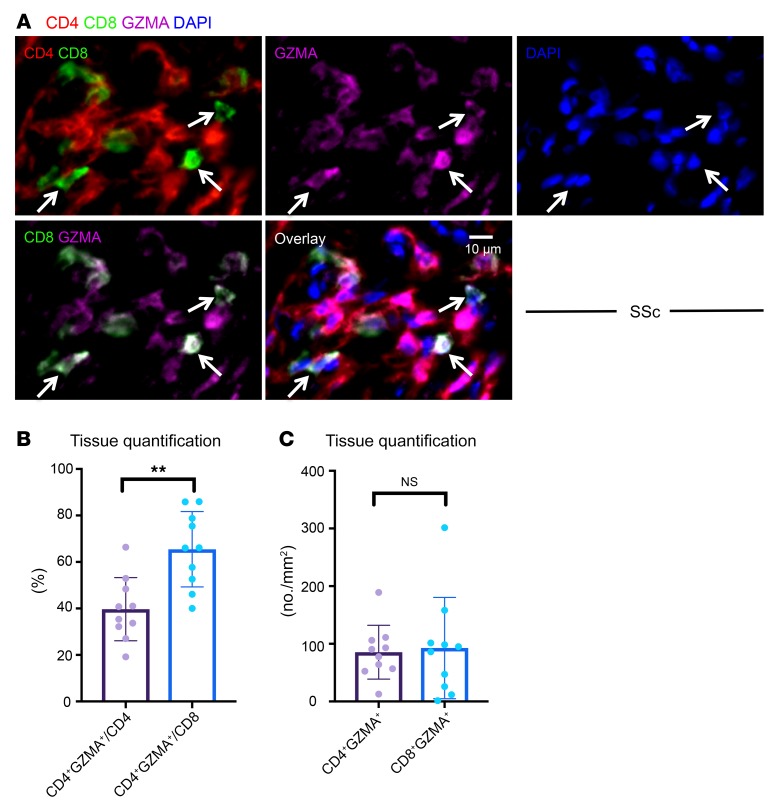
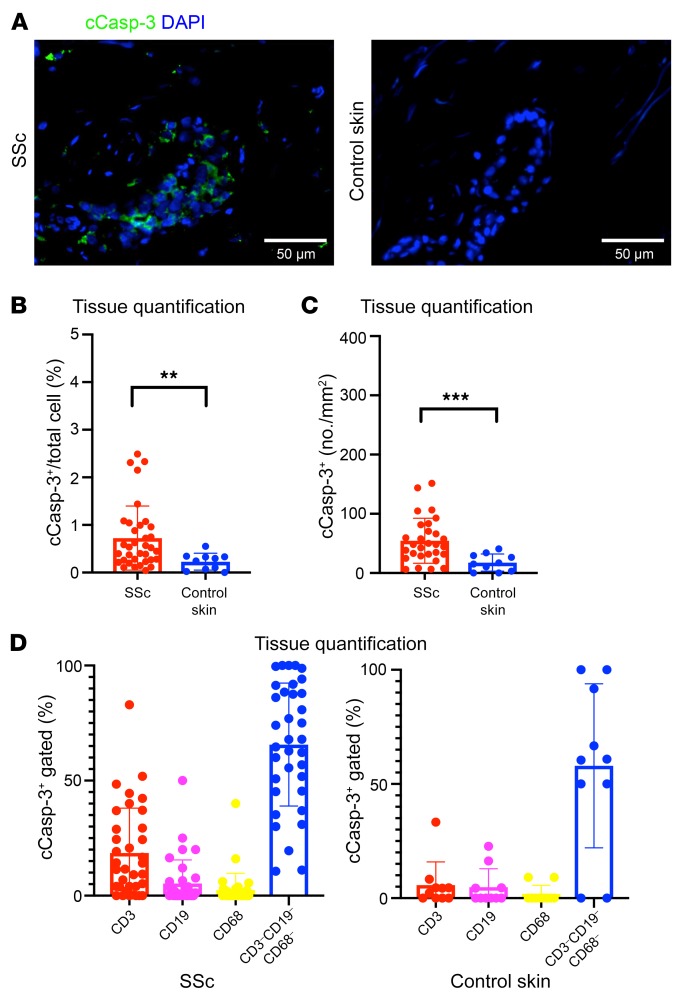
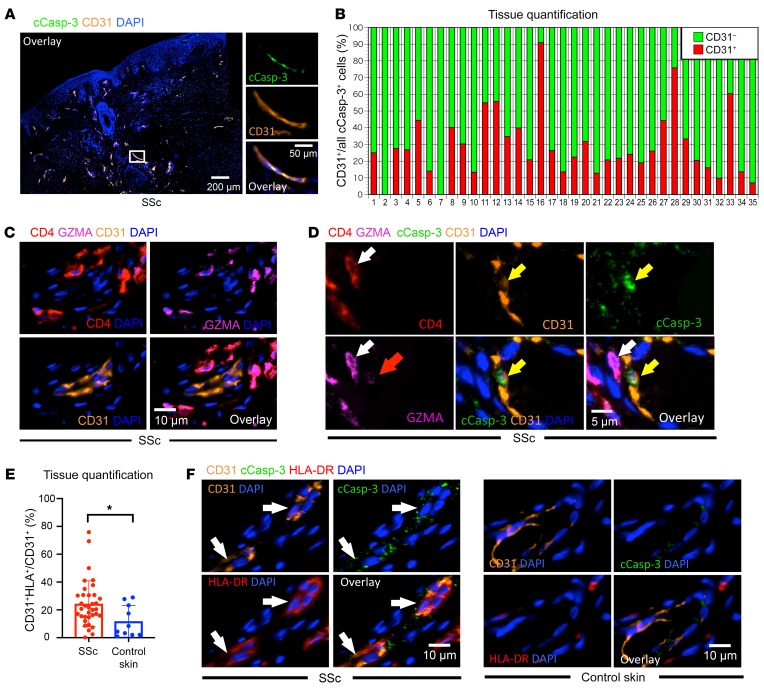
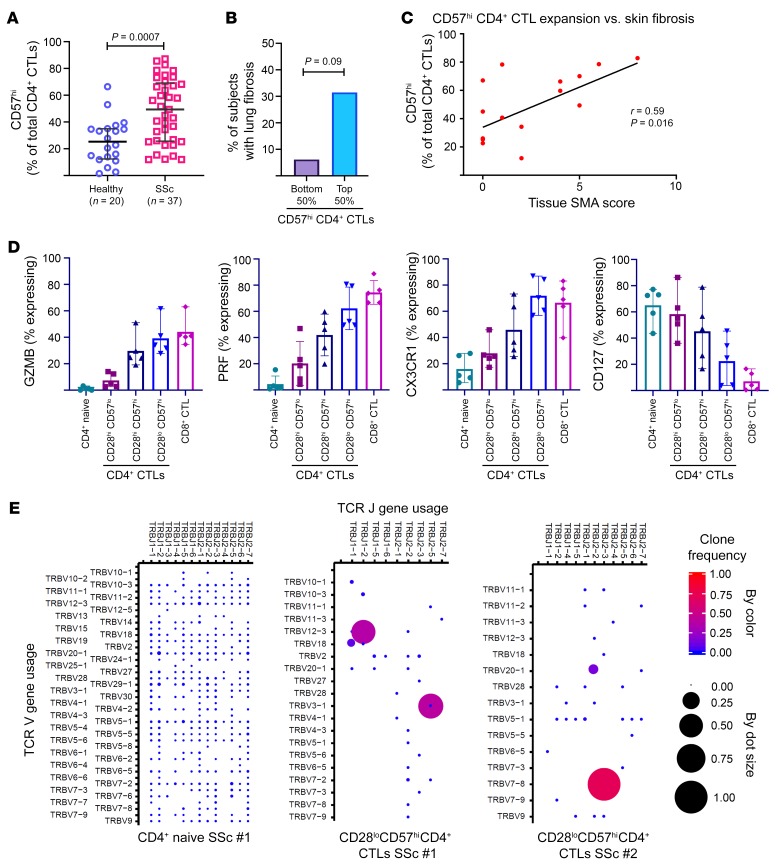
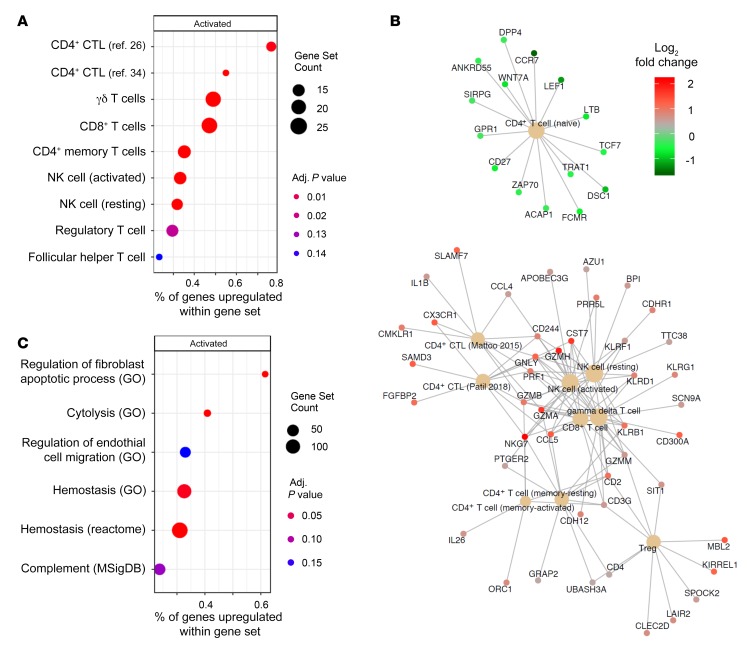
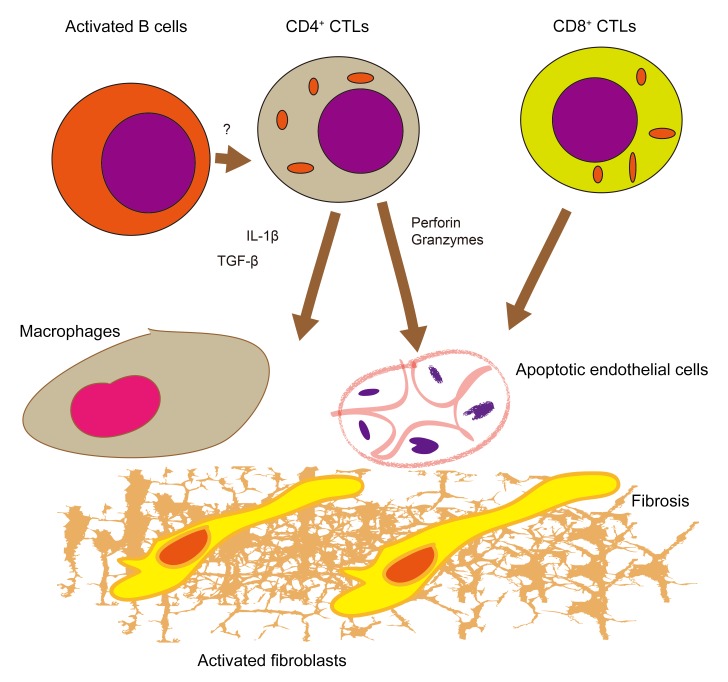
Systemic sclerosis (SSc) is an autoimmune fibrotic disease whose pathogenesis is poorly understood and lacks effective therapies. We undertook quantitative analyses of T cell infiltrates in the skin of 35 untreated patients with early diffuse SSc and here show that CD4+ cytotoxic T cells and CD8+ T cells contribute prominently to these infiltrates. We also observed an accumulation of apoptotic cells in SSc tissues, suggesting that recurring cell death may contribute to tissue damage and remodeling in this fibrotic disease. HLA-DR-expressing endothelial cells were frequent targets of apoptosis in SSc, consistent with the prominent vasculopathy seen in patients with this disease. A circulating effector population of cytotoxic CD4+ T cells, which exhibited signatures of enhanced metabolic activity, was clonally expanded in patients with systemic sclerosis. These data suggest that cytotoxic T cells may induce the apoptotic death of endothelial and other cells in systemic sclerosis. Cell loss driven by immune cells may be followed by overly exuberant tissue repair processes that lead to fibrosis and tissue dysfunction.

Keywords: Autoimmune diseases; Autoimmunity; Fibrosis; Immunology; T cells.


Conflict of interest statement

Conflict of interest: CAP, DK, and JHS are consultants to BMS. SP is on the Scientific Advisory Board (SAB) of Abpro Inc. ASP is cofounder, cochair of the SAB of Cabaletta Bio.

Figures

Figure 1
Figure 1. Quantification of T and B cells in SSc lesions.
(A) Representative multicolor immunofluorescence image of CD3+ T cells (red) and CD19+ B cells (green) in an SSc lesion. (B) Absolute numbers per mm2 of CD3+ T cells and CD19+ B cells in lesions from 35 patients with SSc. (C) Relative proportions of CD4+ and CD8+ T cells in skin lesions of individual SSc patients (n = 35). (D) Representative multicolor immunofluorescence images of CD4+ (red) and CD8+ (green) T cells in SSc tissues. Data are presented as mean ± SEM. ****P < 0.0001 by Mann-Whitney U test.
Figure 2
Figure 2. CD4+ CTLs are abundant in skin lesions of SSc patients.
(A) Representative multicolor immunofluorescence image of cells coexpressing CD4 (red) and GZMA (green) that infiltrate the skin in SSc. The right panel additionally displays GATA3 (purple) staining to identify Th2 cells in bullous pemphigoid (BP) tissue. GATA3 staining was also undertaken in SSc. (B) Relative proportions of CD4+ CTLs (red), Th2 cells (green), and other CD4+ cells (gray) in SSc (n = 35) and BP (n = 7). (C) Absolute number of CD4+ CTLs and Th2 cells per mm2 of skin, comparing SSc (n = 35) to control skin (n = 10) samples and BP (n = 7). Multiple comparisons are controlled for by Kruskal-Wallis test. (D and E) Relative proportions of Th1, Th2, Th17, and CD4+ CTL subsets in tissues from 10 SSc patients. Relative proportions of each subset (D) and of each subset in each patient (E) are depicted. Multiple comparisons are controlled for by Kruskal-Wallis test. Data are presented as mean ± SEM. *P < 0.05; **P < 0.01; ***P < 0.001; ****P < 0.0001.
Figure 3
Figure 3. CD8+GZMA+ T cells infiltrate tissue in SSc.
(A) Representative multicolor immunofluorescence images of CD8+ (green) GZMA+ (purple) T cells (delineated by arrows) in an SSc skin biopsy. (B) Relative proportions of CD4+ and CD8+ T cells expressing GZMA (n = 10). (C) Absolute numbers of CD4+GZMA+ and CD8+GZMA+ T cells in skin biopsies of 10 patients with SSc. Data are presented as mean ± SEM. **P < 0.01 by Mann-Whitney U test.
Figure 4
Figure 4. Apoptotic cells are frequently seen in SSc tissues.
(A) Representative multicolor immunofluorescence images showing cleaved caspase-3 (cCasp-3) staining (green) in SSc and control skin samples. (B and C) Proportions (B) and absolute numbers (C) of cCasp-3+ apoptotic cells in SSc (n = 35) and control skin (n = 10). (D) Proportions of apoptotic cells in SSc (n = 35) and control skin (n = 10) accounted for by T cells (red), B cells (purple), macrophages (yellow), and other cells (blue). Data are presented as mean ± SEM. **P < 0.01, ***P < 0.001 by Mann-Whitney U test.
Figure 5
Figure 5. Endothelial cells expressing HLA class II are a frequent target of apoptosis in SSc tissues.
(A) Representative multicolor immunofluorescence images showing CD31-expressing endothelial cells (orange) with cCasp-3 staining (green) in SSc. (B) Relative proportions of apoptotic cCasp-3+endothelial cells (red) and nonendothelial apoptotic cells (green) in SSc tissues (n = 35). (C) CD4+ (red) and GZMA+ (purple) CD4+ CTLs accumulate in the vicinity of CD31+ (orange) endothelial cells in SSc tissues. (D) Representative multicolor immunofluorescence image showing a GZMA-expressing (purple) CD4+ CTL (white arrows) in close proximity to a cCasp-3+ endothelial cell (yellow arrow). Red arrow highlights GZMA visible within the apoptotic endothelial cell. (E) Percentages of HLA+ cells among CD31+ cells in SSc (n = 35) and control skin (n = 10). (F) Multicolor immunofluorescence images of cCasp-3+ (green) and HLA-DR+ (red) endothelial cells (orange and indicated by arrows) in SSc, but not in control skin. Data are presented as mean ± SEM. *P < 0.05 by Mann-Whitney U test.
Figure 6
Figure 6. Effector CD4+ CTLs are clonally expanded and correlate with tissue fibrosis in SSc.
(A) Dot plot demonstrates marked expansion of CD57hiCD4+ CTLs comparing SSc subjects (n = 37) to age-matched healthy donors (n = 20). Lines represent medians with standard deviation. Mann-Whitney U test was used to calculate P value. (B) Bar chart showing increased frequency of lung fibrosis among SSc patients with greater CD57hiCD4+ CTL expansions. Proportion of patients in each group is plotted. P value was calculated by Fisher’s exact test. (C) X-Y plot showing positive correlation between CD57hiCD4+ CTL expansion and tissue α-smooth muscle actin (α-SMA) staining. Linear regression was used to calculate P value. (D) Scatter plots with mean and range displaying the percentage of each T cell subset expressing granzyme B (GZMB), perforin (PRF), CX3CR1, and CD127. (E) Dot plots show the TCR repertoire comprising effector CD4+ CTLs from 2 SSc subjects (middle and right). TCR repertoire from a naive CD4+ T cell population is shown for reference (far left).
Figure 7
Figure 7. CD28loCD57hiCD4+ CTLs from SSc patients have transcriptional signatures linked to cytotoxicity, fibrogenesis, and metabolic activity rather than senescence.
Comparing CD28loCD57hiCD4+ CTLs to naive CD4+ T cells, we identified enrichment for many gene sets, including (A) alignment with previously reported CD4+ CTL transcriptomes and greater similarity with γδ T cell and CD8+ T cell transcriptomes rather than with conventional CD4+ T cells, and (B) those associated with fibrogenesis such as regulation of fibroblast apoptosis, regulation of endothelial cell migration and hemostasis. Size of dots represents number of genes within a given gene set. The x axes represent the percentages of genes within a gene set enriched for by the effector CD4+ CTL transcriptome. (C) CNETplot showing all genes upregulated by effector CD4+ CTLs from immune cell transcriptional gene sets showing a prominent cytotoxic profile with upregulation of GZMA, GZMB, GZMM, GZMH, PRF1, and SLAMF7. P values were calculated with the permutation method implemented in fgsea version 1.12.0.
Figure 8
Figure 8. Schematic model for the pathogenesis of SSc.
Infiltration of inflamed tissues by CD4+ CTLs and CD8+ CTLs and the apoptosis of endothelial cells may contribute to this disease. Reactivation of CD4+ CTLs may require antigen presentation by activated B cells in tissue sites. Cell apoptosis and macrophage and fibroblast activation by cytokines secreted by cytotoxic T cells may together contribute to fibrosis.

Comment in

Similar articles

Cited by

References

    1. Denton CP, Khanna D. Systemic sclerosis. Lancet. 2017;390(10103):1685–1699. doi: 10.1016/S0140-6736(17)30933-9. - DOI - PubMed
    1. Chora I, et al. Evidence for a derangement of the microvascular system in patients with a very early diagnosis of systemic sclerosis. J Rheumatol. 2017;44(8):1190–1197. doi: 10.3899/jrheum.160791. - DOI - PubMed
    1. Mostmans Y, et al. The role of endothelial cells in the vasculopathy of systemic sclerosis: A systematic review. Autoimmun Rev. 2017;16(8):774–786. doi: 10.1016/j.autrev.2017.05.024. - DOI - PubMed
    1. Asano Y, Sato S. Vasculopathy in scleroderma. Semin Immunopathol. 2015;37(5):489–500. doi: 10.1007/s00281-015-0505-5. - DOI - PubMed
    1. Morisset J, et al. Mortality risk prediction in scleroderma-related interstitial lung disease: The SADL model. Chest. 2017;152(5):999–1007. doi: 10.1016/j.chest.2017.06.009. - DOI - PMC - PubMed

Publication types

Substances