. 2020 Jan 27;52(2):141-151.e5.
doi: 10.1016/j.devcel.2019.12.017.

Autophagy of an Amyloid-like Translational Repressor Regulates Meiotic Exit

Affiliations

Autophagy of an Amyloid-like Translational Repressor Regulates Meiotic Exit

Fei Wang et al. Dev Cell. .

Abstract

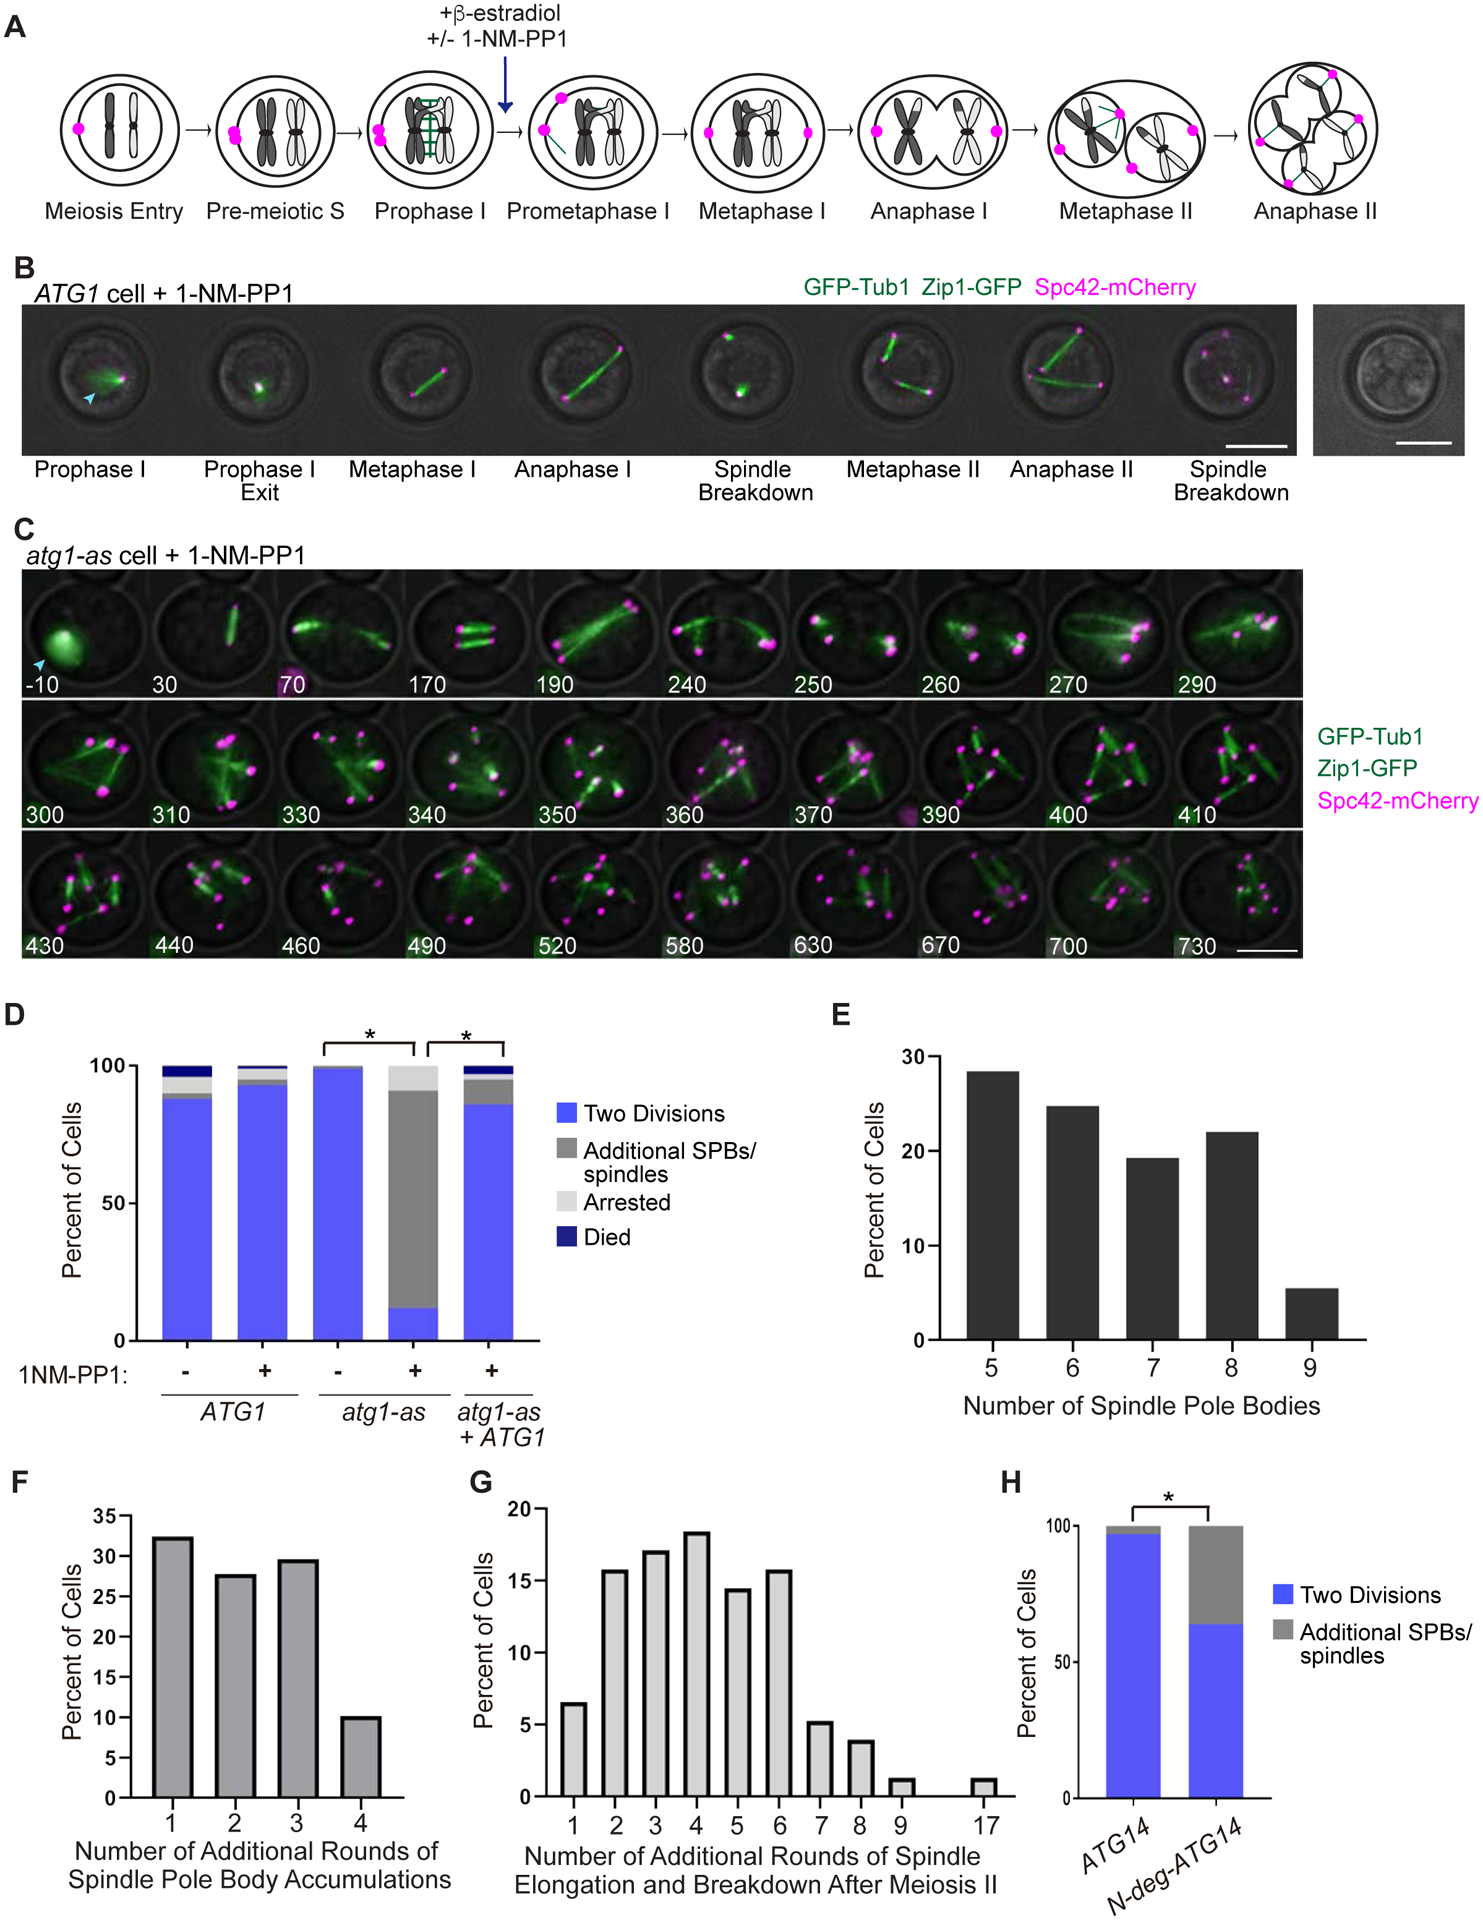
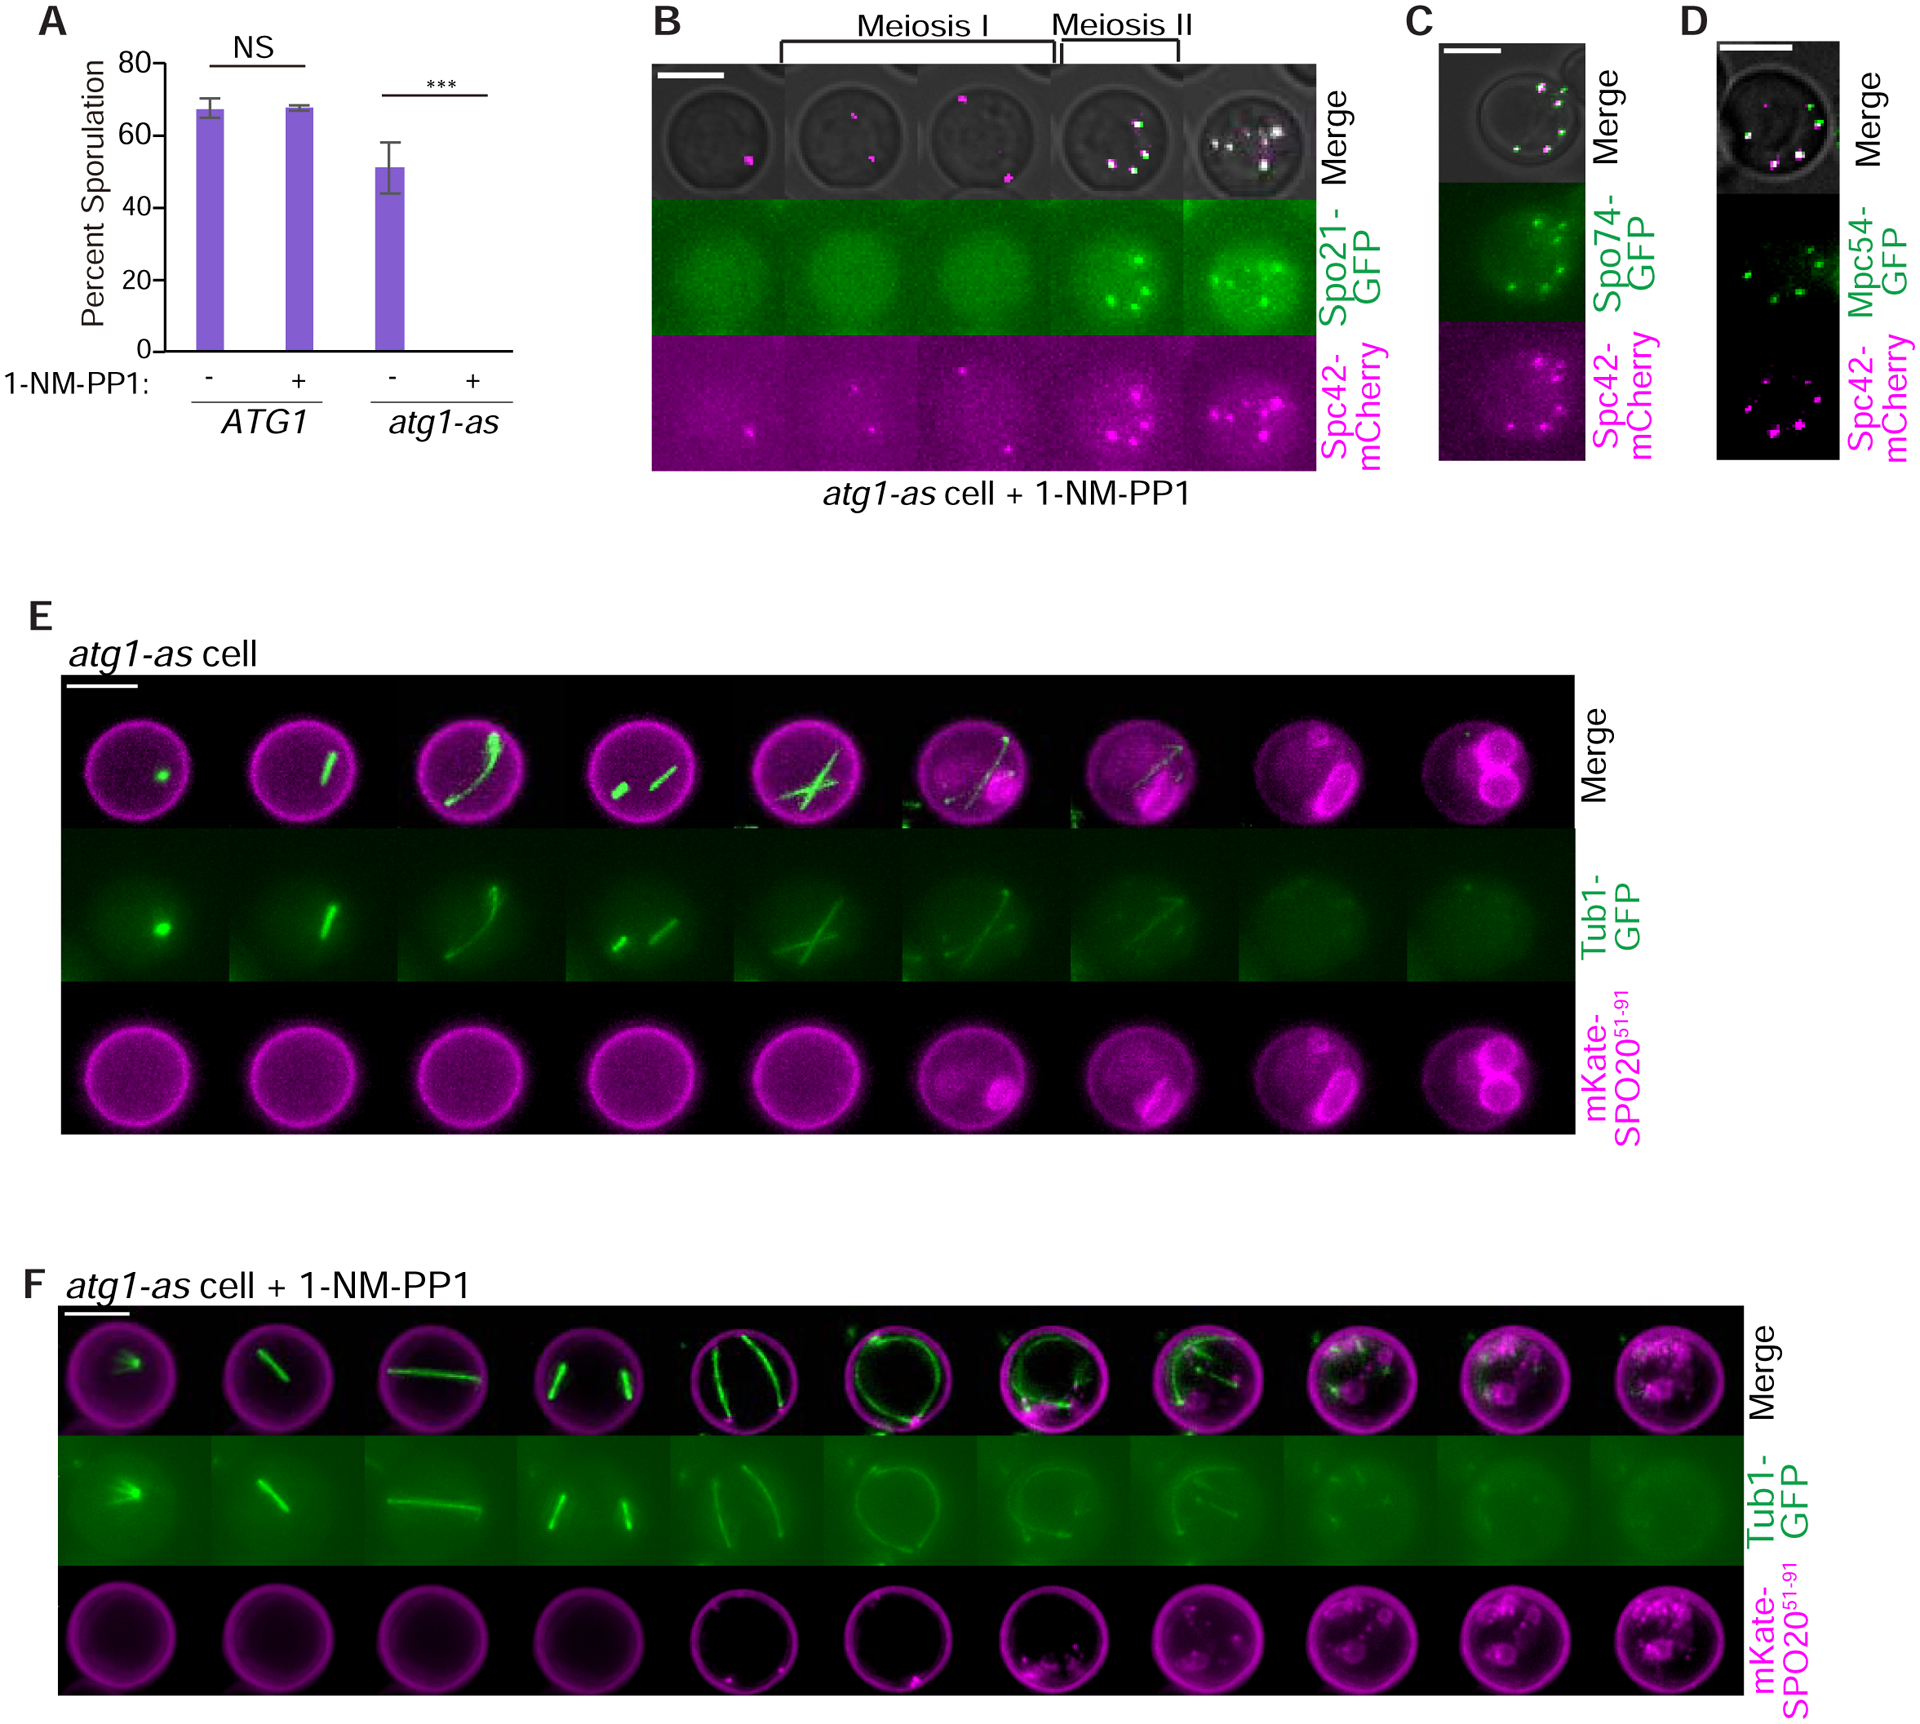
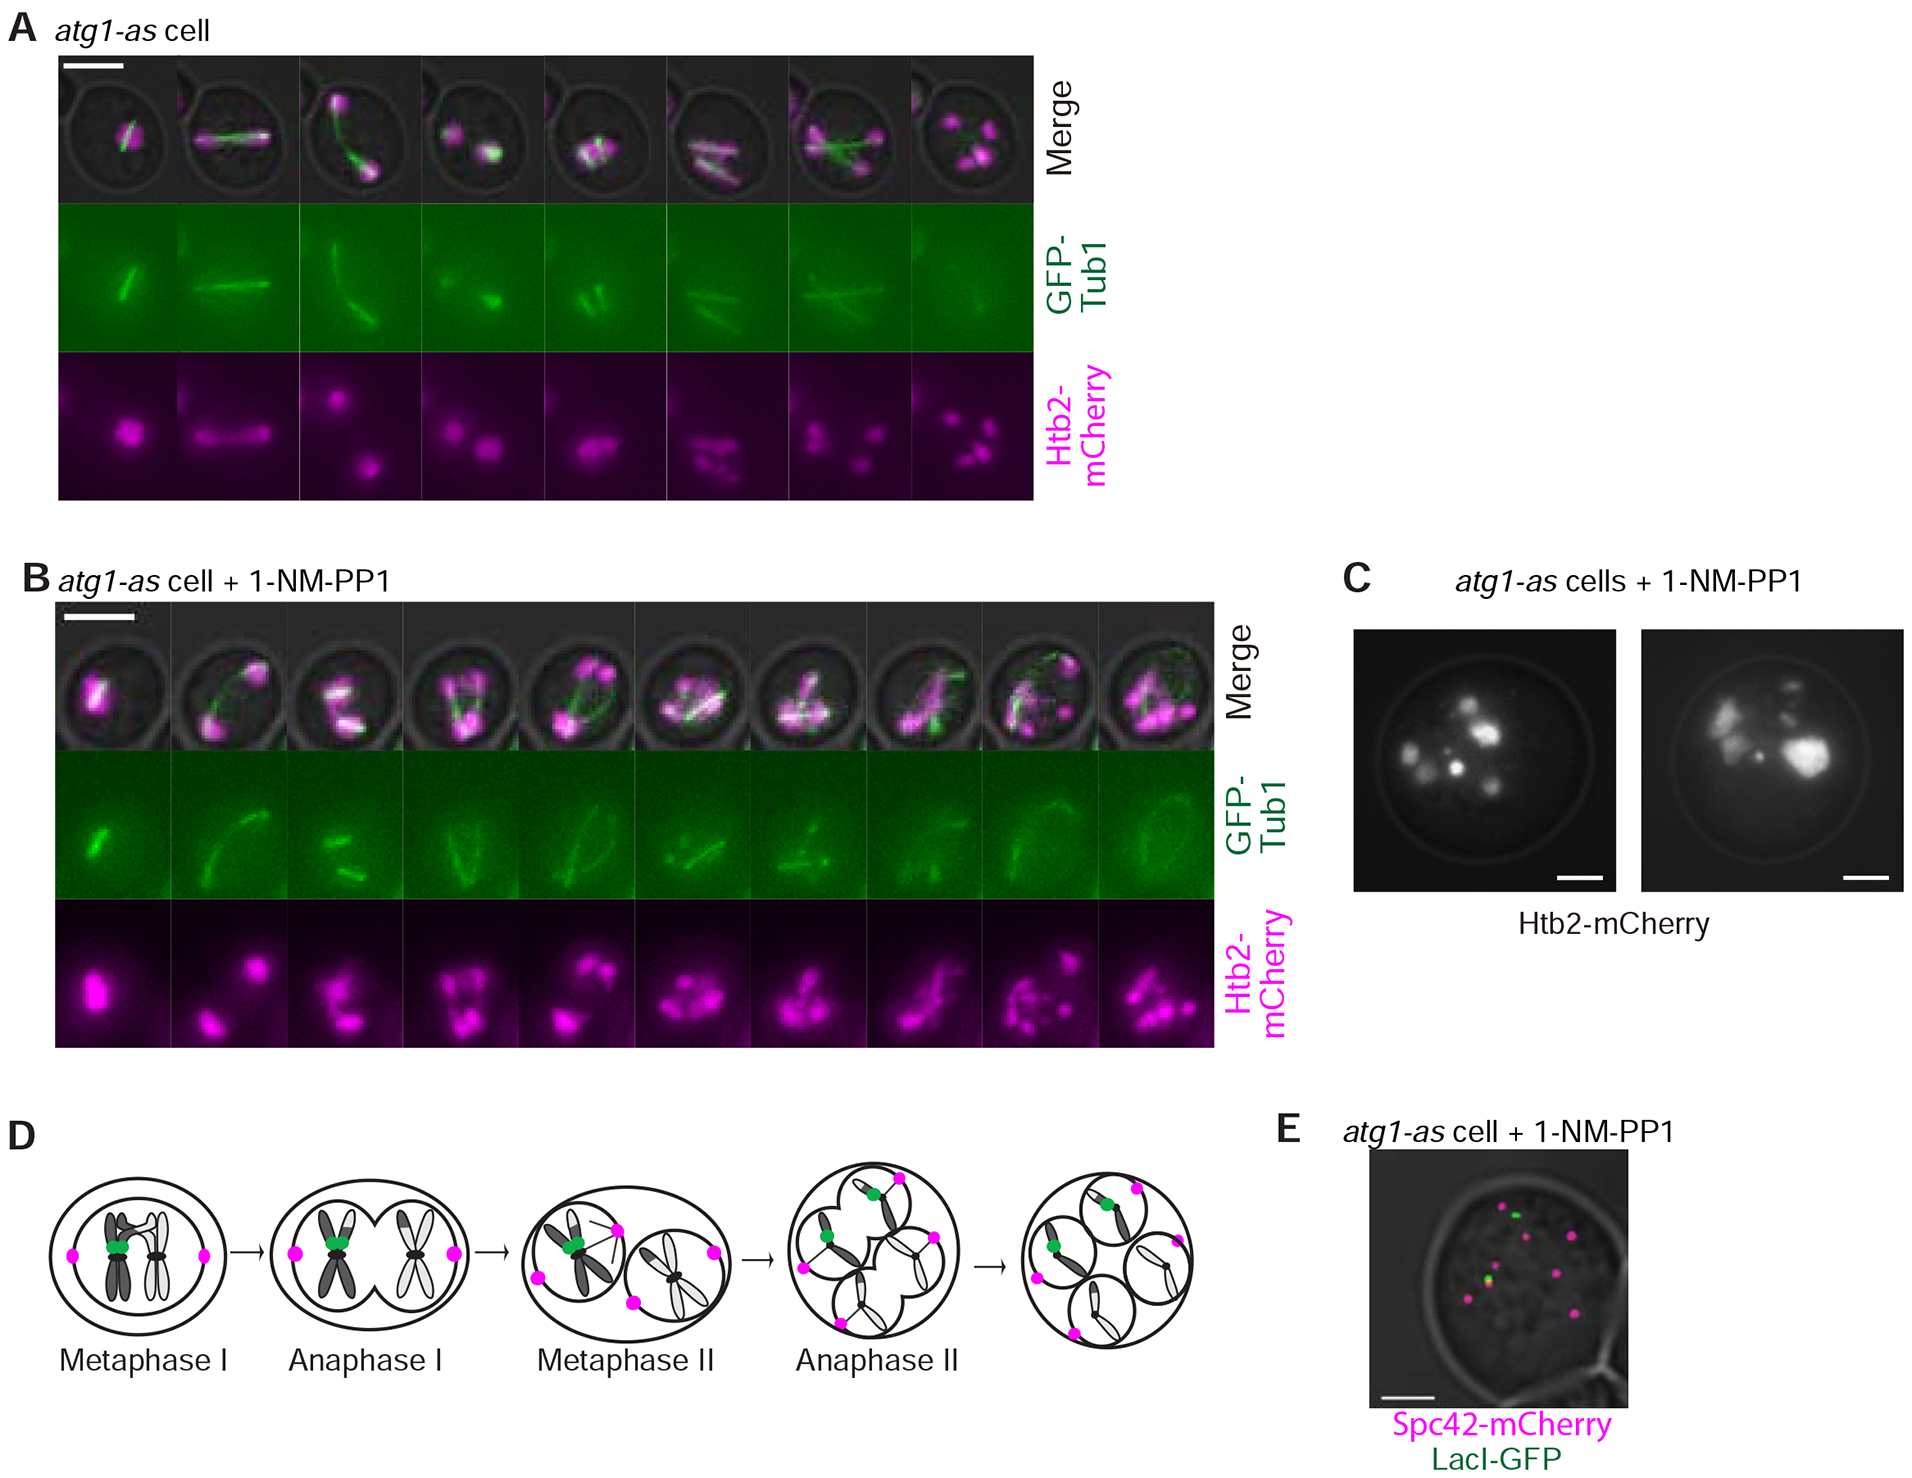
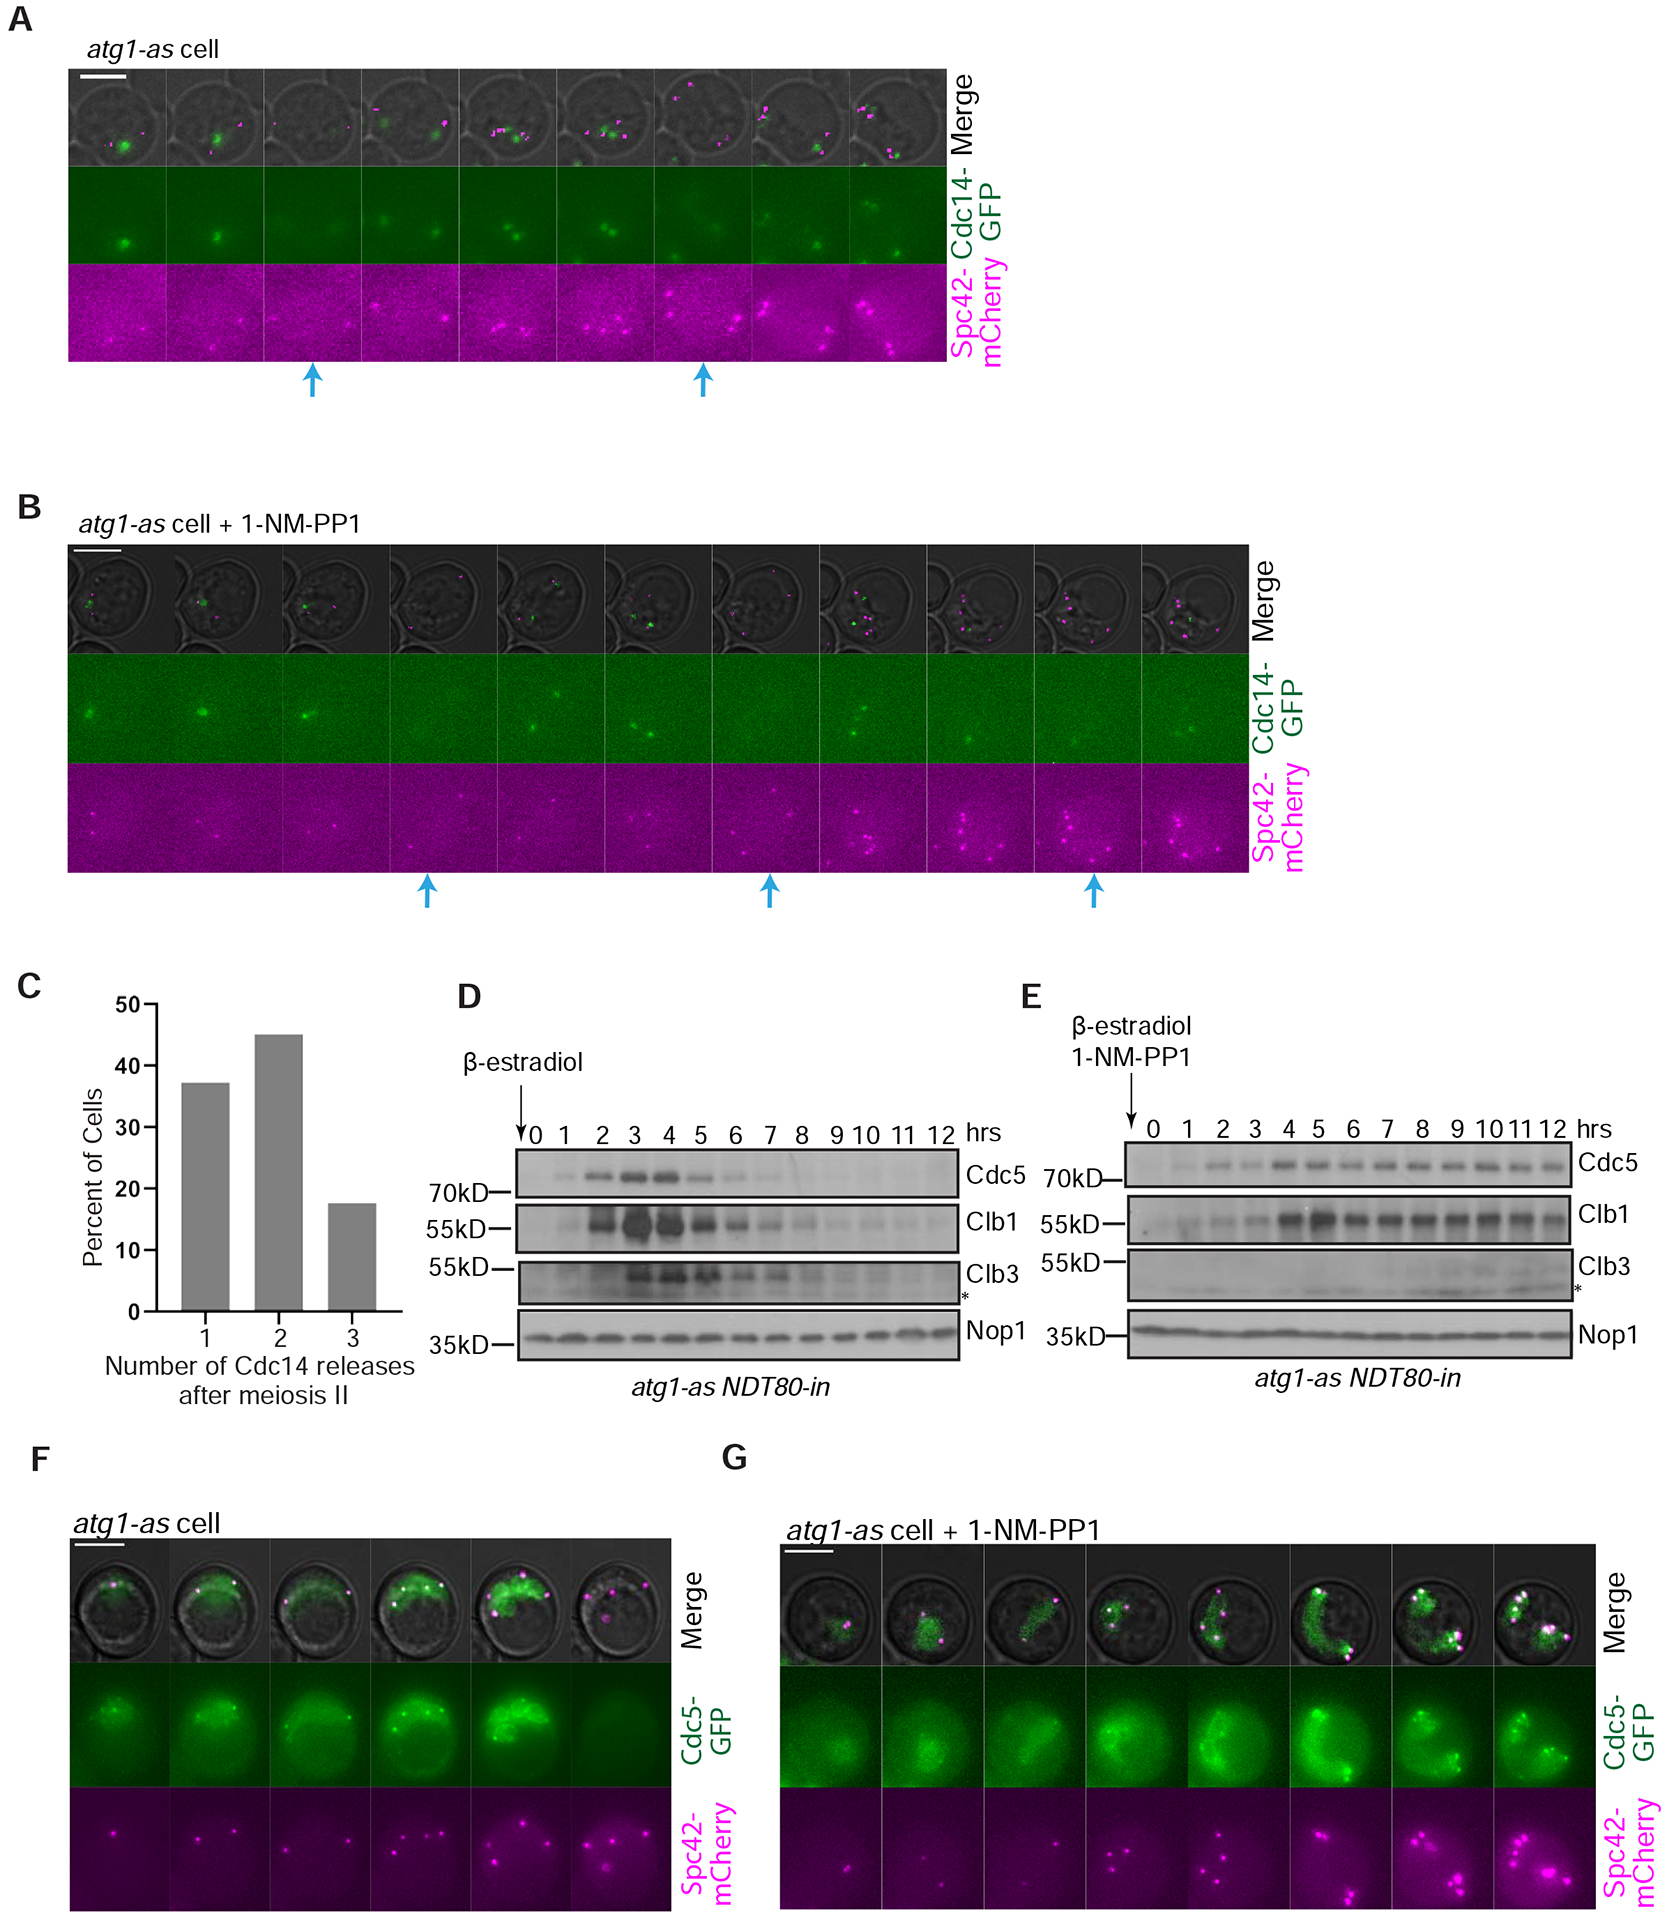
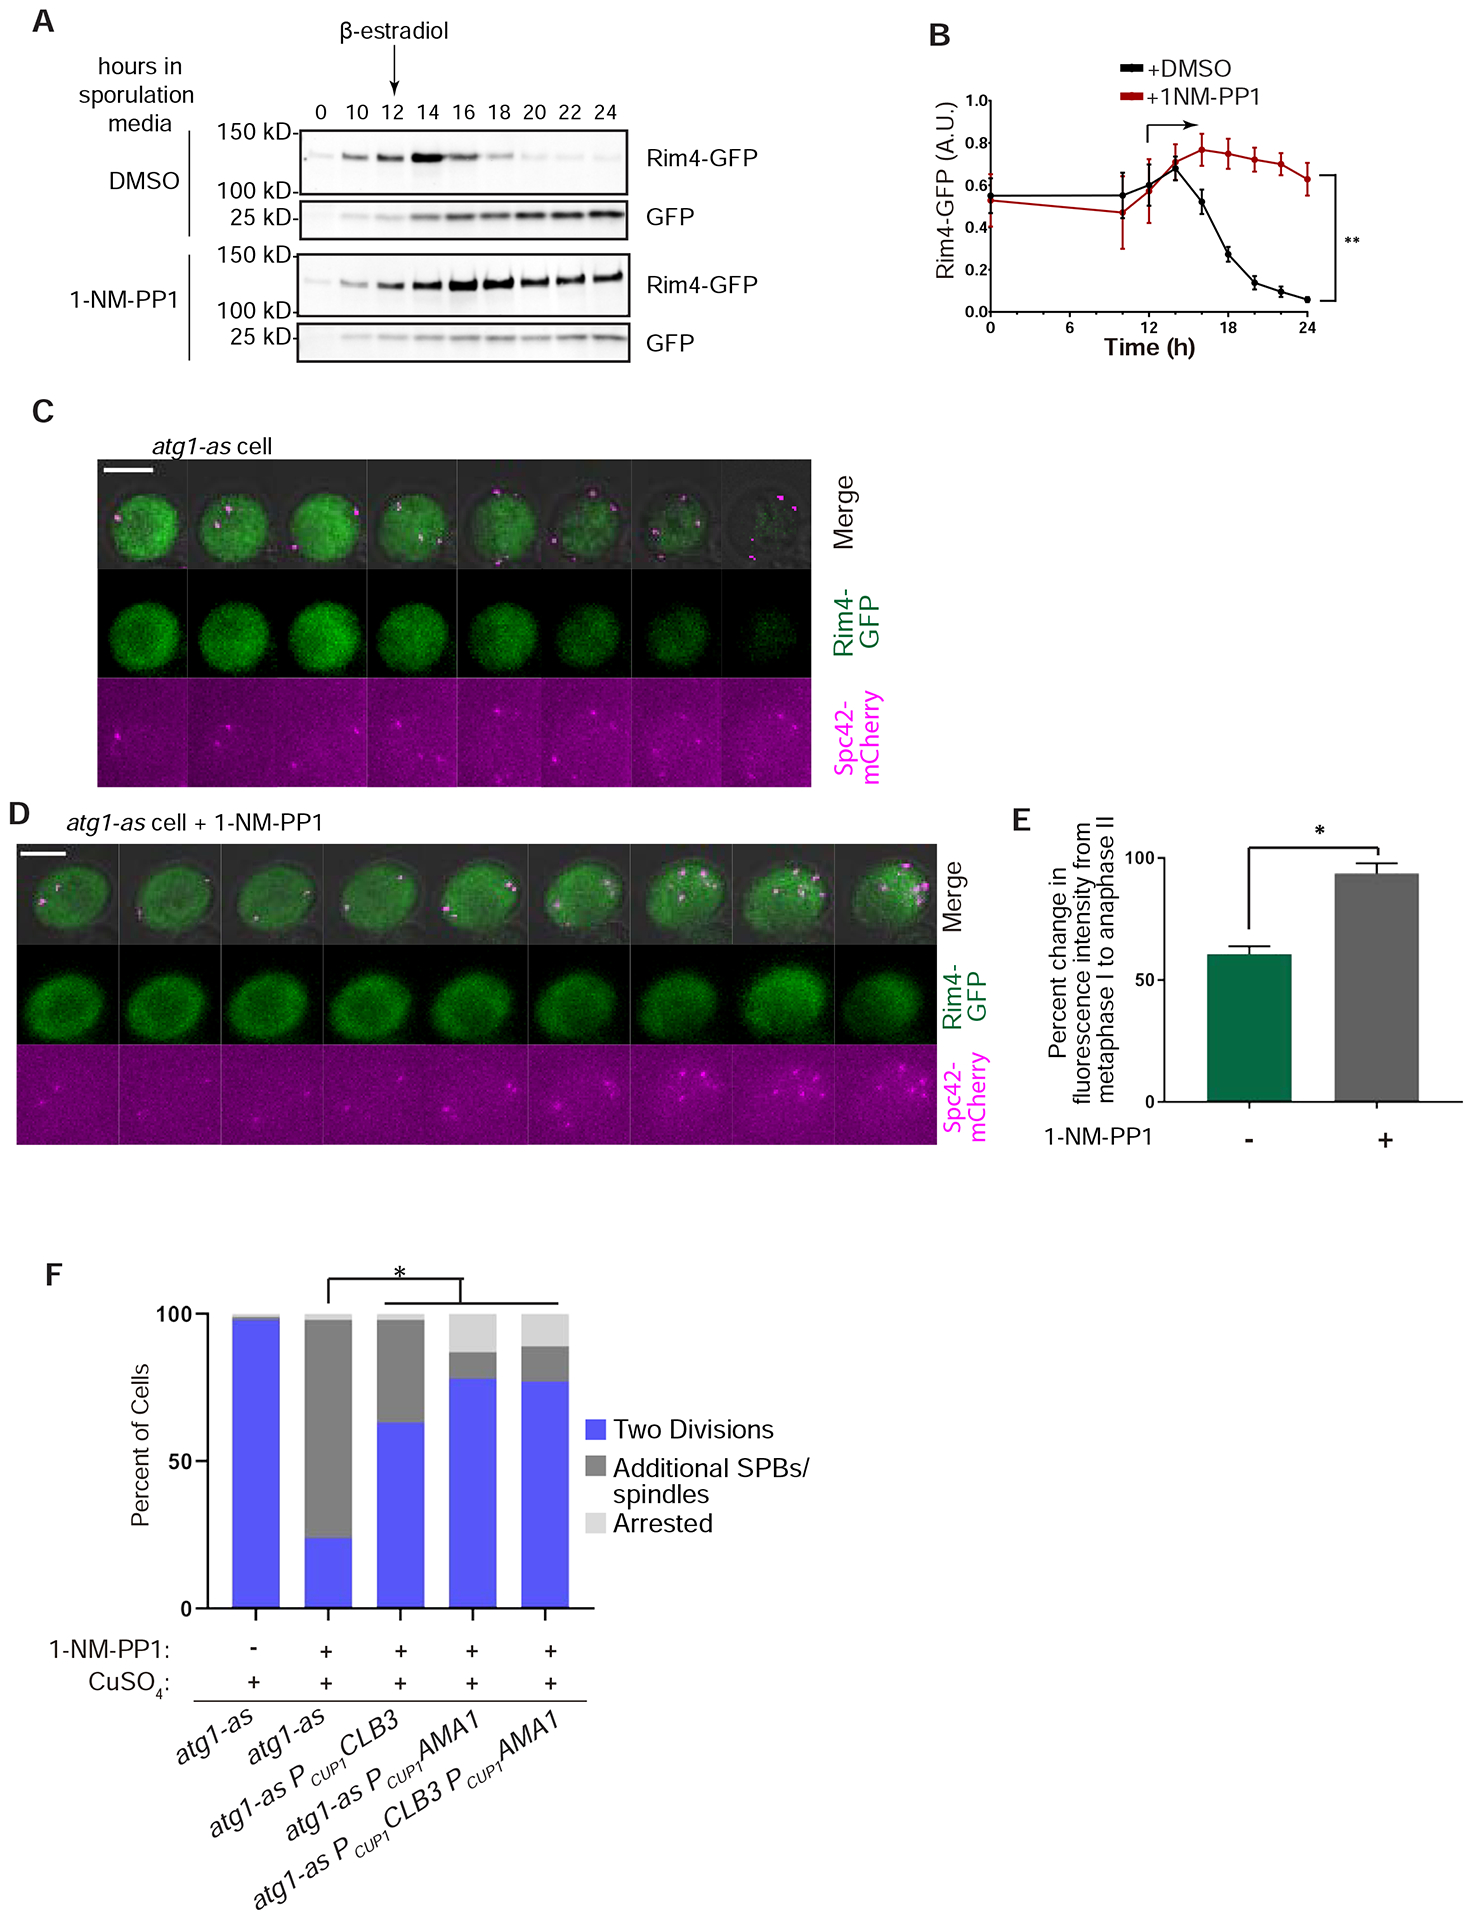
We explored the potential for autophagy to regulate budding yeast meiosis. Following pre-meiotic DNA replication, we blocked autophagy by chemical inhibition of Atg1 kinase or engineered degradation of Atg14 and observed homologous chromosome segregation followed by sister chromatid separation; cells then underwent additional rounds of spindle formation and disassembly without DNA re-replication, leading to aberrant chromosome segregation. Analysis of cell-cycle regulators revealed that autophagy inhibition prevents meiosis II-specific expression of Clb3 and leads to the aberrant persistence of Clb1 and Cdc5, two substrates of a meiotic ubiquitin ligase activated by Ama1. Lastly, we found that during meiosis II, autophagy degrades Rim4, an amyloid-like translational repressor whose timed clearance regulates protein production from its mRNA targets, which include CLB3 and AMA1. Strikingly, engineered Clb3 or Ama1 production restored meiotic termination in the absence of autophagy. Thus, autophagy destroys a master regulator of meiotic gene expression to enable irreversible meiotic exit.

Keywords: APC/C; Ama1; Atg1; Atg14; Clb3; Rim4; autophagy; meiosis; sporulation; translational repression.


Conflict of interest statement

Declaration of Interests The authors declare no competing interests.

Figures

Figure 1:
Figure 1:. Autophagy inhibition causes additional rounds of spindle formation and breakdown after meiosis II.
A) Cartoon showing cell cycle stages of budding yeast meiosis with synchronization by NDT80-in and release from prophase I arrest by β-estradiol addition. Unless indicated otherwise, 1-NM-PP1 was always added to meiotic cells at the time of arrest release. B) Representative time-lapse images of a wildtype (ATG1) cell undergoing synchronized meiosis in the presence of 1-NM-PP1. Also pictured, a brightfield image of spores at the end of the time-lapse. Blue arrowhead shows Zip1-GFP. Scale Bar: 5μm. C) Representative time-lapse images of an atg1-as cell undergoing synchronized meiosis in the presence of 1-NM-PP1. Blue arrowhead shows Zip1-GFP. Scale Bar: 5μm. D) Percent of wildtype, atg1-as, and atg1-as + ATG1 cells that underwent the indicated synchronized meiotic outcome in the absence or presence of 1-NM-PP1. The atg1-as + ATG1 cells have a transgenic copy of ATG1 under the control of a β-estradiol-inducible promoter (McIsaac et al., 2014). Only cells that were in prophase I (with Zip1-GFP) at the time of arrest release were analyzed. Asterisk represents statistically significant differences (n = >100 cells and 3 independent experiments for each genotype; p <.01, rx Contingency Tables). E) Graph of cells that had additional SPBs showing the percent of cells with the indicated number of additional SPBs (n=100 cells). F) Graph of cells that had additional SPBs, showing the percent of cells with the indicated number of additional rounds of SPB accumulations (n=100 cells). G) Graph of cells that had additional rounds of spindle formation, elongation, and breakdown after meiosis II, showing the percent of cells with the indicated number of additional rounds (n=100 cells). H) Percent of ATG14 NDT80-in and N-deg-ATG14 NDT80-in cells that underwent the indicated synchronized meiotic outcome. Note that both genetic backgrounds have a β-estradiol-inducible TEV protease that enables activation of the N-degron in the latter strain (Taxis and Knop, 2012). Only cells that were in prophase I (with Zip1-GFP) at the time of arrest release were analyzed. Asterisk represents statistically significant differences (n = >100 cells for each; p <.01, Fisher’s exact test).
Figure 2:
Figure 2:. Autophagy inhibition disrupts gametogenesis.
A) Graph of percentage of wildtype and atg1-as cells (without Ndt80-IN) that sporulate with and without 1-NM-PP1 inhibitor added 10 hours after introduction into sporulation medium. NS = not significant. Asterisk indicates a statistically significant difference (n > 200 cells per strain; p<0.001; t test). B) Representative time-lapse images of an atg1-as cell undergoing synchronized meiosis in the presence of 1-NM-PP1 and β-estradiol addition. Scale Bar: 5μm. C, D) Similar to post-meiosis II images in part B but with additional fluorescently-labeled SPB components, as indicated. E-F) Representative time-lapse images of atg1-as cells undergoing synchronized meiosis in the absence (E) and presence (F) of 1-NM-PP1. Prospore membranes are marked with mKate-Spo2051–90. Scale Bars: 5μm.
Figure 3:
Figure 3:. Autophagy inhibition causes additional, aberrant rounds of chromosome segregation following meiosis II.
A-B) Representative time-lapse images of atg1-as cells undergoing synchronized meiosis in the absence (A) and presence of 1-NM-PP1 (B). Scale Bars: 5μm. C) Additional images of cells from part B showing different sized chromatin masses after cells underwent additional, post-meiosis II rounds of chromosome segregation. Scale bar: 2μm. D) Cartoon of a normal meiotic division with one chromosome III tagged with LacO-LacI-GFP. E) Representative image of an 1-NM-PP1-treated atg1-as cell that underwent additional, post-meiosis II rounds of chromosome segregation. LacI-GFP recognizes LacO on one chromosome III. Scale Bars: 2μm.
Figure 4:
Figure 4:. Autophagy inhibition affects diverse cell cycle regulators.
A,B) Representative time-lapse images of an atg1-as cell undergoing synchronized meiosis in the absence (A) and presence (B) of 1-NM-PP1. Blue arrows show Cdc14 release from the nucleolus. Scale Bar: 5μm. C) Graph showing the percent of cells in part B with the indicated number of Cdc14 releases after meiosis II (n=50 cells). D,E) Western blotting analysis of the indicated cell cycle regulators following release from prophase I arrest in the absence (D) and presence of 1-NM-PP1 (E). Nop1 is a nucleolar protein used as a loading control. F,G) Representative time-lapse images of atg1-as cells undergoing synchronized meiosis in the absence (A) and presence of 1-NM-PP1 (B). Scale Bars: 5μm.
Figure 5:
Figure 5:. Autophagic processing of Rim4-GFP and phenotypic suppression by engineered production of Rim4 targets.
A) Representative Western blotting analysis of GFP in lysates derived from RIM4-GFP atg1-as NDT80-in cells undergoing synchronized meiosis under mock (DMSO) or 1-NM-PP1 treatment. B) Quantification of Western blotting data from three independent experiments collected as in part A. Rim4-GFP is normalized by total GFP (Rim4-GFP + GFP). Statistical significance was determined by a 2-way ANOVA. * represents statistical significance (p<0.01) C, D) Representative time-lapse images of atg1-as cells (without NDT80-in) undergoing meiosis in the absence (C) and presence of 1-NM-PP1 (D). Scale Bar: 5μm. E) GFP fluorescence intensity measurements were collected from atg1-as RIM4-GFP cells undergoing meiosis in the absence or presence of 1-NM-PP1, as indicated (n=35 cells from 3 independent experiments). Shown is the average and standard deviation of percent decrease in fluorescence intensity between metaphase I and anaphase II. * represents statistical significance (p<.001; rX contingency table). F) Percent of atg1-as, atg1-as PCUP1CLB3, atg1-as PCUP1AMA1, and atg1-as PCUP1CLB3 PCUP1AMA1 cells that undergo the indicated synchronized meiotic outcome in the presence of 1-NM-PP1. Also shown are data from control atg1-as cells in which autophagy was not inhibited. Copper sulfate was added to all cells at the time of arrest release. Only cells that were in prophase I at the time of arrest release were analyzed. Asterisk represents statistically significant differences (n = >100 cells for each genotype; p <.001, rx Contingency Tables).

References

    1. Arguello-Miranda O, Zagoriy I, Mengoli V, Rojas J, Jonak K, Oz T, Graf P, and Zachariae W (2017). Casein Kinase 1 Coordinates Cohesin Cleavage, Gametogenesis, and Exit from M Phase in Meiosis II. Developmental cell 40, 37–52. - PubMed
    1. Benjamin KR, Zhang C, Shokat KM, and Herskowitz I (2003). Control of landmark events in meiosis by the CDK Cdc28 and the meiosis-specific kinase Ime2. Genes Dev 17, 1524–1539. - PMC - PubMed
    1. Berchowitz LE, Gajadhar AS, van Werven FJ, De Rosa AA, Samoylova ML, Brar GA, Xu Y, Xiao C, Futcher B, Weissman JS, et al. (2013). A developmentally regulated translational control pathway establishes the meiotic chromosome segregation pattern. Genes Dev 27, 2147–2163. - PMC - PubMed
    1. Berchowitz LE, Kabachinski G, Walker MR, Carlile TM, Gilbert WV, Schwartz TU, and Amon A (2015). Regulated Formation of an Amyloid-like Translational Repressor Governs Gametogenesis. Cell 163, 406–418. - PMC - PubMed
    1. Blethrow J, Zhang C, Shokat KM, and Weiss EL (2004). Design and use of analog-sensitive protein kinases. Curr Protoc Mol Biol Chapter 18, Unit 18 11. - PubMed

MeSH terms

Substances