. 2020 Mar 4;28(3):855-873.
doi: 10.1016/j.ymthe.2020.01.011. Epub 2020 Jan 15.

Cardiac Nestin+ Mesenchymal Stromal Cells Enhance Healing of Ischemic Heart through Periostin-Mediated M2 Macrophage Polarization

Affiliations

Cardiac Nestin+ Mesenchymal Stromal Cells Enhance Healing of Ischemic Heart through Periostin-Mediated M2 Macrophage Polarization

Yan Liao et al. Mol Ther. .

Abstract

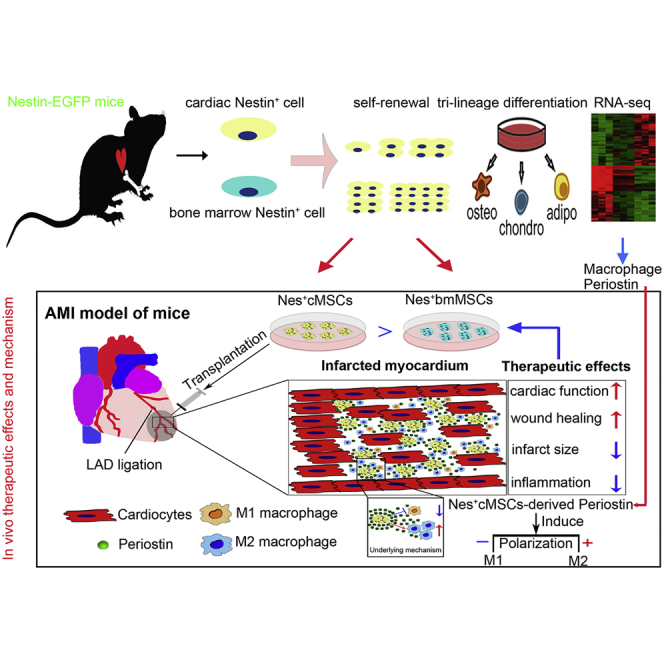
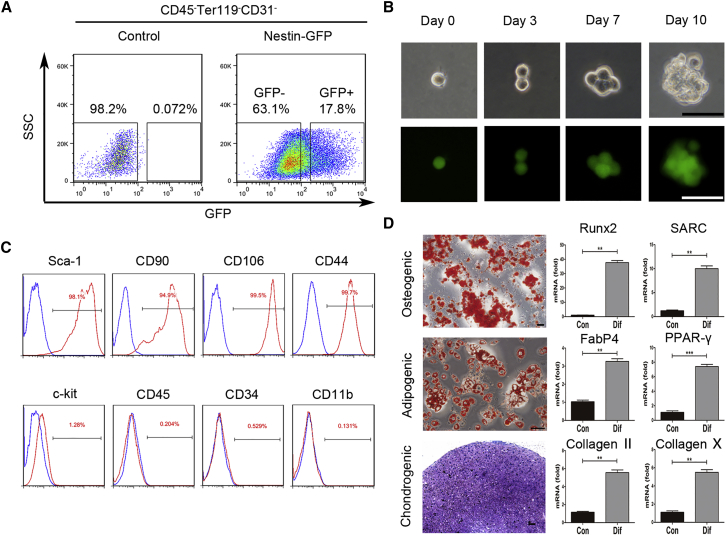
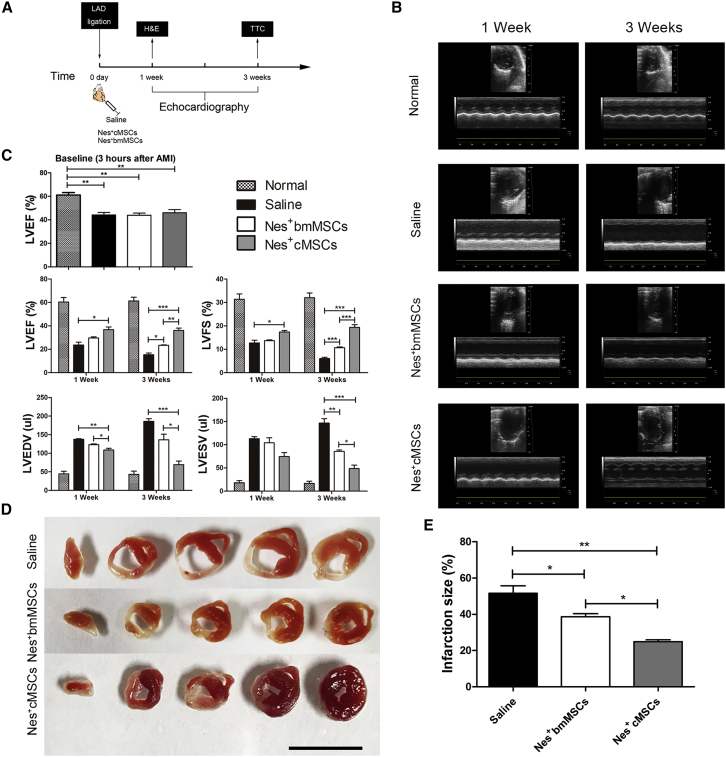
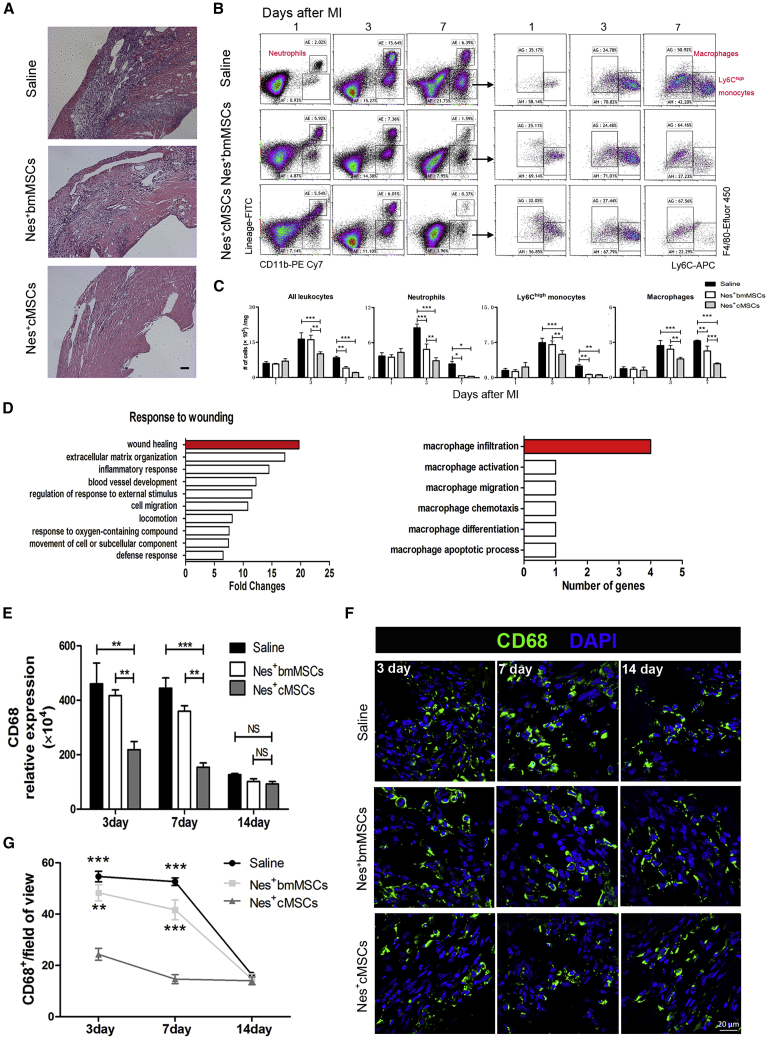
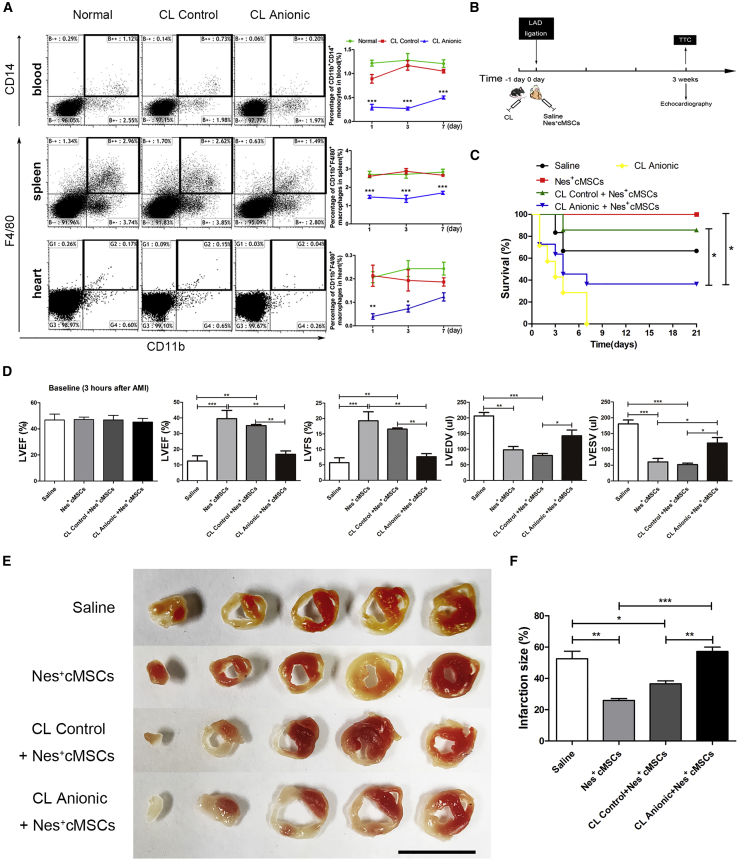
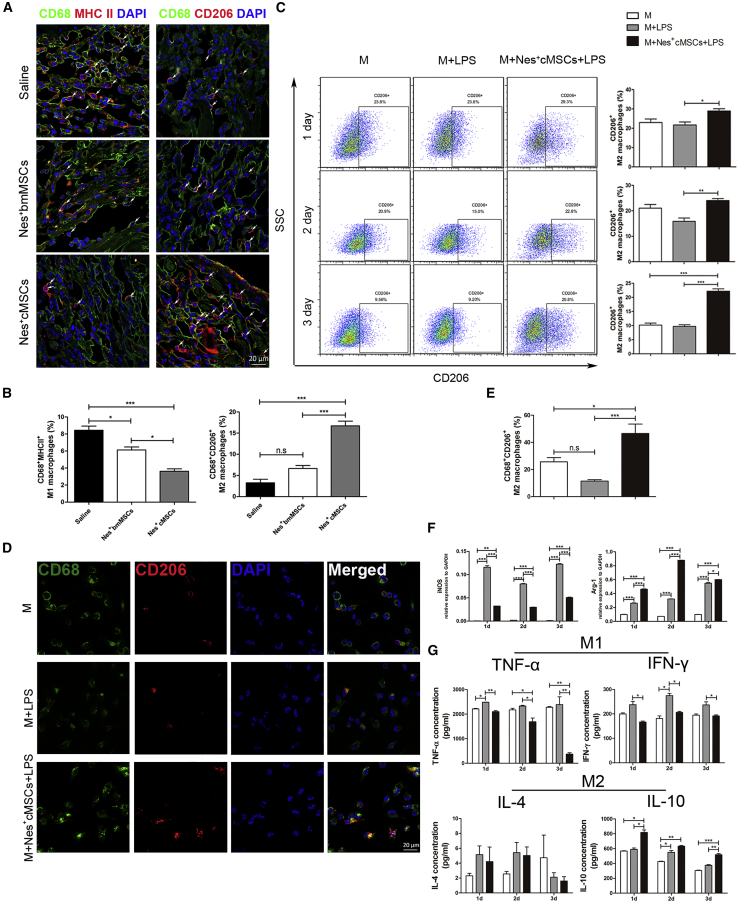
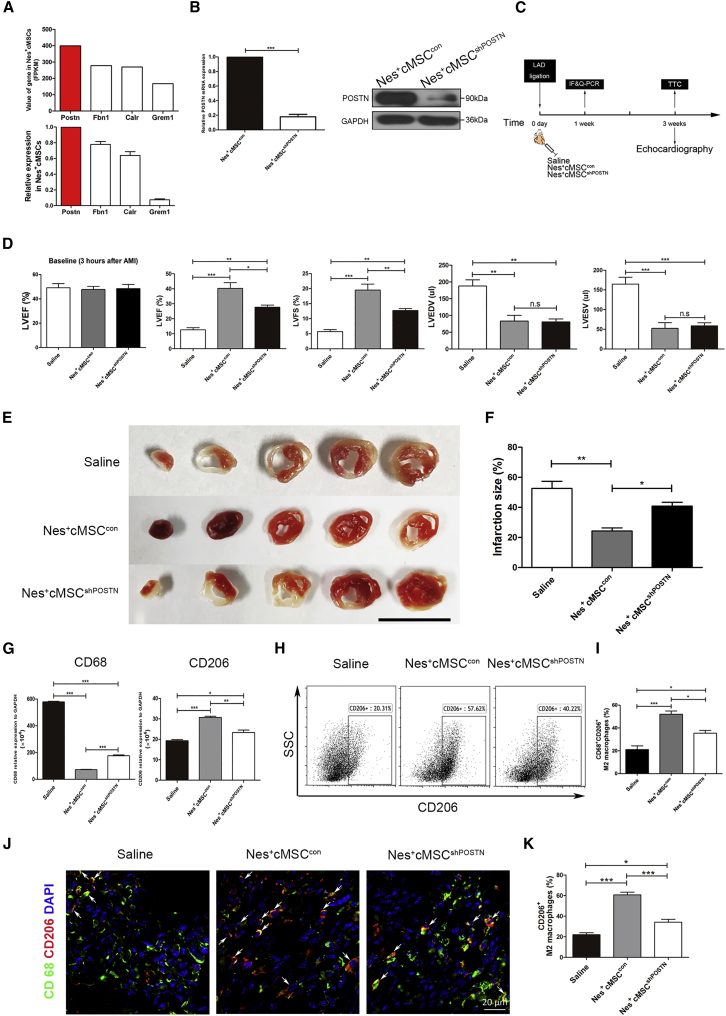
Mesenchymal stromal cells (MSCs) show potential for treating cardiovascular diseases, but their therapeutic efficacy exhibits significant heterogeneity depending on the tissue of origin. This study sought to identify an optimal source of MSCs for cardiovascular disease therapy. We demonstrated that Nestin was a suitable marker for cardiac MSCs (Nes+cMSCs), which were identified by their self-renewal ability, tri-lineage differentiation potential, and expression of MSC markers. Furthermore, compared with bone marrow-derived MSCs (Nes+bmMSCs) or saline-treated myocardial infarction (MI) controls, intramyocardial injection of Nes+cMSCs significantly improved cardiac function and decreased infarct size after acute MI (AMI) through paracrine actions, rather than transdifferentiation into cardiac cells in infarcted heart. We further revealed that Nes+cMSC treatment notably reduced pan-macrophage infiltration while inducing macrophages toward an anti-inflammatory M2 phenotype in ischemic myocardium. Interestingly, Periostin, which was highly expressed in Nes+cMSCs, could promote the polarization of M2-subtype macrophages, and knockdown or neutralization of Periostin remarkably reduced the therapeutic effects of Nes+cMSCs by decreasing M2 macrophages at lesion sites. Thus, the present work systemically shows that Nes+cMSCs have greater efficacy than do Nes+bmMSCs for cardiac healing after AMI, and that this occurs at least partly through Periostin-mediated M2 macrophage polarization.

Keywords: Periostin; immunomodulation; macrophage polarization; mesenchymal stromal cells; myocardial infarction.


Figures

None
Graphical abstract
Figure 1
Figure 1
Isolation and Characterization of Heart-Resident Nestin+ Cells from Nestin-GFP Reporter Mice (A) Heart-derived CD45Ter119CD31 cells were flow cytometrically isolated from the hearts of 7-day-old Nestin-GFP transgenic mice, and Nestin+ and Nestin subpopulations were divided based on GFP expression. Cells from 7-day-old non-transgenic C57BL/6 mice were isolated as a control. (B) Representative images showing the clonal sphere growth of single Nestin-GFP+ cells. Cells in the upper and lower columns were observed under bright-field and fluorescence field microscopy, respectively. Scale bars, 50 μm. (C) The expressions of cell surface markers on Nestin-GFP+ cells were detected by flow cytometry. (D) Representative stained images show that mouse heart-derived Nestin+ cells could differentiate into osteocytes (Alizarin red), adipocytes (Oil red O), and chondrocytes (toluidine blue); these findings were confirmed by qPCR analysis of the differentiation-associated genes Runx2 and SARC (osteogenesis), FabP4 and PPAR-γ (adipogenesis), and Collagen II and Collagen X (chondrogenesis). The “con” refers to undifferentiated Nestin+ cells, which represents Nestin+ cells that were cultured in the normal growth medium. Scale bars, 100 μm. Data are shown as mean ± SEM; n = 5. **p < 0.01, ***p < 0.001.
Figure 2
Figure 2
Therapeutic Effects of Nes+bmMSCs versus Nes+cMSCs on Myocardial Infarct Wound Healing and Cardiac Function (A) Schematic of protocols used for model establishment and cardiac function analysis. At 0 day, the AMI model was generated by permanent ligation of the left anterior descending (LAD) coronary artery. One minute later, the ischemic area was identified, and saline (vehicle-treated control) or Nestin+ cells (Nes+MSCs or Nes+cMSCs) were intramyocardially injected into the infarct border zone. Cardiac function, infarct degree, and inflammatory infiltration were analyzed by echocardiography, TTC staining, and H&E staining, respectively, at 1 and 3 weeks post-AMI. (B) Representative M-mode images from animals of the normal and AMI groups (treated with saline, Nes+bmMSCs, and Nes+cMSCs) at 1 and 3 weeks post-AMI. (C) Heart function was evaluated by echocardiography at 3 h (baseline), 1 week, and 3 weeks post-AMI, and LVEF, LVFS, LVEDV, and LVESV were measured. Data are shown as mean ± SEM; n = 15–20 per group. (D) Five heart sections (1 mm thick) from each group were stained with 1% TTC for visualization of the infarct area (pale) and the viable myocardial area (brick red). Scale bar, 10 mm. (E) Comparison of the relative scar areas among the study groups. The ratio of the length of the infarct band to the total length of the LV was calculated. Data are shown as mean ± SEM; n = 5. *p < 0.05, **p < 0.01, ***p < 0.001. LVEF, left ventricular ejection fraction; LVFS, left ventricular fractional shortening; LVEDV, left ventricular end-diastolic volume; LVESV, left ventricular end-systolic volume.
Figure 3
Figure 3
Transplantation of Nes+cMSCs, but Not Nes+bmMSCs, Significantly Suppresses Inflammation and Reduces the Total Number of CD68+ Macrophages within the Infarcted Area after AMI (A) Histopathologic analysis (H&E staining) of samples obtained from the saline, Nes+bmMSC, and Nes+cMSC groups at 7 days post-AMI; n = 4 per group. Scale bar, 100 μm. (B) Representative flow dot plots of MI tissue cell suspensions obtained from each group at 1, 3, and 7 days after MI. (C) Flow cytometry-based quantification of the indicated cells in the hearts of each group at 1, 3, and 7 days after MI; n = 5 per group from at least two independent experiments. (D) Gene Ontology of genes that responded to wounding (normalized with respect to the level of GAPDH); the top hits included many genes related to wound healing, among which we observed enrichment for genes involved in macrophage infiltration. (E) The mRNA levels of CD68 (a marker of total macrophages) in the infarcted areas at 3, 7, and 14 days post-AMI were analyzed; n = 4. (F and G) CD68+ macrophages in the infarcted regions at 3, 7, and 14 days post-AMI were determined under fluorescence microscopy (F) and calculated from eight random fields of view for each experiment using a double-blind method (G). Green indicates CD68+ macrophages, and blue indicates nuclei. Scale bar, 20 μm. Data are shown as mean ± SEM; n = 4. *p < 0.05, **p < 0.01, ***p < 0.001. NS, not significant.
Figure 4
Figure 4
The Depletion of Macrophages by Intravenous Injection of Clodronate Liposomes (CLs) Attenuates the Functional Recovery of the Heart Post-AMI after Nes+cMSC Treatment (A) The percentages of CD11b+CD14+ monocytes in blood and CD11b+F4/80+ macrophages in spleen and heart were analyzed by flow cytometry at 1, 3, and 7 days after CL injection. (B) Schematic of the strategies used for the systemic depletion of macrophages, AMI model establishment, and cardiac function analysis. One day before establishment of the AMI model (−1 day), mice were systematically depleted of macrophages using anionic clodronate liposomes. At 0 day, the AMI model was generated by permanent ligation of the LAD coronary artery. One minute later, the ischemic area was identified and saline (vehicle-treated control) or Nes+cMSCs were intramyocardially injected into the infarct border zone. Cardiac function and the degree of infarct were analyzed by echocardiography and TTC staining, respectively, at 3 weeks post-AMI. (C) The survival rate of mice was analyzed after macrophage depletion and Nes+cMSC treatment; n = 15–30. (D) Heart function was evaluated by echocardiography at 3 h (baseline) and 3 weeks post-AMI, and LVEF, LVFS, LVEDV, and LVESV were measured; n = 10–15. (E and F) Five heart sections (1 mm thick) from the various groups were stained with 1% TTC for visualization of the infarct area (pale) and viable myocardial area (brick red). Scale bar, 10 mm (E). Comparison of the relative scar areas among the study groups. The ratio of the length of the infarct band to the total length of the LV was calculated; n = 5 (F). Data are shown as mean ± SEM. *p < 0.05, **p < 0.01, ***p < 0.001. CL Control, clodronate-free liposomes (negative control); CL Anionic, clodronate-containing liposomes.
Figure 5
Figure 5
Treatment with Nes+cMSCs, but Not Nes+bmMSCs, Largely Increases the Proportion of M2 Macrophages in the Infarcted Myocardium In Vivo and Regulates the Polarization of M2 Macrophages In Vitro (A and B) CD68+MHC II+ M1 macrophages and CD68+CD206+ M2 macrophages were detected in the infarcted areas at 7 days post-AMI under fluorescence microscopy (A), and the percentages of CD68+MHC II+ M1 macrophages and CD68+CD206+ M2 macrophages in CD68+ total macrophages were calculated using a double-blind method (B). Scale bar, 20 μm; n = 5. (C) The percentage of CD68+CD206+ M2 macrophages was analyzed by flow cytometry after macrophages were co-cultured for 1, 2, and 3 days with or without Nes+cMSCs; n = 4. (D and E) CD68+CD206+ M2 macrophages were detected by immunofluorescence (IF) staining after 3 days of co-culture with or without Nes+cMSCs. Green indicates CD68+ macrophages, red indicates CD206+ M2 macrophages, and blue indicates nuclei (D). Scale bar, 20 μm. The percentage of CD68+CD206+ M2 macrophages was analyzed (E); n = 5. (F) The mRNA expressions of key macrophage differentiation-related enzymes (iNOS and Arg-1) were analyzed after 3 days of co-culture with or without Nes+cMSCs; n = 3. (G) The secretion levels of M1 macrophage-produced pro-inflammatory cytokines (TNF-α and IFN-γ) and M2 macrophage-secreted anti-inflammatory cytokines (IL-4 and IL-10) in supernatants after 3 days of co-culture with or without Nes+cMSCs, as examined by ELISA. Data are shown as mean ± SEM; n = 5. *p < 0.05, **p < 0.01, ***p < 0.001. n.s., not significant. LPS was used to activate macrophages toward a pro-inflammatory phenotype.
Figure 6
Figure 6
Knockdown of POSTN Impedes the Ability of Nes+cMSCs to Promote Cardiac Function Recovery by Reducing the Recruitment of M2 Macrophages to the Infarcted Site (A) From among the 46 genes found to be upregulated in Nes+cMSCs, the FPKM values of four predicted to be associated with macrophage infiltration are shown, as are the results of our qPCR-based analysis of the relative mRNA expression levels of paracrine factors in Nes+cMSCs. (B) The efficiency of the shRNA-mediated downregulation of POSTN was assessed at the mRNA and protein levels. The mRNA expression of POSTN in the Nes+cMSCcon group was regarded as 1. (C) Schematic of the protocol used for AMI model establishment and cardiac function analysis. At 0 day, the AMI model was generated by permanent ligation of the LAD coronary artery. One minute later, the ischemic area was identified and saline (vehicle-treated control), Nes+cMSCcon, or Nes+cMSCshPOSTN was intramyocardially injected into the infarct border zone. Cardiac function and infarct degree were analyzed by echocardiography and TTC staining, respectively, at 3 weeks post-AMI. The mRNA and protein levels of M2 macrophage markers in infarcted areas were analyzed by qPCR (for mRNA), flow cytometry, and immunofluorescence (IF) staining (for proteins) at 1 week post-AMI. (D) Heart functions were evaluated by echocardiography at 3 h (baseline) and 3 weeks post-AMI, and LVEF, LVFS, LVEDV, and LVESV were measured; n = 15–20. (E and F) Five heart sections (1 mm thick) from each group were stained with 1% TTC for visualization of the infarct area (pale) and the viable myocardial area (brick red). Scale bar, 10 mm (E). Comparison of the relative scar areas among the study groups. The ratio of the length of the infarct band to the total length of the LV was calculated; n = 5. (F). (G) The CD68 and CD206 expression levels of M2 macrophages in the infarct areas at 7 days post-AMI were analyzed at the mRNA level; n = 5. (H and I) The CD68+CD206+ M2 macrophages in the infarcted areas at 7 days post-AMI were analyzed by flow cytometry (H), and the percentage of CD68+CD206+ M2 macrophages was calculated (n = 5) (I). (J and K) The CD68+CD206+ M2 macrophages in the infarcted areas at 7 days post-AMI were determined under fluorescence microscopy (J). Scale bar, 20 μm. The percentage of CD68+CD206+ M2 macrophages was calculated using a double-blind method (K). Data are shown as mean ± SEM; n = 5. *p < 0.05, **p < 0.01, ***p < 0.001. n.s., not significant; shRNA, short hairpin RNA.

Similar articles

Cited by

References

    1. Lloyd-Jones D., Adams R.J., Brown T.M., Carnethon M., Dai S., De Simone G., Ferguson T.B., Ford E., Furie K., Gillespie C., American Heart Association Statistics Committee and Stroke Statistics Subcommittee Executive summary: heart disease and stroke statistics—2010 update: a report from the American Heart Association. Circulation. 2010;121:948–954. - PubMed
    1. Okwuosa I.S., Lewsey S.C., Adesiyun T., Blumenthal R.S., Yancy C.W. Worldwide disparities in cardiovascular disease: challenges and solutions. Int. J. Cardiol. 2016;202:433–440. - PubMed
    1. Oh H., Ito H., Sano S. Challenges to success in heart failure: cardiac cell therapies in patients with heart diseases. J. Cardiol. 2016;68:361–367. - PubMed
    1. Williams A.R., Hare J.M. Mesenchymal stem cells: biology, pathophysiology, translational findings, and therapeutic implications for cardiac disease. Circ. Res. 2011;109:923–940. - PMC - PubMed
    1. Carlson S., Trial J., Soeller C., Entman M.L. Cardiac mesenchymal stem cells contribute to scar formation after myocardial infarction. Cardiovasc. Res. 2011;91:99–107. - PMC - PubMed

Publication types

LinkOut - more resources