. 2020 May:138:104779.
doi: 10.1016/j.nbd.2020.104779. Epub 2020 Jan 25.

FMRP regulates presynaptic localization of neuronal voltage gated calcium channels

Affiliations

FMRP regulates presynaptic localization of neuronal voltage gated calcium channels

Laurent Ferron et al. Neurobiol Dis. 2020 May.

Abstract

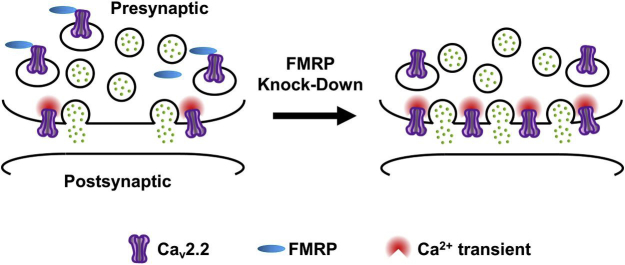
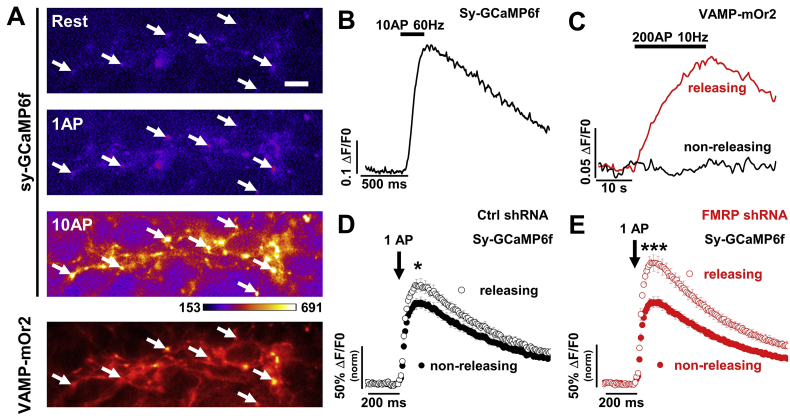
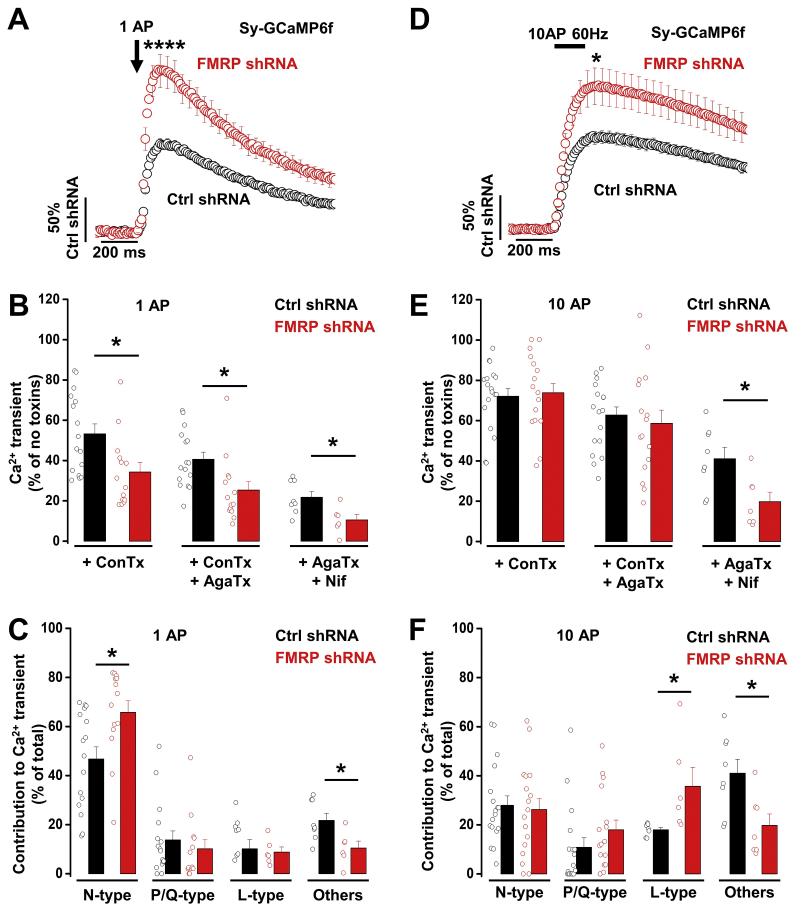
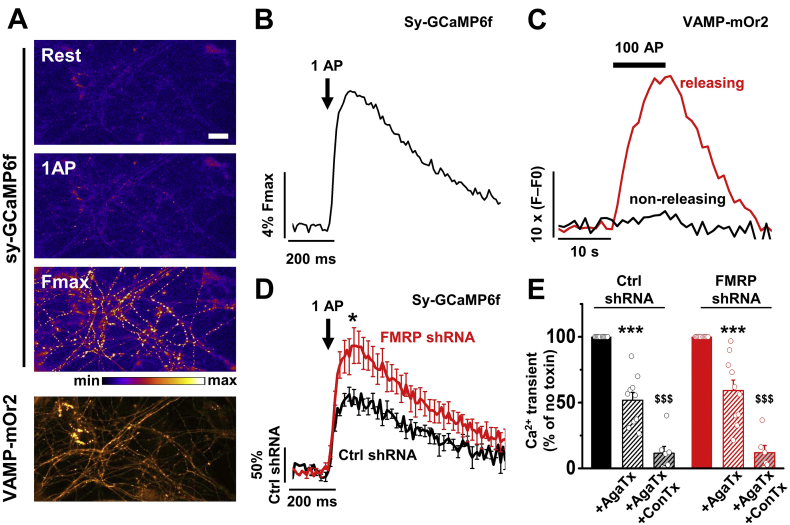
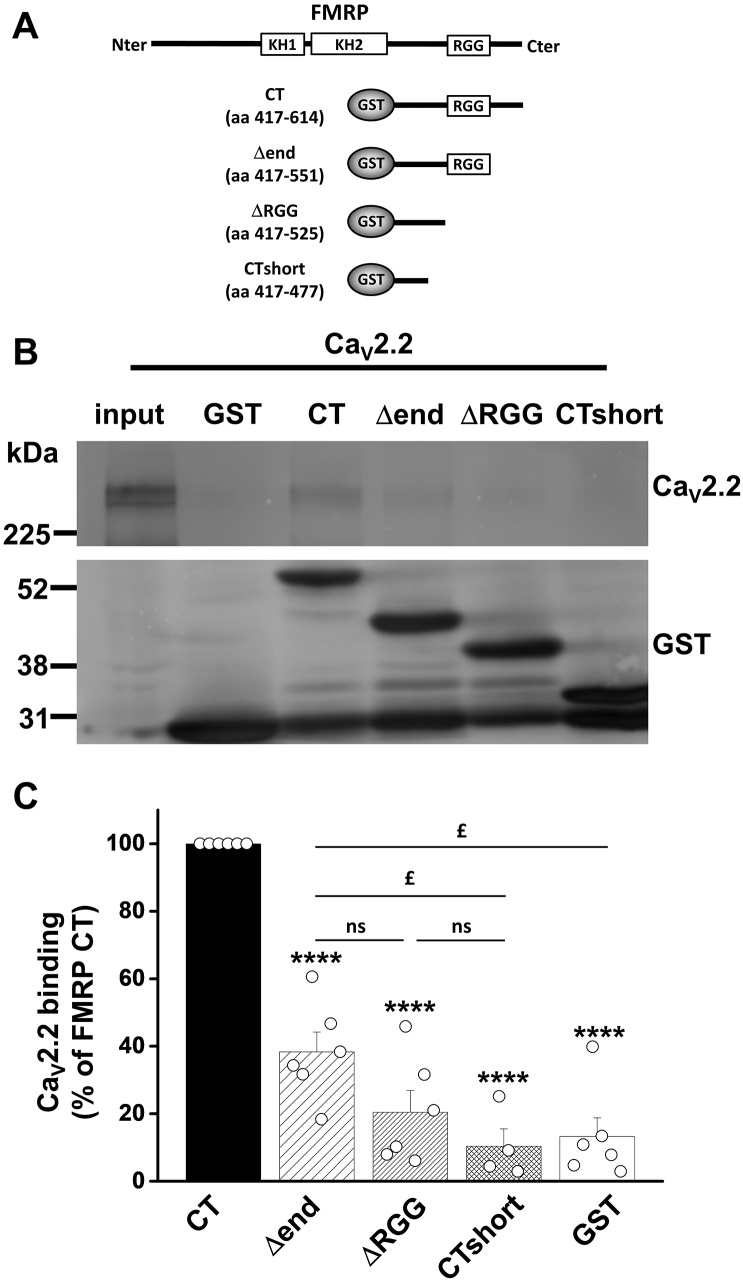
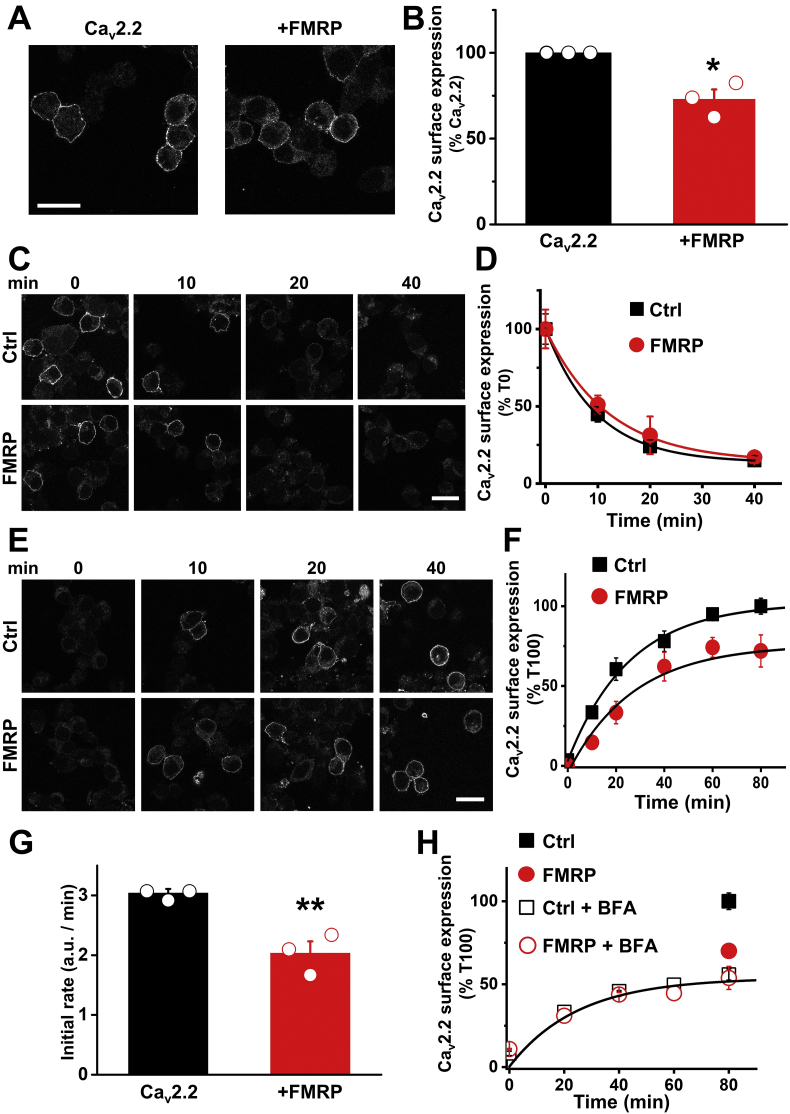
Fragile X syndrome (FXS), the most common form of inherited intellectual disability and autism, results from the loss of fragile X mental retardation protein (FMRP). We have recently identified a direct interaction of FMRP with voltage-gated Ca2+ channels that modulates neurotransmitter release. In the present study we used a combination of optophysiological tools to investigate the impact of FMRP on the targeting of voltage-gated Ca2+ channels to the active zones in neuronal presynaptic terminals. We monitored Ca2+ transients at synaptic boutons of dorsal root ganglion (DRG) neurons using the genetically-encoded Ca2+ indicator GCaMP6f tagged to synaptophysin. We show that knock-down of FMRP induces an increase of the amplitude of the Ca2+ transient in functionally-releasing presynaptic terminals, and that this effect is due to an increase of N-type Ca2+ channel contribution to the total Ca2+ transient. Dynamic regulation of CaV2.2 channel trafficking is key to the function of these channels in neurons. Using a CaV2.2 construct with an α-bungarotoxin binding site tag, we further investigate the impact of FMRP on the trafficking of CaV2.2 channels. We show that forward trafficking of CaV2.2 channels from the endoplasmic reticulum to the plasma membrane is reduced when co-expressed with FMRP. Altogether our data reveal a critical role of FMRP on localization of CaV channels to the presynaptic terminals and how its defect in a context of FXS can profoundly affect synaptic transmission.

Keywords: Calcium transients; Fragile X syndrome - FMRP; Synaptic transmission; Trafficking; Voltage-gated calcium channels.


Conflict of interest statement

Declaration of Competing Interest None.

Figures

Unlabelled Image
Graphical abstract
Fig. 1
Fig. 1
Effect of FMRP knock-down on Ca2+ transients in presynaptic terminals of DRG neurons. A) GCaMP6f fluorescence changes in presynaptic terminals of DRG neurons expressing sy-GCaMP6f and VAMP-mOr2, in response to electrical stimulation. White arrows point to some transfected boutons. Top three panels show sy-GCaMP6f fluorescence: at rest (top), after 1 AP (middle) and after 10 APs at 60 Hz (bottom). The pseudocolour scale is shown below the third panel. The bottom panel shows presynaptic terminals expressing VAMP-mOrange 2. Scale bar 5 μm. B) Example of increase of sy-GCaMP6f fluorescence (Ca2+ transients) in response to 10 APs at 60 Hz in DRG neuron terminals. The trace corresponds to the average response from 50 boutons. C) Example of variation of VAMP-mOr2 fluorescence in response to 200 APs at 10 Hz from DRG neuron terminals. Variations of VAMP-mOr2 fluorescence were used to identify vesicular release from presynaptic boutons: each individual bouton was analyzed and grouped into “non-releasing” (black trace, average of 15 boutons) or “releasing” (red trace, average of 35 boutons) groups depending on whether no variation or an increase of fluorescence was recorded in response to electrical stimulation. D) Sy-GCaMP6f fluorescence changes in response to 1 AP from non-releasing (black filled circles) and releasing (black open circles) presynaptic terminals of DRG neurons transfected with Ctrl shRNA. The Ca2+ transient was expressed as ΔF/F0 and normalized to the averaged peak recorded from non-releasing terminals (100.0 ± 7.2%, n = 31). The peak Ca2+ transient was increased to 122.8 ± 7.9% (n = 31, P = .045) in releasing terminals. Average sy-GCaMP6f responses (mean ± SEM) to 1 AP correspond to 5–6 trial averages from 25 to 50 boutons. n numbers correspond to independent experiments. * P < .05, one-way ANOVA and Bonferroni post-hoc test. E) Sy-GCaMP6f fluorescence changes in response to 1 AP from non-releasing (red filled circles) and releasing (red open circles) presynaptic terminals of DRG neurons transfected with FMRP shRNA. The Ca2+ transient was expressed as ΔF/F0 and normalized to the averaged peak recorded from non-releasing terminals (100.0 ± 6.8%, n = 34). The peak Ca2+ transient was increased to 149.6 ± 10.5% (n = 33, P = .00014) in releasing terminals. Average sy-GCaMP6f responses (mean ± SEM) to 1 AP correspond to 5–6 trial averages from 25 to 50 boutons. n numbers correspond to independent experiments. *** P < .001, one-way ANOVA and Bonferroni post-hoc test. (For interpretation of the references to color in this figure legend, the reader is referred to the web version of this article.)
Fig. 2
Fig. 2
FMRP knock-down increases Ca2+ transients in presynaptic terminals of DRG neurons via N-type calcium channels. A) Average increase of sy-GCaMP6f fluorescence in response to 1 AP recorded from synaptic terminals transfected with either Ctrl shRNA (black circles) or FMRP shRNA (red circles). The Ca2+ transient was expressed as ΔF/F0 and normalized to the averaged peak in the Ctrl shRNA condition. Peak values are 100.0 ± 6.9% (n = 31) and 186.4 ± 17.9% (n = 33, P = .00004) for Ctrl shRNA and FMRP shRNA, respectively. Average sy-GCaMP6f responses (mean ± SEM) to 1 AP correspond to 5–6 trial averages from 25 to 50 boutons. n numbers correspond to independent experiments. ****P < .0001, one-way ANOVA and Bonferroni post-hoc test. B) Effect of sequential application of specific calcium channel blockers on the amplitude of the Ca2+ transient in response to 1 AP. Average Ca2+ transients were normalized to their respective “no toxin” peak in Ctrl shRNA and FMRP shRNA condition. The residual Ca2+ transient in response to 1 AP after treatment with ω-conotoxin GVIA (ConTx, 1 μM; N-type calcium channel blocker) was 53.3 ± 1.9% (n = 16) in Ctrl shRNA and 34.3 ± 4.8% (n = 14, P = .01) in FMRP shRNA. When ω-agatoxin IVA (AgaTx, 300 nM; P/Q-type calcium channel blocker) was added to the perfusion 40.7 ± 3.5% (n = 16) and 25.4 ± 4.3% (n = 14, P = .01) of the Ca2+ transient remained for Ctrl shRNA and FMRP shRNA, respectively. After adding nifedipine (Nif, 10 μM; L-type calcium channel blocker) to the perfusion, the remaining Ca2+ transient was 21.7 ± 2.9% (n = 8) and 10.5 ± 2.8% (n = 6, P = .016) for Ctrl shRNA and FMRP shRNA, respectively. Average sy-GCaMP6f responses (mean ± SEM) to 1 AP correspond to 5–6 trial averages from 25 to 50 boutons. n numbers correspond to independent experiments. * P < .05, one-way ANOVA and Bonferroni post-hoc test. C) Respective contribution of voltage-gated calcium channels to the Ca2+ transient in response to 1 AP in presynaptic terminals of DRG neurons. In the Ctrl shRNA condition, N-type, P/Q-type, L-type channels and other types contribute to 46.7 ± 4.9% (n = 16), 13.8 ± 3.7% (n = 16), 15.7 ± 2.8% (n = 8) and 21.7 ± 2.9% (n = 8), respectively. In FMRP shRNA condition, N-type, P/Q-type, L-type channels and other types contribute to 65.7 ± 4.8% (n = 14, P = .01), 10.1 ± 3.7% (n = 13, P = .49), 8.9 ± 2.1% (n = 6, P = .09) and 10.5 ± 2.8% (n = 6, P = .016), respectively. n numbers correspond to independent experiments. * P < .05, one-way ANOVA and Bonferroni post-hoc test. D) Average increase of sy-GCaMP6f fluorescence in response to 10 APs at 60 Hz, recorded from synaptic terminals transfected with either Ctrl shRNA (black circles) or FMRP shRNA (red circles). Ca2+ transient was expressed as ΔF/F0 and normalized to the averaged peak in the Ctrl shRNA condition. Peak values are 100.0 ± 7.0% (n = 31) and 150.0 ± 19.0% (n = 34, P = .02) for Ctrl shRNA and FMRP shRNA, respectively. Average sy-GCaMP6f responses (mean ± SEM) to 1 AP correspond to 5–6 trial averages from 25 to 50 boutons. n numbers correspond to independent experiments. *P < .02, one-way ANOVA and Bonferroni post-hoc test. E) Effect of specific calcium channel blocker application on the amplitude of the Ca2+ transient in response to 10 AP at 60 Hz. The remaining Ca2+ transient after treatment with ConTx GVIA was 72.1 ± 3.8% (n = 18) in Ctrl shRNA and 73.8 ± 4.6% (n = 17, P = .77) in FMRP shRNA. After application of AgaTx the remaining Ca2+ transient was 62.8 ± 4.0% (n = 18) and 58.7 ± 6.5% (n = 16, P = .59) for Ctrl shRNA and FMRP shRNA, respectively. After application of Nif, the remaining Ca2+ transient was 41.0 ± 5.7% (n = 8) and 19.8 ± 4.7% (n = 7, P = .013) for Ctrl shRNA and FMRP shRNA, respectively. n numbers correspond to independent experiments. * P < .05, one-way ANOVA and Bonferroni post-hoc test. F) Respective contribution of voltage-gated calcium channels to the Ca2+ transient in response to 10 AP at 60 Hz in presynaptic terminals of DRG neurons. In Ctrl shRNA condition, N-type, P/Q-type, L-type channels and other types contribute to 27.9 ± 3.8% (n = 18), 10.8 ± 3.9% (n = 17), 18.0 ± 1.0% (n = 7) and 41.0 ± 5.7% (n = 8), respectively. In FMRP shRNA condition, N-type, P/Q-type, L-type channels and other types contribute to 26.2 ± 4.6% (n = 17, P = .77), 17.9 ± 4.0% (n = 16, P = .21), 35.7 ± 7.7% (n = 6, P = .03) and 19.8 ± 4.7% (n = 6, P = .013), respectively. n numbers correspond to independent experiments. * P < .05, one-way ANOVA and Bonferroni post-hoc test. Open circles (black and red) represent individual experiments. (For interpretation of the references to color in this figure legend, the reader is referred to the web version of this article.)
Fig. 3
Fig. 3
Effect of FMRP knock-down on Ca2+ transients from presynaptic terminals of hippocampal neurons. A) GCaMP6f fluorescence changes in presynaptic terminals of DRG neurons expressing VAMP-mOr2 and sy-GCaMP6f in response to electrical stimulation. Top three panels show sy-GCaMP6f fluorescence: at rest (top), after 1 AP (middle) and after ionomycin application (Fmax, bottom). Scale bar 20 μm. The pseudocolour scale is shown below the third panel. The bottom panel shows presynaptic terminals expressing VAMP-mO2. B) Example of increase of sy-GCaMP6f fluorescence (Ca2+ transients) in response to 1 AP from hippocampal neuron terminals. The trace corresponds to the mean response to 5 single APs from 50 individual boutons. The mean response was normalized to the maximum fluorescence (Fmax) obtained after application of ionomycin (5 μM). C) Example of variation of VAMP-mOr2 fluorescence (F - F0) in response to 100 AP at 10 Hz from hippocampal neuron terminals. Variations of VAMP-mOr2 fluorescence were used to identify vesicular release from presynaptic boutons: each individual bouton was analyzed and grouped into “non-releasing” and “releasing” categories when either no modification or an increase of fluorescence was recorded in response to electrical stimulation. D) Average increase of sy-GCaMP6f fluorescence in response to 1 AP recorded from pre-synaptic terminals transfected with either Ctrl shRNA (black trace) or FMRP shRNA (red trace). The Ca2+ transient was expressed as ΔF/F0 and normalized to the averaged peak in the Ctrl shRNA condition. Peak values are 100.0 ± 10.7% (n = 9) and 177.4 ± 25.5% (n = 10, P = .02) for Ctrl shRNA and FMRP shRNA, respectively. Average sy-GCaMP6f responses (mean ± SEM) to 1 AP correspond to 5–6 trial average from 50 to 75 boutons. n numbers correspond to independent experiments. *P < .05, one-way ANOVA and Bonferroni post-hoc test. E) Effect of specific calcium channel blocker application on the amplitude of the Ca2+ transient in response to 1 AP. Average Ca2+ transients were normalized to their respective no toxin peak in Ctrl shRNA and FMRP shRNA condition. The remaining Ca2+ transient in response to 1AP after treatment with AgaTx (300 nM; P/Q-type calcium channel blocker) was 51.8 ± 6.0% (n = 10) in Ctrl shRNA and 59.2 ± 8.0% (n = 10, P = .5, one-way ANOVA) in FMRP shRNA. In a subset of experiments, ConTx (1 μM; N-type calcium channel blocker) was added to the perfusion 11.5 ± 5.2% (n = 7) and 12.0 ± 5.5% (n = 6) of the Ca2+ transients remained for Ctrl shRNA and FMRP shRNA, respectively. Average sy-GCaMP6f responses (mean ± SEM) to 1 AP correspond to 5–6 trial average from 50 to 75 boutons. n numbers correspond to independent experiments. Open circles (black and red) represent individual experiments. *** P < .001, vs no toxin, paired t-test; $$$P < .001, vs + AgaTx, one-way ANOVA and Bonferroni post-hoc test. (For interpretation of the references to color in this figure legend, the reader is referred to the web version of this article.)
Fig. 4
Fig. 4
Distal FMRP C-terminus interacts with CaV2.2. A) Schematic depiction of FMRP and GST-fusion fragments used for pull-down assay. Nter, N-terminus; Cter, C-terminus; KH1 and KH2, K-homology domains 1 and 2; RGG, arginine-glycine-glycine motif; aa, amino acid; CT, GST-FMRP C-terminus; Δend, GST-FMRP C-terminus deleted from the last 63 amino acids; ΔRGG, GST-FMRP C-terminus deleted from the last 89 amino acids which includes the RGG motif; CTshort, GST-FMRP C-terminus deleted from the last 137 amino acids. B) Western blots of pull-down assays show FMRP C-terminus binding CaV2.2 expressed in tsA-201 cells compared with several deletant mutants for FMRP C-terminus and GST alone. Top panel shows immunoblots with CaV2.2 II-III loop Ab. Lower panel shows immunoblots with GST Ab. Input represents 5% of protein input included in the assay. Representative of more than 4 independent experiments. C) Binding of CaV2.2 expressed as a percentage of FMRP C-terminus (CT). Serial deletions of FMRP C-terminus resulted in 61.7 ± 5.8% (n = 6), 79.5 ± 6.4% (n = 6), 89.6 ± 5.1% (n = 4) and 86.7 ± 5.5% (n = 6) reductions of the binding for Δend, ΔRGG, CTshort and GST, respectively. n numbers correspond to independent experiments. Open black circles represent individual experiments. **** P < .0001 compared with CT, £P < .05, ns: not significant, one-way ANOVA and Bonferroni post-hoc test.
Fig. 5
Fig. 5
Endocytosis & forward trafficking. A) Representative confocal images of N2a cells expressing CaV2.2-BBS 40 h after transfection and labelled with BTX-AF488. Cells were co-transfected with β1b, α2δ-1 and either empty vector (Ctrl, left panel) or FMRP (right panel). Cells were incubated at 17 °C with BTX-AF488 for 30 min and then fixed and imaged. Scale bar, 20 μm. B) CaV2.2-BBS surface expression in Ctrl (black bar) and with co-expression of FMRP (red bar). BTX-AF488 fluorescence was reduced by 26% when FMRP was co-expressed (FMRP: 73.8 ± 5.8%, n = 3, P = .042, Paired t-test, n number corresponds to independent experiments). Solid bars are mean (± SEM) and open circles individual data points. C) Confocal images of N2a cells expressing CaV2.2-BBS and labelled with BTX-AF488. Cells were co-transfected with β1b, α2δ-1 and either empty vector (Ctrl, top panels) or FMRP (bottom panels). Cells were incubated at 17 °C with BTX-AF488 for 30 min and then imaged at different time points, from 0 to 40 min after elevation to 37 °C. Scale bar, 20 μm. D) Time course of endocytosis of cell surface CaV2.2-BBS in Ctrl (black squares) and + FMRP (red circles). BTX-AF488 fluorescence was normalized to the mean fluorescence at the time point 0 for each condition. The results are shown as the mean ± SEM (n > 120 cells per time point from 2 independent experiments). The data were fitted with single exponentials. The time constants of the fits were 9.7 ± 0.3 min and 12.0 ± 0.3 min for Ctrl and + FMRP, respectively. E) Confocal images of N2A cells expressing CaV2.2-BBS and labelled with BTX-AF488. Cells were co-transfected with β1b, α2δ-1 and either empty vector (Ctrl, top panels) or FMRP (bottom panels). Cells were incubated at 17 °C with unlabelled BTX for 30 min, then incubated with BTX-AF488 at 37 °C and imaged at different time points, from zero to 80 min. Scale bar, 20 μm. F) Time course of insertion of CaV2.2-BBS at the cell surface in Ctrl (black squares) and + FMRP (red circles). BTX-AF488 fluorescence was normalized to the mean fluorescence of the Ctrl condition at the time point 80 min. The results are shown as the mean ± SEM (n > 120 cells per time point from 3 independent experiments). The data were fitted with single exponentials. The time constants of the fits were 25.6 ± 2.4 min and 27.0 ± 5.3 min for Ctrl and + FMRP, respectively. G) Initial rates of net forward trafficking of CaV2.2-BBS in Ctrl (black bar) and + FMRP (red bar). Rates of forward trafficking were determined by taking the slope of the linear phase between 0 and 20 min for each condition. Ctrl: 3.0 ± 0.1 a.u./min (n = 3 independent experiments) and FMRP: 2.0 ± 0.2 a.u./min (n = 3 independent experiments; ** P = .009, one-way ANOVA). Solid bars are mean (± SEM) and open circles individual data points. H) Time course of insertion of CaV2.2-BBS into the cell surface in the presence of BFA in Ctrl (open black squares) and + FMRP (open red circles). Controls without BFA at 80 min are also shown (Ctrl, filled black square; +FMRP, filled red circle). The results are shown as mean ± SEM (n > 80 cells per time point from 2 independent experiments). The data were fitted with single exponentials. The time constants of the fits after treatment with BFA were 27.4 ± 2.7 min and 24.9 ± 4.4 min for Ctrl and + FMRP, respectively. The initial rates of net forward trafficking after treatment with BFA were 1.14 ± 0.01 a.u./min and 1.10 ± 0.03 a.u./min for Ctrl and + FMRP, respectively. (For interpretation of the references to color in this figure legend, the reader is referred to the web version of this article.)

References

    1. de Juan-Sanz J., Holt G.T., Schreiter E.R., de Juan F., Kim D.S., Ryan T.A. Axonal endoplasmic reticulum Ca(2+) content controls release probability in CNS nerve terminals. Neuron. 2017;93 (867–881 e866) - PMC - PubMed
    1. Abriel H., Staub O. Ubiquitylation of ion channels. Physiology (Bethesda) 2005;20:398–407. - PubMed
    1. Albuquerque C., Joseph D.J., Choudhury P., MacDermott A.B. Cold Spring Harb Protoc 2009, pdb prot5275. 2009. Dissection, plating, and maintenance of dorsal root ganglion neurons for monoculture and for coculture with dorsal horn neurons. - PubMed
    1. Altier C., Garcia-Caballero A., Simms B., You H., Chen L., Walcher J., Tedford H.W., Hermosilla T., Zamponi G.W. The Cavbeta subunit prevents RFP2-mediated ubiquitination and proteasomal degradation of L-type channels. Nat. Neurosci. 2011;14:173–180. - PubMed
    1. Banerjee A., Ifrim M.F., Valdez A.N., Raj N., Bassell G.J. Aberrant RNA translation in fragile X syndrome: from FMRP mechanisms to emerging therapeutic strategies. Brain Res. 2018;1693:24–36. - PMC - PubMed

Publication types

MeSH terms