

Dynamic Shifts in the HIV Proviral Landscape During Long Term Combination Antiretroviral Therapy: Implications for Persistence and Control of HIV Infections
- PMID: 31991737
- PMCID: PMC7077288
- DOI: 10.3390/v12020136
Dynamic Shifts in the HIV Proviral Landscape During Long Term Combination Antiretroviral Therapy: Implications for Persistence and Control of HIV Infections
Abstract
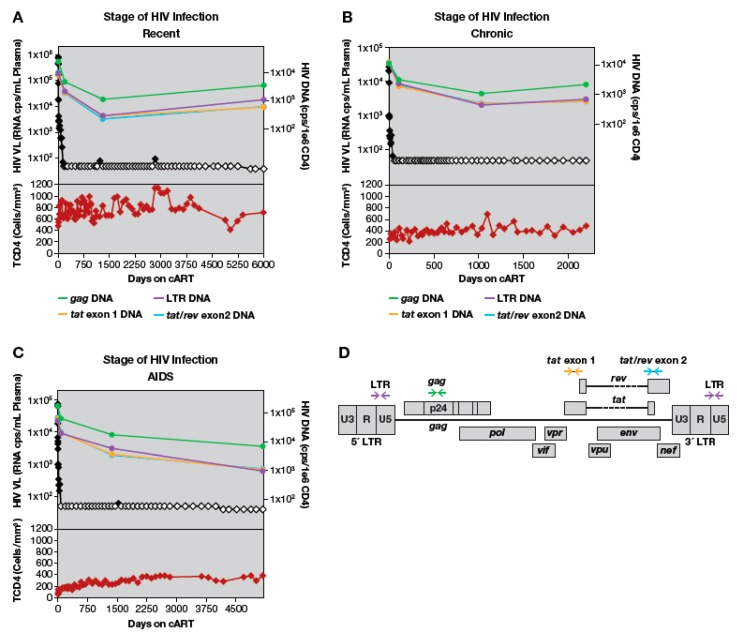
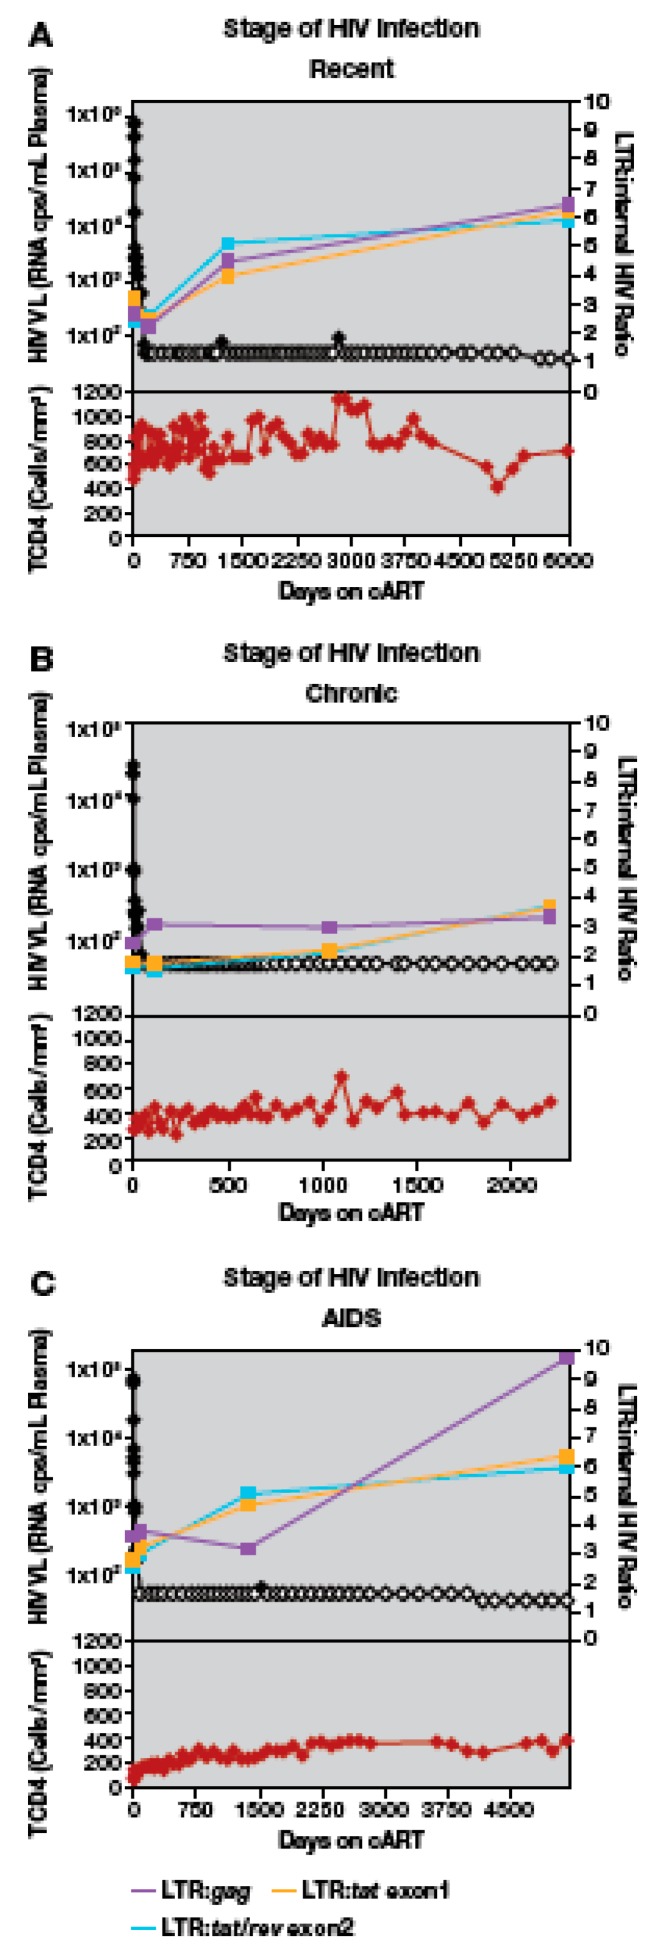
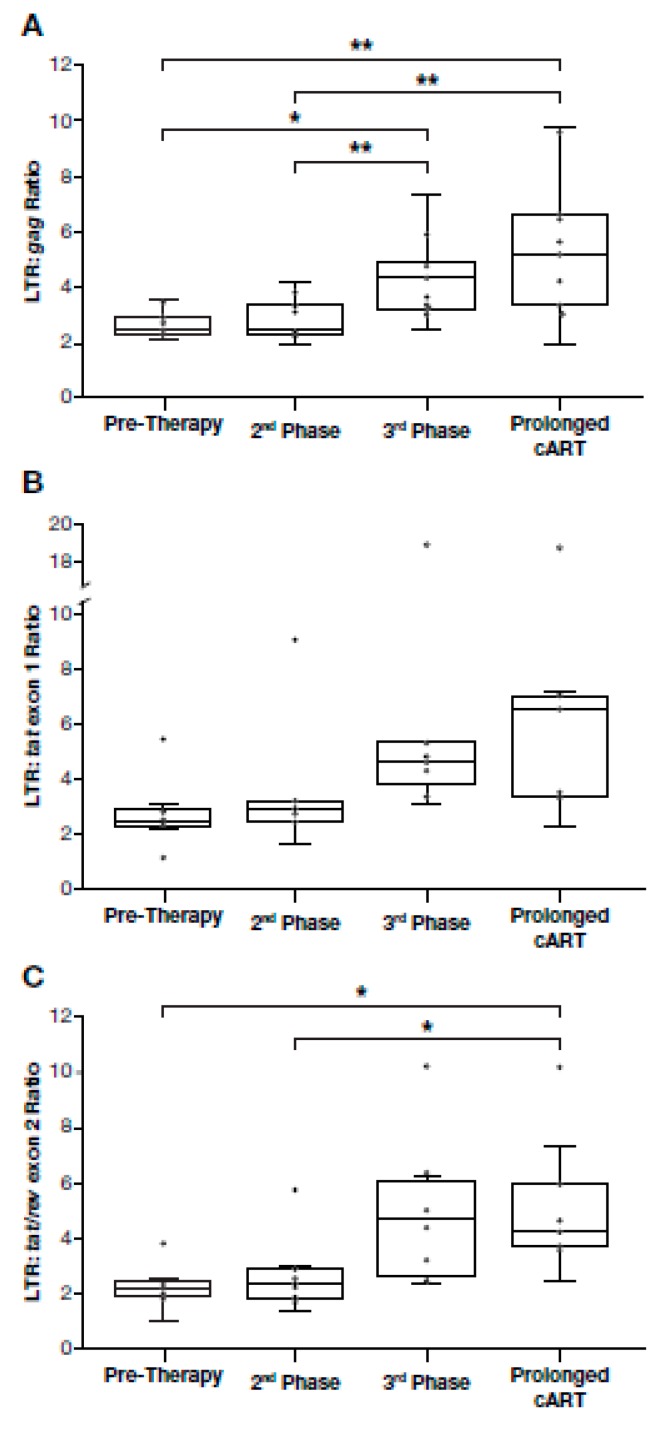
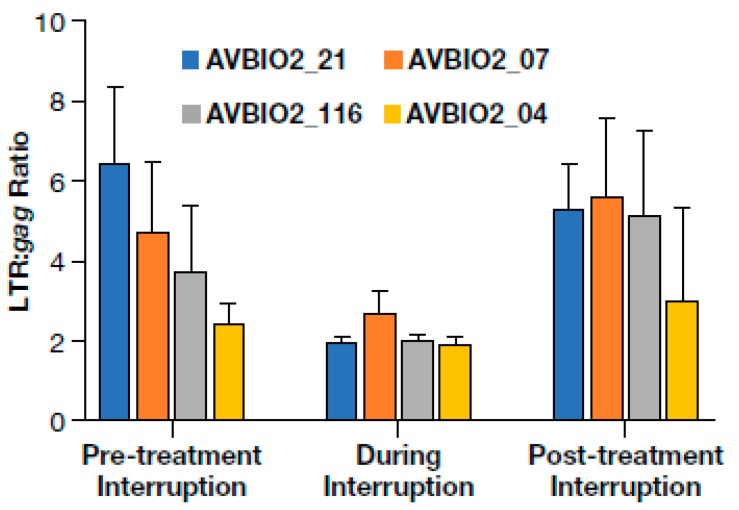
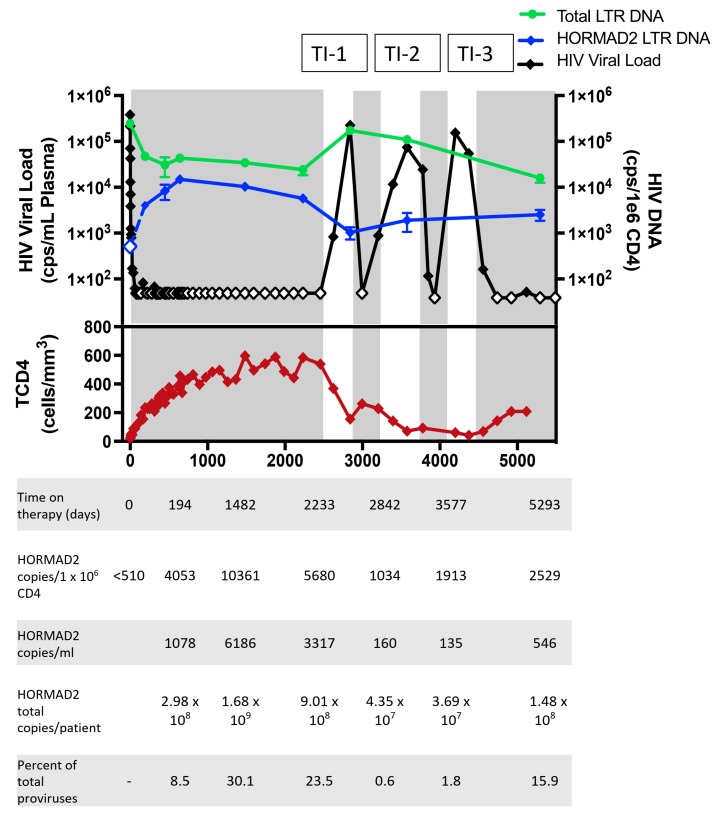
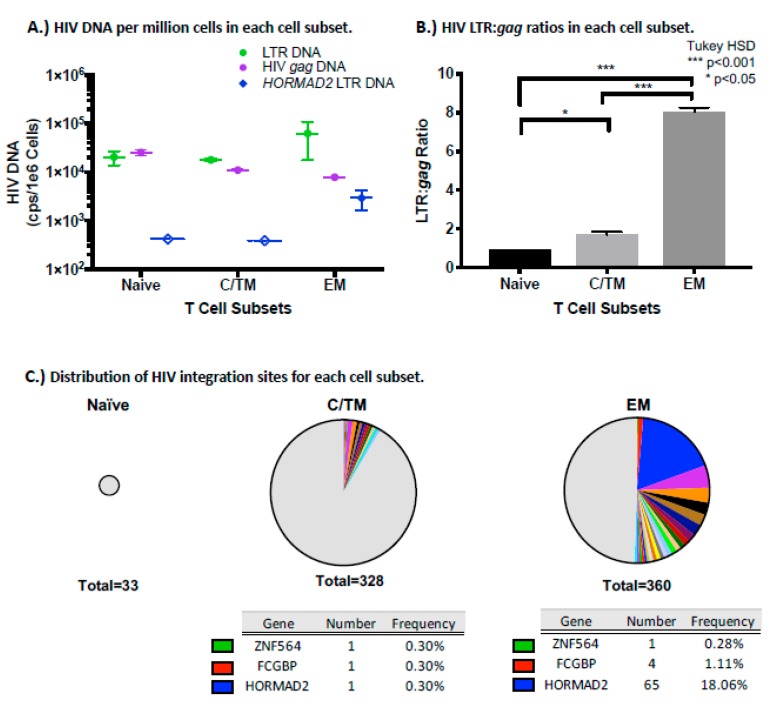
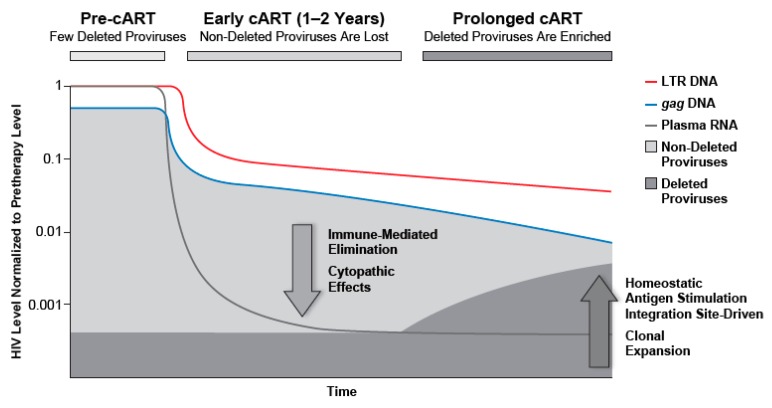
Combination antiretroviral therapy (cART) controls but does not eradicate HIV infection; HIV persistence is the principal obstacle to curing infections. The proportion of defective proviruses increases during cART, but the dynamics of this process are not well understood, and a quantitative analysis of how the proviral landscape is reshaped after cART is initiated is critical to understanding how HIV persists. Here, we studied longitudinal samples from HIV infected individuals undergoing long term cART using multiplexed Droplet Digital PCR (ddPCR) approaches to quantify the proportion of deleted proviruses in lymphocytes. In most individuals undergoing cART, HIV proviruses that contain gag are lost more quickly than those that lack gag. Increases in the fraction of gag-deleted proviruses occurred only after 1-2 years of therapy, suggesting that the immune system, and/or toxicity of viral re-activation helps to gradually shape the proviral landscape. After 10-15 years on therapy, there were as many as 3.5-5 times more proviruses in which gag was deleted or highly defective than those containing intact gag. We developed a provirus-specific ddPCR approach to quantify individual clones. Investigation of a clone of cells containing a deleted HIV provirus integrated in the HORMAD2 gene revealed that the cells underwent a massive expansion shortly after cART was initiated until the clone, which was primarily in effector memory cells, dominated the population of proviruses for over 6 years. The expansion of this HIV-infected clone had substantial effects on the overall proviral population.
Keywords: HIV clonal expansion; HIV persistence; ddPCR; proviruses.
Conflict of interest statement
The authors declare no conflict of interest.
Figures
Similar articles
-
Genetic Diversity, Compartmentalization, and Age of HIV Proviruses Persisting in CD4+ T Cell Subsets during Long-Term Combination Antiretroviral Therapy.J Virol. 2020 Feb 14;94(5):e01786-19. doi: 10.1128/JVI.01786-19. Print 2020 Feb 14. J Virol. 2020. PMID: 31776273 Free PMC article.
-
The role of integration and clonal expansion in HIV infection: live long and prosper.Retrovirology. 2018 Oct 23;15(1):71. doi: 10.1186/s12977-018-0448-8. Retrovirology. 2018. PMID: 30352600 Free PMC article. Review.
-
Intact HIV Proviruses Persist in Children Seven to Nine Years after Initiation of Antiretroviral Therapy in the First Year of Life.J Virol. 2020 Jan 31;94(4):e01519-19. doi: 10.1128/JVI.01519-19. Print 2020 Jan 31. J Virol. 2020. PMID: 31776265 Free PMC article.
-
Selective decline of intact HIV reservoirs during the first decade of ART followed by stabilization in memory T cell subsets.AIDS. 2025 Jun 1;39(7):798-811. doi: 10.1097/QAD.0000000000004160. Epub 2025 Feb 20. AIDS. 2025. PMID: 39964317 Free PMC article.
-
New Approaches to Multi-Parametric HIV-1 Genetics Using Multiple Displacement Amplification: Determining the What, How, and Where of the HIV-1 Reservoir.Viruses. 2021 Dec 10;13(12):2475. doi: 10.3390/v13122475. Viruses. 2021. PMID: 34960744 Free PMC article. Review.
Cited by
-
Dynamics of HIV Reservoir and HIV-1 Viral Splicing in HCV-Exposed Individuals after Elimination with DAAs or Spontaneous Clearance.J Clin Med. 2022 Jun 21;11(13):3579. doi: 10.3390/jcm11133579. J Clin Med. 2022. PMID: 35806864 Free PMC article.
-
A widely distributed HIV-1 provirus elimination assay to evaluate latency-reversing agents in vitro.Cell Rep Methods. 2021 Nov 29;1(8):100122. doi: 10.1016/j.crmeth.2021.100122. eCollection 2021 Dec 20. Cell Rep Methods. 2021. PMID: 35475215 Free PMC article.
-
Unequal distribution of genetically-intact HIV-1 proviruses in cells expressing the immune checkpoint markers PD-1 and/or CTLA-4.Front Immunol. 2023 Jan 26;14:1064346. doi: 10.3389/fimmu.2023.1064346. eCollection 2023. Front Immunol. 2023. PMID: 36776833 Free PMC article.
-
Research priorities for an HIV cure: International AIDS Society Global Scientific Strategy 2021.Nat Med. 2021 Dec;27(12):2085-2098. doi: 10.1038/s41591-021-01590-5. Epub 2021 Dec 1. Nat Med. 2021. PMID: 34848888 Review.
-
The Immunophenotype and Proviral Landscape of HIV-infected CD4 T Cells During Antiretroviral Therapy.bioRxiv [Preprint]. 2025 Jun 5:2025.06.05.657210. doi: 10.1101/2025.06.05.657210. bioRxiv. 2025. PMID: 40501793 Free PMC article. Preprint.
References
-
- Bozzi G., Simonetti F., Watters S.A., Anderson E.M., Gouzoulis M., Kearney M., Rote P., Lange C., Shao W., Gorelick R., et al. No Evidence of Ongoing HIV Replication or Compartmentalization in Tissues During Combination Antiretroviral Therapy: Implications for HIV Eradication. Sci. Adv. 2019;5:eaav2045. doi: 10.1126/sciadv.aav2045. - DOI - PMC - PubMed
-
- Palella F.J., Jr., Delaney K.M., Moorman A.C., Loveless M.O., Fuhrer J., Satten G.A., Aschman D.J., Holmberg S.D. Declining morbidity and mortality among patients with advanced human immunodeficiency virus infection. HIV Outpatient Study Investigators. N. Engl. J. Med. 1998;338:853–860. doi: 10.1056/NEJM199803263381301. - DOI - PubMed
-
- Palella F.J., Jr., Baker R.K., Moorman A.C., Chmiel J.S., Wood K.C., Brooks J.T., Holmberg S.D., Investigators H.I.V.O.S. Mortality in the highly active antiretroviral therapy era: Changing causes of death and disease in the HIV outpatient study. J. Acquir. Immune Defic. Syndr. 2006;43:27–34. doi: 10.1097/01.qai.0000233310.90484.16. - DOI - PubMed
MeSH terms
Substances
Grants and funding
LinkOut - more resources
Full Text Sources
Medical
Molecular Biology Databases
