Tumor Infiltrating Neutrophils Are Enriched in Basal-Type Urothelial Bladder Cancer
- PMID: 31991796
- PMCID: PMC7072276
- DOI: 10.3390/cells9020291
Tumor Infiltrating Neutrophils Are Enriched in Basal-Type Urothelial Bladder Cancer
Abstract
Background: Urothelial bladder cancers (UBCs) are distinct in two main molecular subtypes, namely basal and luminal type. Subtypes are also diverse in term of immune contexture, providing a rationale for patient selection to immunotherapy.
Methods: By digital microscopy analysis of a muscle-invasive BC (MIBC) cohort, we explored the density and clinical significance of CD66b+ tumor-associated-neutrophils (TAN) and CD3+ T cells. Bioinformatics analysis of UBC datasets and gene expression analysis of UBC cell lines were additionally performed.
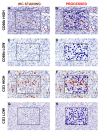
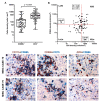
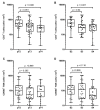
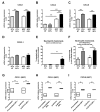
Results: Basal type BC contained a significantly higher density of CD66b+ TAN compared to the luminal type. This finding was validated on TCGA, GSE32894 and GSE124305 datasets by computing a neutrophil signature. Of note, basal-type MIBC display a significantly higher level of chemokines (CKs) attracting neutrophils. Moreover, pro-inflammatory stimuli significantly up-regulate CXCL1, CXCL2 and CXCL8 in 5637 and RT4 UBC cell lines and induce neutrophil chemotaxis. In term of survival, a high density of T celsl and TAN was significantly associated to a better outcome, with TAN density showing a more limited statistical power and following a non-linear predicting model.
Conclusions: TAN are recruited in basal type MIBC by pro-inflammatory CKs. This finding establishes a groundwork for a better understanding of the UBC immunity and its relevance.
Keywords: CD3; CD66b; basal; bladder cancer; tumor-associated neutrophils.
Conflict of interest statement
The authors declare no competing financial interests.
Figures


Similar articles
-
The prognostic values of tumor-infiltrating neutrophils, lymphocytes and neutrophil/lymphocyte rates in bladder urothelial cancer.Pathol Res Pract. 2018 Aug;214(8):1074-1080. doi: 10.1016/j.prp.2018.05.010. Epub 2018 May 20. Pathol Res Pract. 2018. PMID: 29803657
-
Hyper-Activation of STAT3 Sustains Progression of Non-Papillary Basal-Type Bladder Cancer via FOSL1 Regulome.Cancers (Basel). 2019 Aug 21;11(9):1219. doi: 10.3390/cancers11091219. Cancers (Basel). 2019. PMID: 31438567 Free PMC article.
-
Presence of lymphocytic infiltrate cytotoxic T lymphocyte CD3+, CD8+, and immunoscore as prognostic marker in patients after radical cystectomy.PLoS One. 2018 Oct 11;13(10):e0205746. doi: 10.1371/journal.pone.0205746. eCollection 2018. PLoS One. 2018. PMID: 30308033 Free PMC article.
-
Mouse Models of Muscle-invasive Bladder Cancer: Key Considerations for Clinical Translation Based on Molecular Subtypes.Eur Urol Oncol. 2019 May;2(3):239-247. doi: 10.1016/j.euo.2018.08.014. Epub 2018 Sep 13. Eur Urol Oncol. 2019. PMID: 31200837 Review.
-
Key signaling pathways in the muscle-invasive bladder carcinoma: Clinical markers for disease modeling and optimized treatment.Int J Cancer. 2016 Jun 1;138(11):2562-9. doi: 10.1002/ijc.29918. Epub 2015 Nov 23. Int J Cancer. 2016. PMID: 26547270 Review.
Cited by
-
Loss of Cxcr2 in Myeloid Cells Promotes Tumour Progression and T Cell Infiltration in Invasive Bladder Cancer.Bladder Cancer. 2022 Sep 15;8(3):277-290. doi: 10.3233/BLC-211645. eCollection 2022. Bladder Cancer. 2022. PMID: 38993683 Free PMC article.
-
Immune Profiling Reveals Molecular Classification and Characteristic in Urothelial Bladder Cancer.Front Cell Dev Biol. 2021 Mar 11;9:596484. doi: 10.3389/fcell.2021.596484. eCollection 2021. Front Cell Dev Biol. 2021. PMID: 33777927 Free PMC article.
-
Siglec-15 as a New Perspective Therapy Target in Human Giant Cell Tumor of Bone.Curr Oncol. 2022 Oct 13;29(10):7655-7671. doi: 10.3390/curroncol29100605. Curr Oncol. 2022. PMID: 36290882 Free PMC article.
-
Role of the Transcription Factor FOSL1 in Organ Development and Tumorigenesis.Int J Mol Sci. 2022 Jan 28;23(3):1521. doi: 10.3390/ijms23031521. Int J Mol Sci. 2022. PMID: 35163444 Free PMC article. Review.
-
Targeting S1PR1 May Result in Enhanced Migration of Cancer Cells in Bladder Carcinoma.Cancers (Basel). 2021 Sep 5;13(17):4474. doi: 10.3390/cancers13174474. Cancers (Basel). 2021. PMID: 34503284 Free PMC article.
References
MeSH terms
Substances
LinkOut - more resources
Full Text Sources
Medical
Research Materials
Miscellaneous

