. 2020 Jan 26;21(3):808.
doi: 10.3390/ijms21030808.

Endothelial response boosted by platelet lysate: the involvement of calcium toolkit

Affiliations

Endothelial response boosted by platelet lysate: the involvement of calcium toolkit

Simona Martinotti et al. Int J Mol Sci. .

Abstract

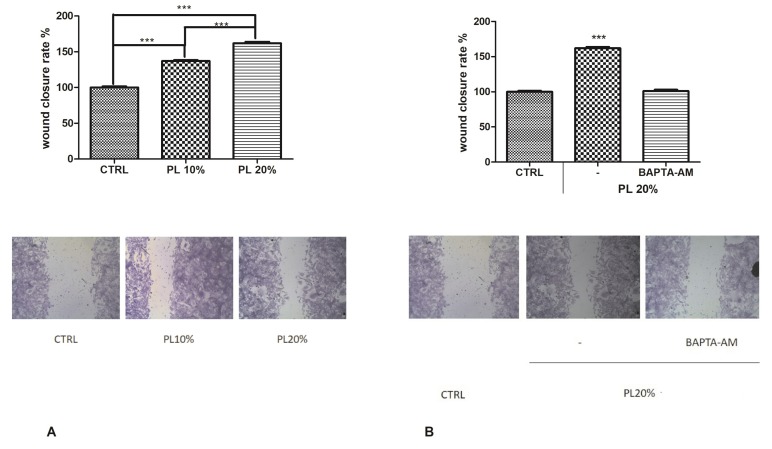
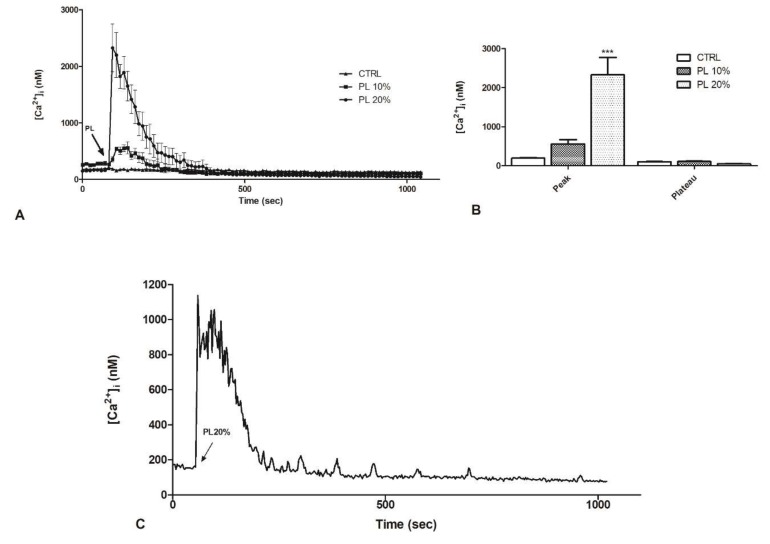
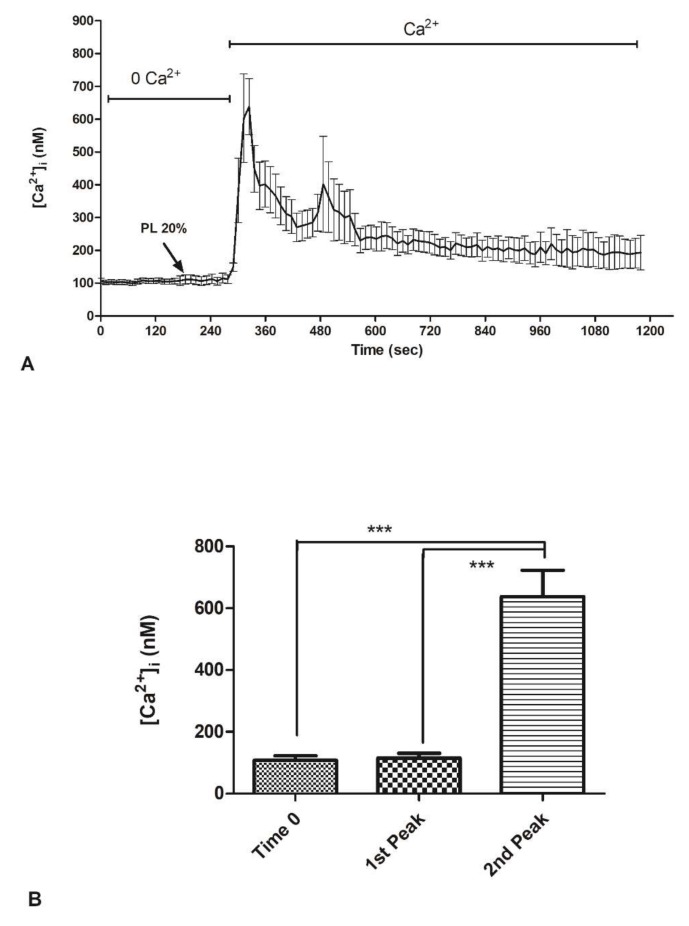
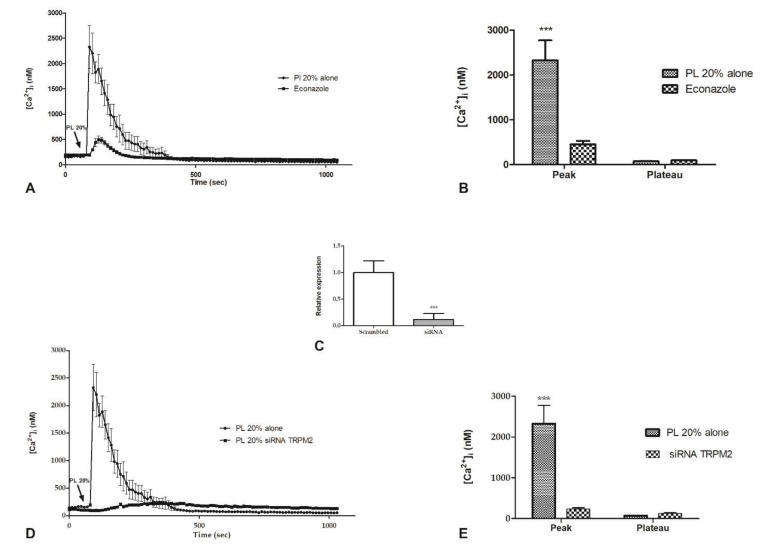
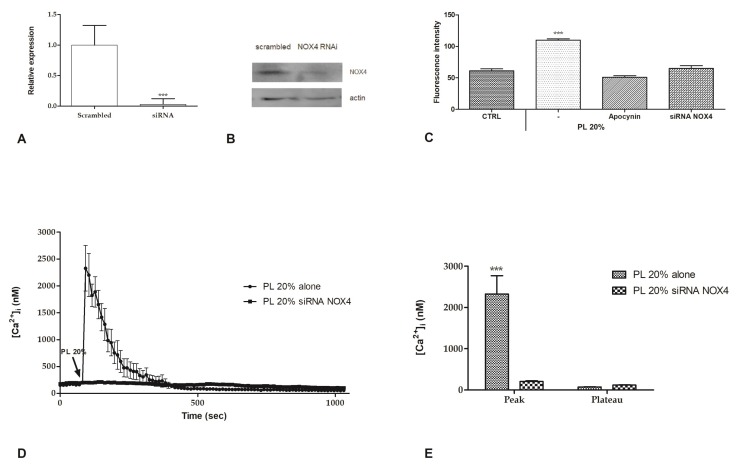
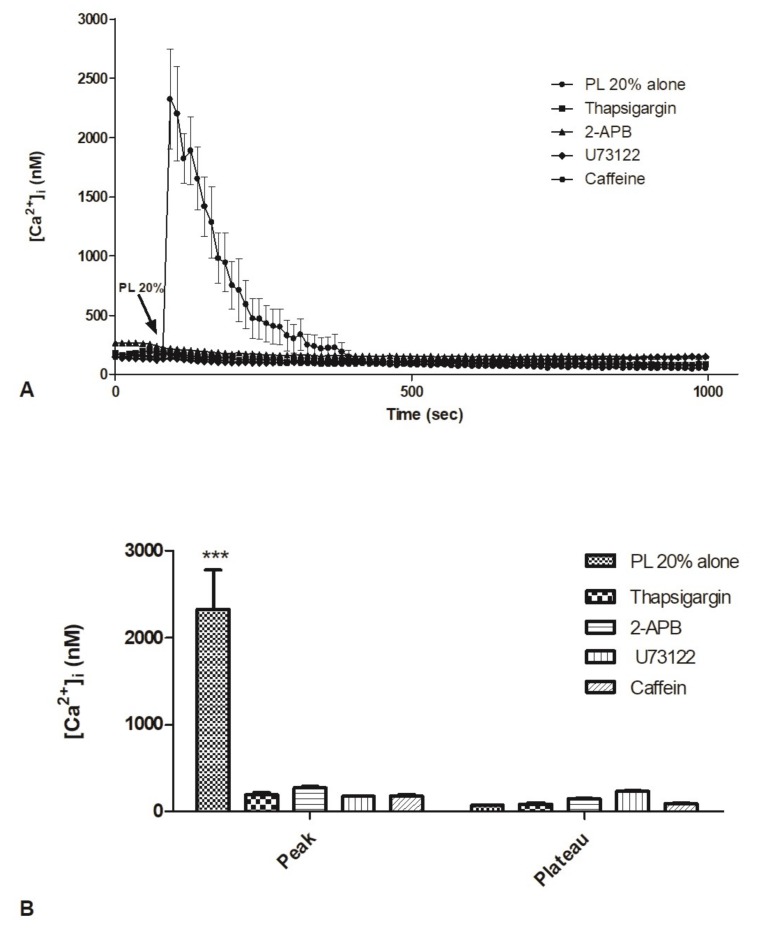
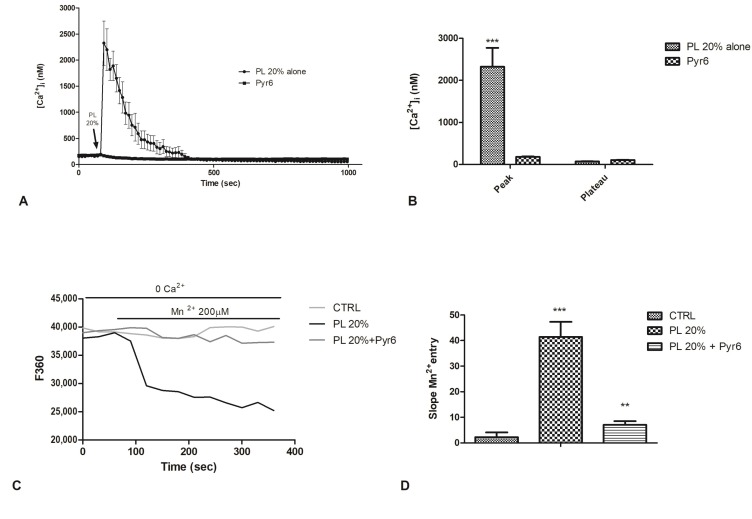
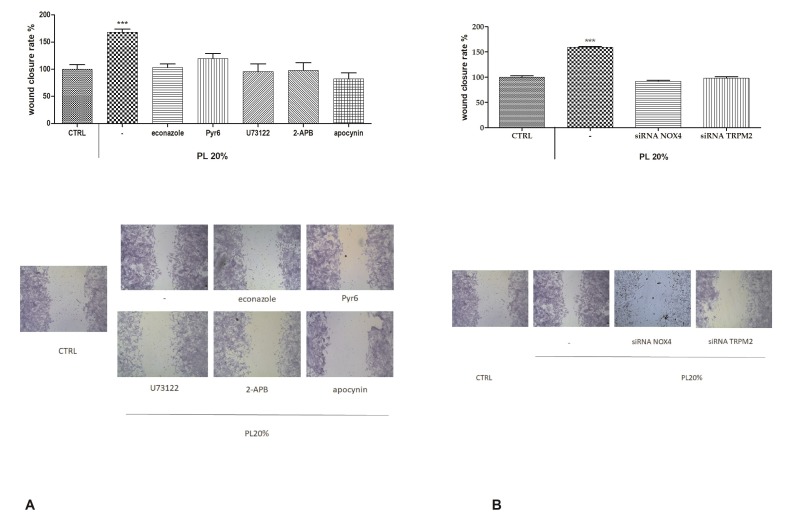
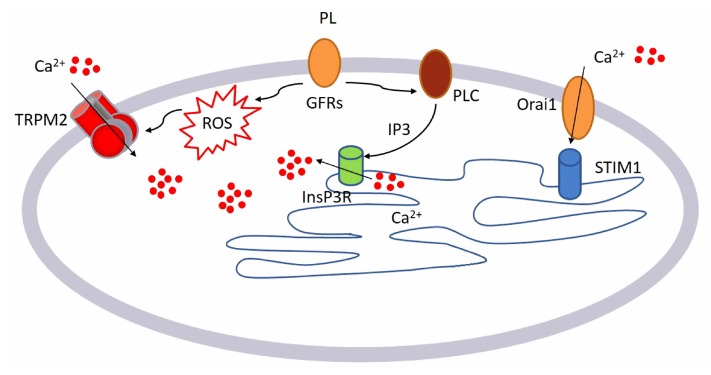
Wound repair is a dynamic process during which crucial signaling pathways are regulated by growth factors and cytokines released by several kinds of cells directly involved in the healing process. However, the limited applications and heterogeneous clinical results of single growth factors in wound healing encouraged the use of a mixture of bioactive molecules such as platelet derivatives for best results in wound repair. An interesting platelet derivative, obtained from blood samples, is platelet lysate (PL), which has shown potential clinical application. PL is obtained from freezing and thawing of platelet-enriched blood samples. Intracellular calcium (Ca2+) signals play a central role in the control of endothelial cell survival, proliferation, motility, and differentiation. We investigated the role of Ca2+ signaling in the PL-driven endothelial healing process. In our experiments, the functional significance of Ca2+ signaling machinery was highlighted performing the scratch wound assay in presence of different inhibitors or specific RNAi. We also pointed out that the PL-induced generation of intracellular ROS (reactive oxygen species) via NOX4 (NADPH oxidase 4) is necessary for the activation of TRPM2 and the resulting Ca2+ entry from the extracellular space. This is the first report of the mechanism of wound repair in an endothelial cell model boosted by the PL-induced regulation of [Ca2+]i.

Keywords: ROS; cell calcium; endothelial cells; platelet lysate; wound repair.


Conflict of interest statement

The authors declare that there is no conflict of interests.

Figures

Figure 1
Figure 1
Platelet lysate (PL)-induced wound closure. (A) Upper panel: Effect of different concentrations of PL in scratch wound repair of bEND5 monolayers. PL was used; 10% and 20% v/v. CTRL are cells in control conditions, i.e., cells grown in DMEM with 10% FBS as described in the Materials and Methods section. Wound closure rate is expressed as the difference between wound width at 0 and 24 h. Data were recorded 24 h after scratch wound healing of cells exposed to PL. Bars represent mean ± S.E.M. of wound closure derived from two independent experiments, each with n = 20. Different asterisks on bars indicate statistical differences determined by one-way ANOVA with Tukey’s test (p < 0.05). Lower panel: Micrographs of scratch-wounded bEND5 monolayers incubated under control conditions (cells incubated in DMEM with 10% FBS) or in the presence of 10% and 20% PL and then stained with blue toluidine and observed 24 h after wounding. (B) Upper panel: Role of intracellular Ca2+ in PL-induced scratch wound repair of endothelial monolayers, in presence or not of 30 µM BAPTA-AM. Wound closure rate is expressed as the difference between wound width at 0 and 24 h. Data were recorded 24 h after scratch wound healing of cells exposed to PL. Bars represent mean ± S.E.M. of wound closure inhibition deriving from two independent experiments, each with n = 20. Asterisks on bars indicate statistical differences determined by one-way ANOVA with Tukey’s test (p < 0.001). Lower panel: Micrographs of scratch-wounded bEND5 monolayers incubated under control conditions (as described above) or in the presence of PL and BAPTA-AM and then stained with blue toluidine and observed 24 h after wounding.
Figure 2
Figure 2
PL induces a dose-dependent increase in intracellular Ca2+ concentration in bEND5 cells. (A) [Ca2+]i variations recorded at 10 s intervals, showing no variations in control conditions (CTRL, i.e., cells incubated in confocal microscopy loading buffer, as described in Materials and Methods section), and distinct patterns of Ca2+ signaling after exposure to 10% and 20% PL. Data are means ± s.e.m. of [Ca2+]i traces recorded in different cells. Number of cells: CTRL: 20 cells from 2 experiments; 10% PL: 40 cells from 3 experiments; 20% PL: 40 cells from 3 experiments. (B) Mean ± s.e.m. of the peak Ca2+ response induced by treatment with 10% or 20% PL. Number of cells: CTRL: 20 cells from 2 experiments; 10% PL: 40 cells from 3 experiments; 20% PL: 40 cells from 3 experiments. Asterisks on bars indicate statistical differences determined by two-way ANOVA with Bonferroni’s correction (p < 0.001). C. [Ca2+]i variations recorded at 1 s intervals induced by 20% PL. Data are means ± s.e.m. of [Ca2+]i traces recorded in 40 different cells.
Figure 3
Figure 3
PL-induced Ca2+ entry from the extracellular space in bEND5 cells. (A) To monitor exclusively intracellular Ca2+ mobilization, bEND5 cells were stimulated with 20% PL in the absence of external Ca2+ (0Ca2+). When Ca2+ has been added back to the medium, there was [Ca2+]i increase. (B) Mean ± s.e.m. of the Ca2+ response at time zero and to 20% PL recorded after PL addition (first peak) and at the peak after Ca2+ supplement in extracellular space (second peak). Data are means ± s.e.m. of [Ca2+]i measured by confocal imaging of 40 cells from 3 experiments Different asterisks on bars indicate statistical differences by one-way ANOVA according to Tukey’s test (p < 0.001).
Figure 4
Figure 4
The inhibition of TRPM2 channel reduced PL-induced Ca2+ entry. (A) PL-induced Ca2+ entry was dramatically reduced in the presence of 10 µM Econazole (30 min preincubation). PL was added at 20% v/v. Data are means ± s.e.m. of [Ca2+]i traces recorded in different cells. Number of cells: PL alone: 40 cells from 3 experiments; PL + Econazole 10 µM: 50 cells from 3 experiments. (B) Mean ± s.e.m. of the Ca2+ response to 20% v/v PL recorded at the peak and at the plateau under the designated treatments. Data are means ± s.e.m. of [Ca2+]i measured by confocal imaging at peak maxima. Number of cells: PL alone: 40 cells from 3 experiments; PL + Econazole 10 µM: 50 cells from 3 experiments. Asterisks on bars indicate statistical differences determined by two-way ANOVA with Bonferroni’s correction (p < 0.001). (C) Expression of TRPM2 gene in bEND5 cells after RNAi. The mRNA quantity of TRPM2 was determined by qRT-PCR and is represented as mean relative expression ± SD (n = 3, * p < 0.001, t-test). (D) PL-induced Ca2+ entry was completely abrogated in cells transfected with RNAi targeting TRPM2. PL was added at 20% v/v. Data are means ± s.e.m. of [Ca2+]i traces recorded in different cells. Number of cells: PL alone: 30 cells from 3 experiments; PL after RNAi for TRPM2: 50 cells from 3 experiments. (E) Mean ± S.E.M. of the Ca2+ response to 20% v/v PL recorded at the peak and at the plateau under the designated treatments. Data are means ± s.e.m. of [Ca2+]i measured by confocal imaging at peak maxima. Number of cells: PL alone: 30 cells from 3 experiments; PL after RNAi for TRPM2: 50 cells from 3 experiments. Asterisks on bars indicate statistical differences determined by two-way ANOVA with Bonferroni’s correction (p < 0.001).
Figure 5
Figure 5
PL-induced ROS production and their involvement in Ca2+ entry. (A) Expression of NOX4 gene in bEND5 cells after RNAi. The mRNA quantity of NOX4 was determined by qRT-PCR and is represented as mean relative expression ± SD (n = 3, * p < 0.001, t-test). (B). NOX4 protein expression in scrambled cells or after NOX4 RNAi. Blots representative of three were shown. Lanes were loaded with 25 μg of proteins, then probed with anti-NOX4 antibody, and managed as described in the Materials and Methods. The same blots were stripped and re-probed with anti-actin antibody. (C) ROS production in DHR-123 loaded cells recorded at 120 s after 20% PL exposure. CTRL are cells incubated in confocal microscopy loading buffer, as described in Materials and Methods section. Bars represent mean ± s.e.m. of ROS production deriving from two independent experiments, each with n = 20. Asterisks on bars indicate statistical differences determined by one-way ANOVA with Dunnet’s test (p < 0.001). (D) PL-induced Ca2+ entry was completely abrogated after RNAi for NOX4. PL was added at 20% v/v. Data are means ± s.e.m. of [Ca2+]i traces recorded in different cells. Number of cells: PL alone: 40 cells from 3 experiments; PL after RNAi for NOX4: 50 cells from 3 experiments. (E). Mean ± s.e.m. of the Ca2+ response to 20% v/v PL recorded at the peak and at the plateau under the designated treatments. Data are means ± s.e.m. of [Ca2+]i measured by confocal imaging at peak maxima. Number of cells: PL alone: 40 cells from 3 experiments; PL after RNAi for NOX4: 50 cells from 3 experiments. Asterisks on bars indicate statistical differences determined by two-way ANOVA with Bonferroni’s correction (p < 0.001).
Figure 6
Figure 6
Contribution of intracellular stores to cytosolic Ca2+ increase. A. PL-induced Ca2+ release was dramatically reduced in the presence of thapsigargin, 2-APB, U73122, caffeine (30 min pre-incubation for each drug). PL was added at 20%. Data are means ± s.e.m. of [Ca2+]i traces recorded in different cells. Number of cells: PL 20% alone: 20 cells from 3 experiments; PL 20% + thapsigargin 5 µM: 40 cells from 3 experiments; PL 20% + 2-APB 50 µM: 45 cells from 3 experiments; PL 20% + U73122 10 µM: 50 cells from 3 experiments; PL 20% + caffeine 10 mM. B. Mean ± s.e.m. of the Ca2+ response to 20% PL recorded at the peak and at the plateau under the designated treatments. Data are means ± s.e.m. of [Ca2+]i measured by confocal imaging at peak maxima. Number of cells: PL 20% alone: 20 cells from 3 experiments; PL 20% + thapsigargin 5 µM: 40 cells from 3 experiments; PL 20% + 2-APB 50 µM: 45 cells from 3 experiments; PL 20% + U73122 10 µM: 50 cells from 3 experiments; PL 20% + caffeine 10 mM. Asterisks on bars indicate statistical differences determined by two-way ANOVA with Bonferroni’s correction (p < 0.001).
Figure 7
Figure 7
The inhibition of Orai1 channel abolished PL-induced Ca2+ entry. A. PL-induced Ca2+ entry was completely abolished in the presence of 1 µM Pyr6 (30 min preincubation). PL was added at 20% v/v. Data are means ± s.e.m. of [Ca2+]i traces recorded in different cells. Number of cells: PL alone: 40 cells from 3 experiments; PL + Pyr6 1 µM: 50 cells from 3 experiments. B. Mean ± s.e.m. of the Ca2+ response to 20% PL recorded at the peak and at the plateau under the designated treatments. Data are means ± s.e.m. of [Ca2+]i measured by confocal imaging at peak maxima. Number of cells: PL alone: 40 cells from 3 experiments; PL + Pyr6 1 µM: 50 cells from 3 experiments. Asterisks on bars indicate statistical differences determined by two-way ANOVA with Bonferroni’s correction (p < 0.001). C. Using the Mn2+-quenching technique, the resting Ca2+ entry in bEND5 cells was evaluated. First, the extracellular medium was replaced with a 0Ca2+ solution and then, to cause an immediate decay in Fura-2 fluorescence, 200 µM Mn2+ was added. PL 20% treatment allowed an evident decay of fluorescence, while pre-incubating the cells with Pyr6 strongly prevented this decay. CTRL indicates cells incubated in 0Ca2+ solution. D. The quenching rate of Fura-2 fluorescence induced by Mn2+ addition was calculated as the slope of a linear regression. Different asterisks on bars indicate statistical differences (*** p < 0.001; ** p < 0.005).
Figure 8
Figure 8
Role of intracellular ROS and Ca2+ in PL-induced wound closure. A. Upper panel: Effect of different inhibitors on PL-induced scratch wound repair of endothelial monolayers. Each inhibitor was used according to the procedures, which were previously shown to inhibit PL extracellular Ca2+ entry. CTRL are cells in control conditions, i.e., cells grown in DMEM with 10% FBS as described in the Materials and Methods section. Wound closure rate is expressed as the difference between wound width at 0 and 24 h. Data were recorded 24 h after scratch wound healing of cells exposed to PL. Bars represent mean ± s.e.m. of wound closure inhibition deriving from two independent experiments, each with n = 20. Asterisks on bars indicate statistical differences determined by two-way ANOVA with Bonferroni’s correction (p < 0.001). Lower panel: Micrographs of scratch-wounded bEND5 monolayers incubated under control conditions or in the presence of PL with different inhibitors. B. Upper panel: Effect of RNAi for NOX4 and TRPM2 on PL-induced scratch wound repair of endothelial monolayers. Wound closure rate is expressed as the difference between wound width at 0 and 24 h. Data were recorded 24 h after scratch wound healing of cells exposed to PL. Bars represent mean ± s.e.m. of wound closure inhibition deriving from two independent experiments, each with n = 20. Asterisks on bars indicate statistical differences determined by two-way ANOVA with Bonferroni’s correction (p < 0.001). Micrographs of scratch-wounded bEND5 monolayers incubated under control conditions (scrambled cells) or in the presence of PL and RNAi (siRNA) for NOX4 and TRPM2 and then stained with blue toluidine and observed 24 h after wounding.
Figure 9
Figure 9
Diagram depicting the mechanism of action of PL on bEND5 endothelial cells, as characterized in the study.

References

    1. Ranzato E., Burlando B. Signaling pathways in wound repair. In: Middleton J.E., editor. Wound Healing: Process, Phases and Promoting. Nova Publishers Inc.; Hauppauge, NY, USA: 2011.
    1. Martinotti S., Ranzato E. Dynamic interplay between cell types during wound healing. In: Ranzato E., editor. Keratinocytes: Structure, Molecular Mechanisms and Role in Immunity. Nova Publishers Inc.; Hauppauge, NY, USA: 2013.
    1. Mao A.S., Mooney D.J. Regenerative medicine: Current therapies and future directions. Proc. Natl. Acad. Sci. USA. 2015;112:14452–14459. doi: 10.1073/pnas.1508520112. - DOI - PMC - PubMed
    1. Ioannidou E. Therapeutic modulation of growth factors and cytokines in regenerative medicine. Curr. Pharm. Des. 2006;12:2397–2408. doi: 10.2174/138161206777699007. - DOI - PubMed
    1. Ranzato E., Mazzucco L., Burlando B. Platelet Derivatives: A New Horizon in Regenerative Medicine. In: Lv B., editor. Advances in Medicine and Biology. Nova Publishers Inc.; Hauppauge, NY, USA: 2010.