

Wetter climates select for higher immune gene diversity in resident, but not migratory, songbirds
- PMID: 31992169
- PMCID: PMC7015325
- DOI: 10.1098/rspb.2019.2675
Wetter climates select for higher immune gene diversity in resident, but not migratory, songbirds
Abstract
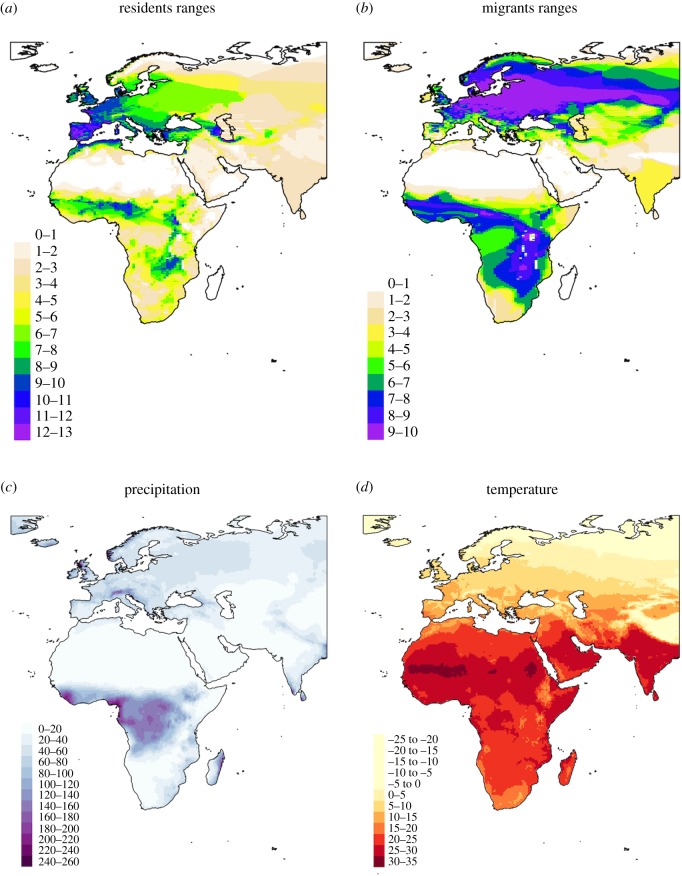
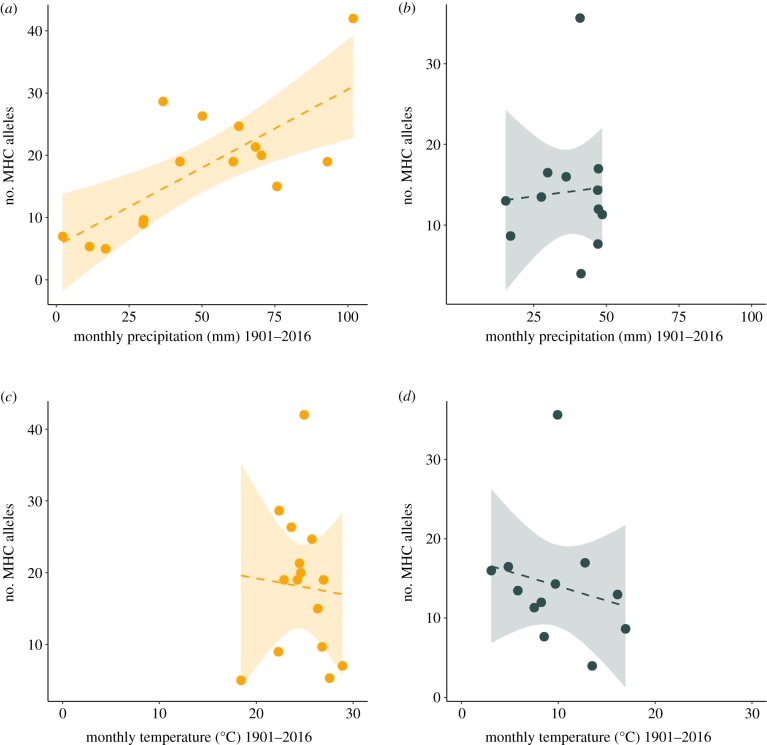
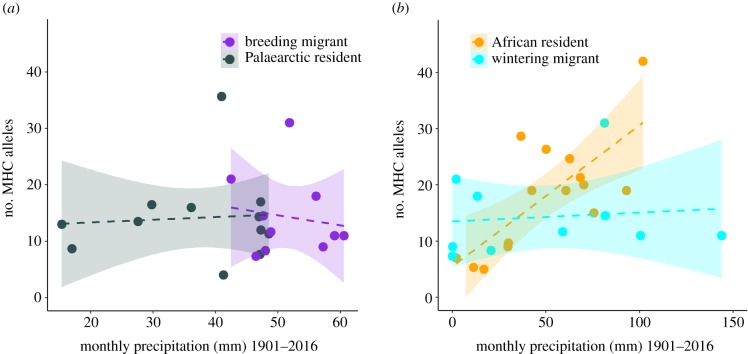
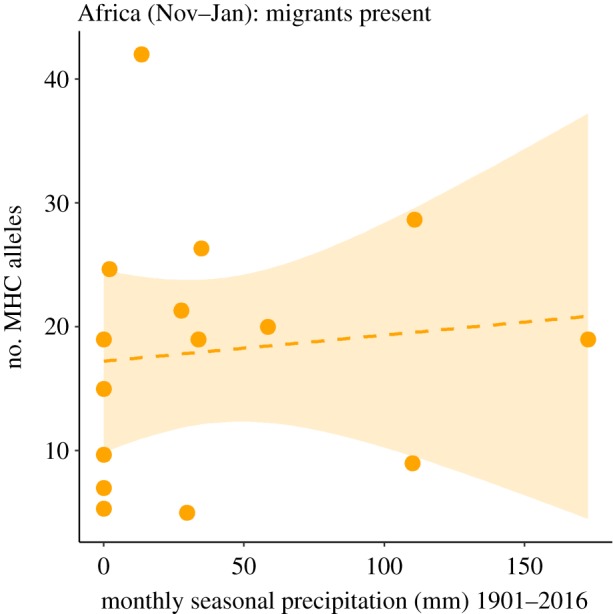
Pathogen communities can vary substantially between geographical regions due to different environmental conditions. However, little is known about how host immune systems respond to environmental variation across macro-ecological and evolutionary scales. Here, we select 37 species of songbird that inhabit diverse environments, including African and Palaearctic residents and Afro-Palaearctic migrants, to address how climate and habitat have influenced the evolution of key immune genes, the major histocompatibility complex class I (MHC-I). Resident species living in wetter regions, especially in Africa, had higher MHC-I diversity than species living in drier regions, irrespective of the habitats they occupy. By contrast, no relationship was found between MHC-I diversity and precipitation in migrants. Our results suggest that the immune system of birds has evolved greater pathogen recognition in wetter tropical regions. Furthermore, evolving transcontinental migration appears to have enabled species to escape wet, pathogen-rich areas at key periods of the year, relaxing selection for diversity in immune genes and potentially reducing immune system costs.
Keywords: birds; climate; immune genes; major histocompatibility complex; pathogens.
Conflict of interest statement
We declare we have no competing interests.
Figures
Similar articles
-
The evolution of immunity in relation to colonization and migration.Nat Ecol Evol. 2018 May;2(5):841-849. doi: 10.1038/s41559-018-0509-3. Epub 2018 Apr 9. Nat Ecol Evol. 2018. PMID: 29632357
-
Moisture as a determinant of habitat quality for a nonbreeding neotropical migratory songbird.Ecology. 2010 Oct;91(10):2874-82. doi: 10.1890/09-2212.1. Ecology. 2010. PMID: 21058548
-
Trade-offs in expressed major histocompatibility complex diversity seen on a macroevolutionary scale among songbirds.Evolution. 2021 May;75(5):1061-1069. doi: 10.1111/evo.14207. Epub 2021 Apr 6. Evolution. 2021. PMID: 33666228
-
Major histocompatibility complex variation and blood parasites in resident and migratory populations of the common yellowthroat.J Evol Biol. 2018 Oct;31(10):1544-1557. doi: 10.1111/jeb.13349. Epub 2018 Jul 19. J Evol Biol. 2018. PMID: 29964353
-
Population and evolutionary dynamics in spatially structured seasonally varying environments.Biol Rev Camb Philos Soc. 2018 Aug;93(3):1578-1603. doi: 10.1111/brv.12409. Epub 2018 Mar 25. Biol Rev Camb Philos Soc. 2018. PMID: 29575449 Free PMC article. Review.
Cited by
-
Selection and demography drive range-wide patterns of MHC-DRB variation in mule deer.BMC Ecol Evol. 2022 Apr 6;22(1):42. doi: 10.1186/s12862-022-01998-8. BMC Ecol Evol. 2022. PMID: 35387584 Free PMC article.
-
Assessing immune phenotypes using simple proxy measures: promise and limitations.Discov Immunol. 2024 Jun 28;3(1):kyae010. doi: 10.1093/discim/kyae010. eCollection 2024. Discov Immunol. 2024. PMID: 39045514 Free PMC article.
-
Ancient duplication, coevolution, and selection at the MHC class IIA and IIB genes of birds.Front Immunol. 2023 Oct 27;14:1250824. doi: 10.3389/fimmu.2023.1250824. eCollection 2023. Front Immunol. 2023. PMID: 37965325 Free PMC article.
-
COVID-19 pandemic: the possible influence of the long-term ignorance about climate change.Environ Sci Pollut Res Int. 2021 Apr;28(13):15575-15579. doi: 10.1007/s11356-020-12167-z. Epub 2021 Jan 6. Environ Sci Pollut Res Int. 2021. PMID: 33403640 Free PMC article.
-
Characterization, Selection, and Trans-Species Polymorphism in the MHC Class II of Heermann's Gull (Charadriiformes).Genes (Basel). 2022 May 20;13(5):917. doi: 10.3390/genes13050917. Genes (Basel). 2022. PMID: 35627302 Free PMC article.
References
-
- Martínez-meyer E, Townsend Peterson A, Hargrove WW. 2004. Ecological niches as stable distributional constraints on mammal species, with implications for Pleistocene extinctions and climate change projections for biodiversity. Glob. Ecol. Biogeogr. 13, 305–314. (10.1111/j.1466-822X.2004.00107.x) - DOI
Publication types
MeSH terms
Associated data
LinkOut - more resources
Full Text Sources
Research Materials
