Comparative Study
. 2020 Jan 28;21(1):30.
doi: 10.1186/s12859-020-3365-5.

Unlocking the transcriptomic potential of formalin-fixed paraffin embedded clinical tissues: comparison of gene expression profiling approaches

Affiliations
Comparative Study

Unlocking the transcriptomic potential of formalin-fixed paraffin embedded clinical tissues: comparison of gene expression profiling approaches

Arran K Turnbull et al. BMC Bioinformatics. .

Abstract

Background: High-throughput transcriptomics has matured into a very well established and widely utilised research tool over the last two decades. Clinical datasets generated on a range of different platforms continue to be deposited in public repositories provide an ever-growing, valuable resource for reanalysis. Cost and tissue availability normally preclude processing samples across multiple technologies, making it challenging to directly evaluate performance and whether data from different platforms can be reliably compared or integrated.

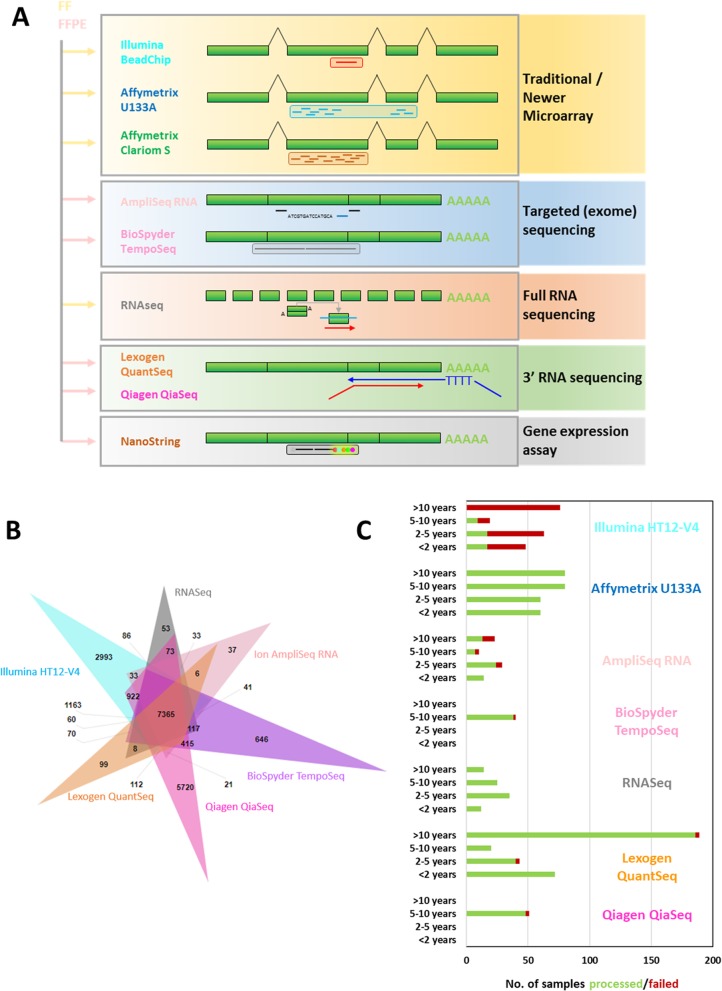
Methods: This study describes our experiences of nine new and established mRNA profiling techniques including Lexogen QuantSeq, Qiagen QiaSeq, BioSpyder TempO-Seq, Ion AmpliSeq, Nanostring, Affymetrix Clariom S or U133A, Illumina BeadChip and RNA-seq of formalin-fixed paraffin embedded (FFPE) and fresh frozen (FF) sequential patient-matched breast tumour samples.

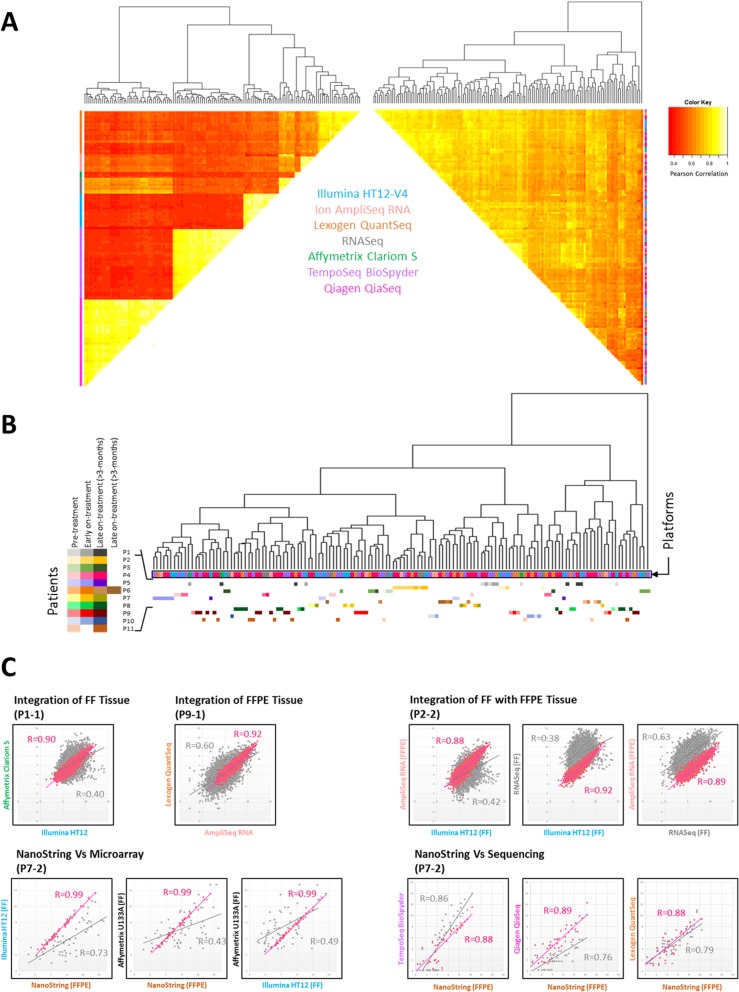
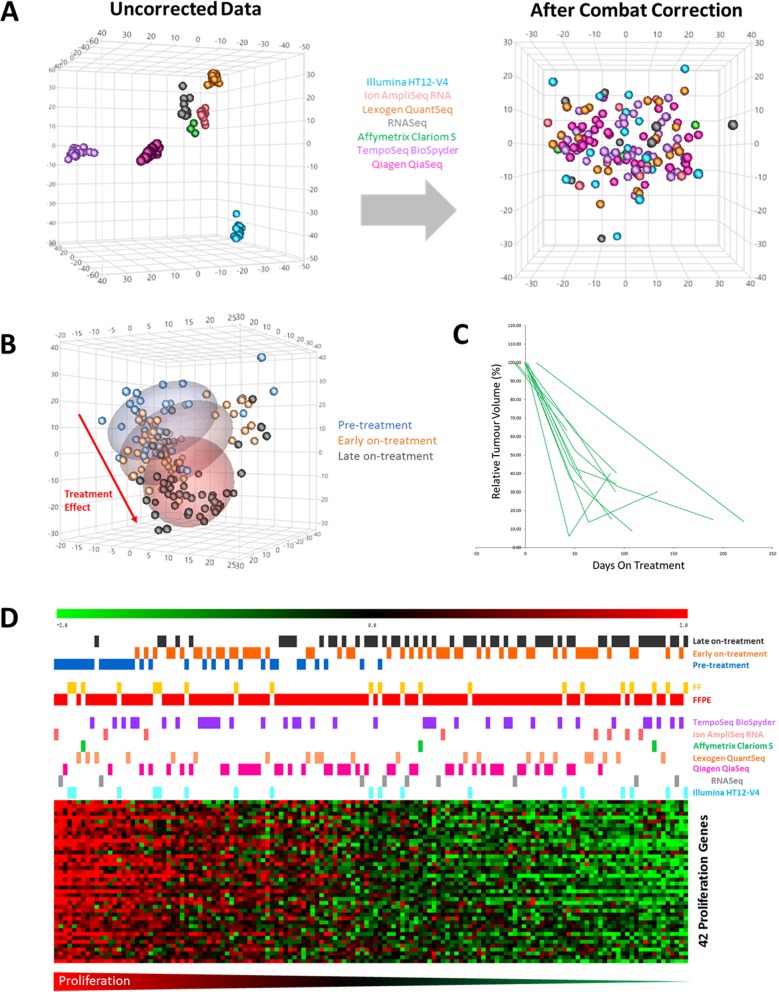
Results: The number of genes represented and reliability varied between the platforms, but overall all methods provided data which were largely comparable. Crucially we found that it is possible to integrate data for combined analyses across FFPE/FF and platforms using established batch correction methods as required to increase cohort sizes. However, some platforms appear to be better suited to FFPE samples, particularly archival material.

Conclusions: Overall, we illustrate that technology selection is a balance between required resolution, sample quality, availability and cost.

Keywords: FFPE; Fresh-frozen; Gene expression; Microarray; Sequencing; Transcriptomics.


Conflict of interest statement

The authors declare that they have no competing interests.

Figures

Fig. 1
Fig. 1
Comparison of gene expression profiling approaches (a) Schematic of probe/primer designs for each technology. A table showing which samples were processed on each technology is provided in Additional file 1: Table S1. b Number of overlapping Ensembl gene identifiers detected in each dataset (Nanostring and Affymetix U133 were omitted as they do not represent the whole transcriptome and the Clariom S was excluded as only three samples were processed). c Summary of FFPE sample processing success rates by sample age using whole-transcriptome platforms
Fig. 2
Fig. 2
Batch correction allows robust direct integration of transcriptomic data across platforms. a Dissimilarity heatmaps based upon Pearson correlations ranging from 0.4 (red) through shades of orange and yellow to 1.0 (white). Left triangle shows the combined dataset of 6844 genes across 7 gene expression platforms. Right triangle shows the same data following batch correction with Combat. Coloured bars below dendrograms denote the platform. b Enlargement of the dendrogram to demonstrate that the majority of the same time-point patient samples processed on different platforms cluster together following batch correction. c Scatter plots before (grey) and after batch correction (pink) of the same sample, either FF or FFPE processed across different platforms. In each case the Pearson correlations increase substantially following batch correction. Patient samples are denoted − 1 for pre-treatment, − 2 for early on-treatment
Fig. 3
Fig. 3
Robust gene expression measurement across platforms following batch correction. Correction of systematic platform bias and integration of data from fresh frozen and FFPE tissues. a 3D multi-dimensional scaling (MDS) before (left) and after (right) batch correction of 6844 common genes. Samples coloured by platform and shapes indicates time point. b MDS plot of the batch corrected data with samples coloured by time-point clearly demonstrates a consistent treatment effect seen across sequential patient-matched samples. c Ultrasound measurements of the eleven breast tumours which relate to the sequential patient-matched samples indicating consistent reductions in tumour volume over time across the patients. d Ranking patient samples by the expression of 42 common proliferation genes (listed in Additional file 2: Table S2) illustrates consistent changes resulting from endocrine therapy, which appears to be independent from profiling platform. Pre-treatment samples tend to have relatively high proliferation, whilst as expected early, and particularly late on-treatment samples have lower proliferation. Heatmap colours are Red = High, Green = low

References

    1. Sims AH. Bioinformatics and breast cancer: what can high-throughput genomic approaches actually tell us? J Clin Pathol. 2009;62:879–885. doi: 10.1136/jcp.2008.060376. - DOI - PubMed
    1. Robert C, Watson M. Errors in RNA-Seq quantification affect genes of relevance to human disease. Genome Biol. 2015;16:177. doi: 10.1186/s13059-015-0734-x. - DOI - PMC - PubMed
    1. Turnbull AK, Kitchen RR, Larionov A, Renshaw L, Dixon JM, Sims AH. Direct integration of intensity-level data from Affymetrix and Illumina microarrays improves statistical power for robust reanalysis. BMC Med Genet. 2012;5:35. - PMC - PubMed
    1. Sims AH, Smethurst GJ, Hey Y, Okoniewski MJ, Pepper SD, Howell A, Miller CJ, Clarke RB. The removal of multiplicative, systematic bias allows integration of breast cancer gene expression datasets - improving meta-analysis and prediction of prognosis. BMC Med Genet. 2008;1:42. - PMC - PubMed
    1. Leek JT, Scharpf RB, Bravo HC, Simcha D, Langmead B, Johnson WE, Geman D, Baggerly K, Irizarry RA. Tackling the widespread and critical impact of batch effects in high-throughput data. Nat Rev Genet. 2010;11:733–739. doi: 10.1038/nrg2825. - DOI - PMC - PubMed