. 2020 Jan 28;20(1):14.
doi: 10.1186/s12862-020-1580-3.

The evolutionary arms race between transposable elements and piRNAs in Drosophila melanogaster

Affiliations

The evolutionary arms race between transposable elements and piRNAs in Drosophila melanogaster

Shiqi Luo et al. BMC Evol Biol. .

Abstract

Background: The piwi-interacting RNAs (piRNAs) are small non-coding RNAs that specifically repress transposable elements (TEs) in the germline of Drosophila. Despite our expanding understanding of TE:piRNA interaction, whether there is an evolutionary arms race between TEs and piRNAs was unclear.

Results: Here, we studied the population genomics of TEs and piRNAs in the worldwide strains of D. melanogaster. By conducting a correlation analysis between TE contents and the abundance of piRNAs from ovaries of representative strains of D. melanogaster, we find positive correlations between TEs and piRNAs in six TE families. Our simulations further highlight that TE activities and the strength of purifying selection against TEs are important factors shaping the interactions between TEs and piRNAs. Our studies also suggest that the de novo generation of piRNAs is an important mechanism to repress the newly invaded TEs.

Conclusions: Our results revealed the existence of an evolutionary arms race between the copy numbers of TEs and the abundance of antisense piRNAs at the population level. Although the interactions between TEs and piRNAs are complex and many factors should be considered to impact their interaction dynamics, our results suggest the emergence, repression specificity and strength of piRNAs on TEs should be considered in studying the landscapes of TE insertions in Drosophila. These results deepen our understanding of the interactions between piRNAs and TEs, and also provide novel insights into the nature of genomic conflicts of other forms.

Keywords: Arms race; Co-evolution; Drosophila melanogaster; Transposable element; piRNA.


Conflict of interest statement

The authors declare that they have no competing interests.

Figures

Fig. 1
Fig. 1
The contents and polymorphisms of TE insertions in D. melanogaster from the Global Diversity Lines (GDL). The five populations are abbreviated as follows: B, Beijing (n = 14); I, Ithaca (n = 17); N, Netherland (n = 19); T, Tasmania (n = 17); Z, Zimbabwe (n = 14). a Boxplots of the numbers of known TE insertions (y-axis) across the five populations. The average copy number (± s.e.) in each strain is 1283.7 ± 3.3, 1297.4 ± 3.4, 1309.1 ± 3.5, 1290.5 ± 6.9 and 1204.3 ± 8.4 for the B, I, N, T, and Z population, respectively. b Boxplots of the numbers of novel TE insertions (y-axis) across the five populations. The average number (± s.e.) of novel insertions in each strain is 299.1 ± 11.1, 288.6 ± 7.1, 387.9 ± 10.3, 275.8 ± 5.0, and 171.5 ± 19.8 in the B, I, N, T, and Z population respectively. c Densities (insertions per Mb) of TE novel insertion sites on different chromosomes per strain in five populations. d Changes of gene expression caused by TE insertions in female adults. For each novel TE insertion in the genic regions in the 5 GDL strains that have transcriptome sequenced in females, we compared the expression level of the host genes in the strains that have the TE insertion vs. the strains that do not have the particular insertion. The x-axis is the log2 (fold change) of gene expression caused by a TE insertion. The y-axis is the cumulative probability of each insertion category. e Frequency spectra of novel TE insertions and SNPs from different functional categories. The x-axis is the number of strains that carry the particular category of TE insertions or SNPs, and the y-axis is the percentage of TE insertions or SNPs in each class that is segregating at that particular frequency. f Venn diagram of novel TE insertions across the five populations. g The percentages of genomic reads (y-axis) that are mapped to the TEs annotated in the reference genome across the five populations. h Barplots of πs in 10 kb bins across the five populations. i Boxplots of Tajima’s D in 10 kb bins across the five populations. KS tests were performed to test the differences in the statistic values across populations
Fig. 2
Fig. 2
Characteristics of small RNAs sequenced in 10 GDL strains. a Length distribution of small RNAs that are mapped to the reference genome and TE sequences, the known miRNAs, tRNAs, rRNAs, ncRNAs and miscRNAs were removed. b Barplots of the fractions of the first nucleotide of piRNAs in 10 GDL strains. c Pie chart of the genomic locations for all mapped piRNAs. d Pie chart of the genomic locations for the uniquely mapped piRNAs. e The ping-pong signature generated between the sense and antisense piRNA reads. The x-axis shows the nucleotides that are overlapping between a sense and antisense piRNA. The y-axis is the Z-score of the overlapping length among all the possible overlapping combinations. f Heatmap showing the RPKM values of weighted piRNAs on TEs in 10 GDL strains. Only the top 40 TEs with the highest RPKMs are shown. g Heatmap showing the RPKM values of weighted piRNAs on piRNA clusters in 10 GDL strains. Only the top 40 piRNA clusters with the highest RPKMs are shown
Fig. 3
Fig. 3
Generation of de novo piRNAs in the flanking regions of novel TE insertions. a A schematic diagram illustrating the two hypotheses of how novel piRNAs are induced from TE insertions. The first mechanism is that a TE jumps into a pre-existing piRNA locus so that novel piRNAs are generated by co-transcription of the established piRNA precursor. The second mechanism is that de novo piRNAs are generated in the flanking region of novel TE insertions. b Barplots showing the RPKMs of de novo piRNAs generated in the flanking region (upstream and downstream 2 Kb) of novel TE insertions. The de novo piRNAs are generated with strong strand-asymmetric distributions. KS tests were performed to test the differences in the RPKM values. c Barplots of the fractions of the first nucleotide of de novo piRNAs generated in the flanking region (upstream and downstream 2 Kb) of novel TE insertions. d The ping-pong signature of de novo piRNAs generated in the flanking region (upstream and downstream 2 Kb) of novel TE insertions in 10 GDL strains. The color key for the strains is the same as shown in Fig. 2a. e Examples of de novo piRNAs and siRNAs generated from the flanking region of P-element insertion in 10 GDL strains. The sense-strand small RNAs are plotted in red, and the anti-sense small RNAs are plotted in blue. f Frequencies of novel TE insertions and SNPs. The x-axis is the number of strains that carry the particular category of TE insertions or SNPs, and the y-axis is the percentage of TE insertions or SNPs in each class that is segregating at that particular frequency. The TE insertions in piRNA clusters or with de novo piRNAs are segregating at higher frequencies. Fisher’s exact tests were performed to test the differences in the RPKM values
Fig. 4
Fig. 4
Correlations between TE DNA copy number and antisense piRNA abundance. a Boxplots of Spearman’s correlation coefficients (Rho) values between TE DNA copy number and antisense piRNA abundance in DNA transposons (n = 12), LTR (n = 59), and non-LTR (n = 34) families. b Scatter plots displaying the TE DNA copy number and antisense piRNA abundance (RPKM) for representative TE families. Dots in cyan represent the GDL strains, and dots in red represent the DGRP strains. The Spearman’s Rho and adjusted P values are shown. c Sequencing coverage of DNA and piRNA along P-element in 10 GDL strains. Sense piRNAs are shown in red; antisense piRNAs are shown in blue; and DNA is shown in grey. d Boxplots of antisense piRNA density between TE families, which showed significantly positive Spearman’s correlation between TE copy number and antisense piRNA abundance (n = 6) and other TE families (n = 99)
Fig. 5
Fig. 5
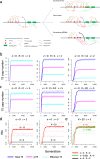
The evolutionary arms race between TEs and piRNAs revealed by simulations. a A schematic diagram illustrating the process and consequence of TE:piRNA interactions. Three possible consequences of TE:piRNA interactions depend on TE replication rate, the repressive strength of piRNAs on TEs, and the strength of purifying selection against TEs: 1) Excessive TEs. When TE replication rate is high and the repressive strength of piRNA is weak (TEs jumping into piRNA cluster and become piRT producing piRNAs), TEs soon become excessive in the genome, disrupt coding genes and have detrimental effects on the genome. 2) Arms race. When more piRTs produce more piRNAs and have stronger repression on TE, TE replication rate becomes lower and less TE exists in the genome, but the piRNA also alleviate detrimental effects of TEs on the genome. 3) Excessive piRNAs. If piRNA repression is very strong, TE activity becomes quite low and hardly jumps in the genome. Note that excessive dosage of piRNAs might cause off-target effects on the normal mRNAs and hence reduce the fitness of the host organism (dashed lines). The width of the lines represents the repression strength of piRNAs. b-c The numbers (y-axis) of TEs (blue), piTEs (pink), effective TEs (cyan) accumulated in one chromosome along with the generations (x-axis) in the simulations. Under the same selection scaling factor (s = 2 for b and s = 5 for c), higher numbers of TEs, piTEs, and the effective TEs carried by one chromosome were observed when the repressiveness of piRNAs (R) on TEs gets stronger. d Stronger repression of piRNA on the activities of TEs cause a positive correlation between piRNAs and TEs. The thick red lines are the mean Spearman’s Rho (y-axis) between the abundance of piRNAs and TEs along generations (x-axis) in the simulations under R = 12 (left) or R = 20 (right). The thin dashed red lines are the 2.5 to 97.5% quantiles obtained in simulations. The black lines are Spearman’s Rho under R = 0. Since in both cases, the median (thick black) and the 2.5% (thin black) quantiles are both zero, and the 97.5% (thin black) quantile is displayed. e Escaping of TEs from piRNA repression (e = 0.001, green compared with e = 0, red) decreases the positive correlation between the copy numbers of TEs and matched piRNAs. In all of these simulations, the following parameters are used: u = 0.03, Ne = 5000, d = 0.003, i = 0.001, r = 10− 8, p = 0.5, a = 10− 3, b = 5 × 10− 4, f = 0.2, e = 0 in b-d. The R and s values are displayed on each panel. The correlation was calculated in 1000 sampled chromosomes that have at least one TE from the populations. All simulations were performed for 200 replicates

Similar articles

Cited by

References

    1. Van Valen L. A new evolutionary law. Evol Theory. 1973;1:1–30.
    1. Neiman M, Fields P. Antagonistic interspecific coevolution. In: Kliman R, editor. Encyclopedia of Evolutionary Biology. Oxford: Academic Press; 2016. pp. 93–100.
    1. Dawkins R, Krebs JR. Arms races between and within species. Proc R Soc Lond B Biol Sci. 1979;205(1161):489. doi: 10.1098/rspb.1979.0081. - DOI - PubMed
    1. Hurst LD, Atlan A, Bengtsson BO. Genetic conflicts. Q Rev Biol. 1996;71(3):317–364. doi: 10.1086/419442. - DOI - PubMed
    1. Werren JH. Selfish genetic elements, genetic conflict, and evolutionary innovation. Proc Natl Acad Sci U S A. 2011;108:10863–10870. doi: 10.1073/pnas.1102343108. - DOI - PMC - PubMed

LinkOut - more resources