. 2020 Jan 28;21(1):80.
doi: 10.1186/s12864-020-6486-3.

QuantTB - a method to classify mixed Mycobacterium tuberculosis infections within whole genome sequencing data

Affiliations

QuantTB - a method to classify mixed Mycobacterium tuberculosis infections within whole genome sequencing data

Christine Anyansi et al. BMC Genomics. .

Abstract

Background: Mixed infections of Mycobacterium tuberculosis and antibiotic heteroresistance continue to complicate tuberculosis (TB) diagnosis and treatment. Detection of mixed infections has been limited to molecular genotyping techniques, which lack the sensitivity and resolution to accurately estimate the multiplicity of TB infections. In contrast, whole genome sequencing offers sensitive views of the genetic differences between strains of M. tuberculosis within a sample. Although metagenomic tools exist to classify strains in a metagenomic sample, most tools have been developed for more divergent species, and therefore cannot provide the sensitivity required to disentangle strains within closely related bacterial species such as M. tuberculosis. Here we present QuantTB, a method to identify and quantify individual M. tuberculosis strains in whole genome sequencing data. QuantTB uses SNP markers to determine the combination of strains that best explain the allelic variation observed in a sample. QuantTB outputs a list of identified strains, their corresponding relative abundances, and a list of drugs for which resistance-conferring mutations (or heteroresistance) have been predicted within the sample.

Results: We show that QuantTB has a high degree of resolution and is capable of differentiating communities differing by less than 25 SNPs and identifying strains down to 1× coverage. Using simulated data, we found QuantTB outperformed other metagenomic strain identification tools at detecting strains and quantifying strain multiplicity. In a real-world scenario, using a dataset of 50 paired clinical isolates from a study of patients with either reinfections or relapses, we found that QuantTB could detect mixed infections and reinfections at rates concordant with a manually curated approach.

Conclusion: QuantTB can determine infection multiplicity, identify hetero-resistance patterns, enable differentiation between relapse and re-infection, and clarify transmission events across seemingly unrelated patients - even in low-coverage (1×) samples. QuantTB outperforms existing tools and promises to serve as a valuable resource for both clinicians and researchers working with clinical TB samples.

Keywords: Bioinformatics; Metagenomics; Mixed infection; Mycobacterium tuberculosis; Reinfection; Strain identification; Strain level classification; Transmission; Tuberculosis; Whole genome sequencing.


Conflict of interest statement

The authors declare that they have no competing interests.

Figures

Fig. 1
Fig. 1
Iterative multiple strain identification process in QuantTB for a mixed sample, where two strains are present, strain 1(red) and strain 2 (green). First, SNPs from the sample are compared against SNP sequences in the reference database to calculate a strain presence score for every genome in the database. The sample is represented as a pileup, where every circle represents an allele copy. Red circles indicate alleles unique to strain A, green indicates alleles unique to strain B, and blue indicates reference strain (blue). The database (top right) is an example matrix representation of a reference genome database. Each column represents a single SNP (unique position and variant), and each row represents a genome in the reference database with this SNP present (1) or absent (0). Strain presence scores are calculated for every genome in the reference database. The genome with the highest strain presence score (si) is selected, in this case strain A (red). The SNPs associated with strain A are removed from the database and the input sample, along with additional reference alleles. In each subsequent iteration the scores are recalculated, allowing for the identification of additional strains, and the process continues until there are no more SNPs or a threshold has been reached
Fig. 2
Fig. 2
a Number of representatives from each lineage amongst all 5637 M. tuberculosis assemblies in our reference database. b Intra-lineage pairwise distance for each lineage as measured by the number of unique SNPs between a pair. The number in the box plot is the median distance of all pairs of samples from that lineage
Fig. 3
Fig. 3
Benchmarking results of synthetically mixed read sets of three different strain identification tools, QuantTB, StrainSeeker and Sigma. A) Results from a smaller database (d10small, n = 200) are shown for all tools for coverage levels of 1× and 10×, B) results from four larger databases (see Table 1) are shown only for QuantTB, for coverages ranging from 0.1× − 20x
Fig. 4
Fig. 4
a Relative abundance predictions across the synthetic sample sets, using randomly selected strains from the d50 and d100 database for QuantTB only. If the strain was correctly predicted for the sample it is colored green (true positive), whereas incorrectly predicted strains are colored red (false positive). The left graph contains samples where two strains are present at 1× and 9× coverage. The right graph contains samples where two strains are present at 3× and 7× coverage. b Predicted relative abundances across synthetically mixed samples for QuantTB, StrainSeeker and Sigma. Each point represents a predicted relative abundance for a single strain. Each mixed sample contained a pair of strains from the d50 dataset at either 1 × − 9× or 3 × − 7× abundance. Although samples were sourced from the d50 dataset, the tools used a different set of genomes as a reference set (sourced from d10). Thus genomes in the samples were not present in the underlying database the tools were trained on. This lets us see how well each tool is at predicting the correct number of strains and the correct relative abundance between strains if the ‘correct’ strain in the sample is not already present in the database
Fig. 5
Fig. 5
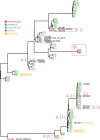
Phylogenetic tree of 47 pairs of isolates from sequencing reads taken from the study of Bryant et al. Tips are labeled with the isolate number and its part of the pair (a or b), and are colored by its isolate classification as predicted by QuantTB. Isolates containing a mixed infection are colored in red. Isolates part of a reinfection pair are colored in blue. Isolates containing the H37Rv strain are colored in purple. Isolates containing antibiotic heterozygous (h) or homozygous (H) resistance mutations are in orange. All single infections isolates are colored in green. To the right of the mixed and reinfection isolates, we show the strains present in the isolate as predicted by QuantTB. Boxes are discussed in the main text

References

    1. World Health Organization . Tuberculosis Fact Sheet. 2018.
    1. Colijn C, Cohen T, Murray M. Latent coinfection and the maintenance of strain diversity. Bull Math Biol. 2009;71:247–263. doi: 10.1007/s11538-008-9361-y. - DOI - PMC - PubMed
    1. Warren RM, Victor TC, Streicher EM, Richardson M, Beyers N, van Pittius NCG, et al. Patients with active tuberculosis often have different strains in the same sputum specimen. Am J Respir Crit Care Med. 2004;169:610–614. doi: 10.1164/rccm.200305-714OC. - DOI - PubMed
    1. Cohen T, van Helden PD, Wilson D, Colijn C, McLaughlin MM, Abubakar I, et al. Mixed-strain mycobacterium tuberculosis infections and the implications for tuberculosis treatment and control. Clin Microbiol Rev. 2012;25:708–719. doi: 10.1128/CMR.00021-12. - DOI - PMC - PubMed
    1. Mcivor A, Koornhof H, Kana BD. Relapse, re-infection and mixed infections in tuberculosis disease. Pathog Dis. 2017;75:1–16. doi: 10.1093/femspd/ftx020. - DOI - PubMed

MeSH terms

Substances