. 2020 Jan 28;13(1):11.
doi: 10.1186/s13041-020-0554-0.

Epitranscriptomic profiling of N6-methyladenosine-related RNA methylation in rat cerebral cortex following traumatic brain injury

Affiliations

Epitranscriptomic profiling of N6-methyladenosine-related RNA methylation in rat cerebral cortex following traumatic brain injury

Jiangtao Yu et al. Mol Brain. .

Abstract

Background: N6-methyladenosine (m6A) is the most prevalent post-transcriptional modification of eukaryotic mRNA. It has been reported that there is a stimulus-dependent regulation of m6A in the mammalian central nervous system in response to sensory experience, learning, and injury. The mRNA m6A methylation pattern in rat cortex after traumatic brain injury (TBI) has not been investigated.

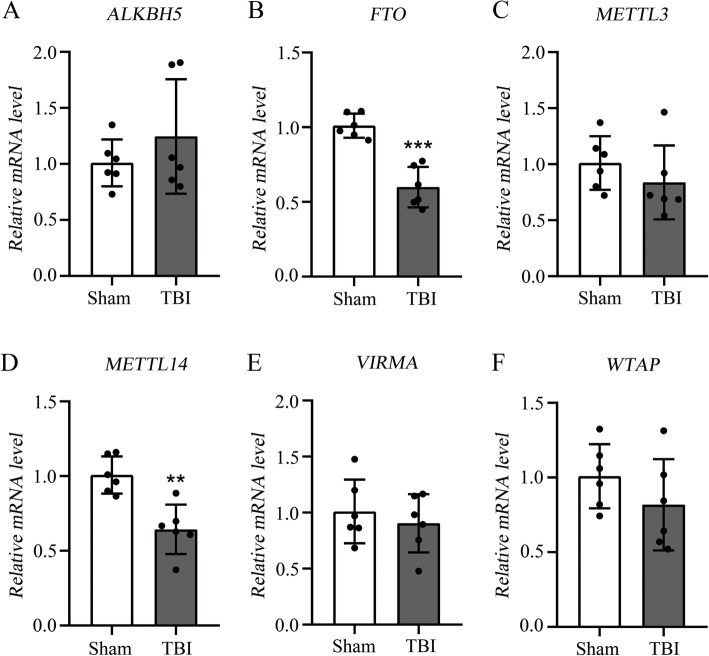
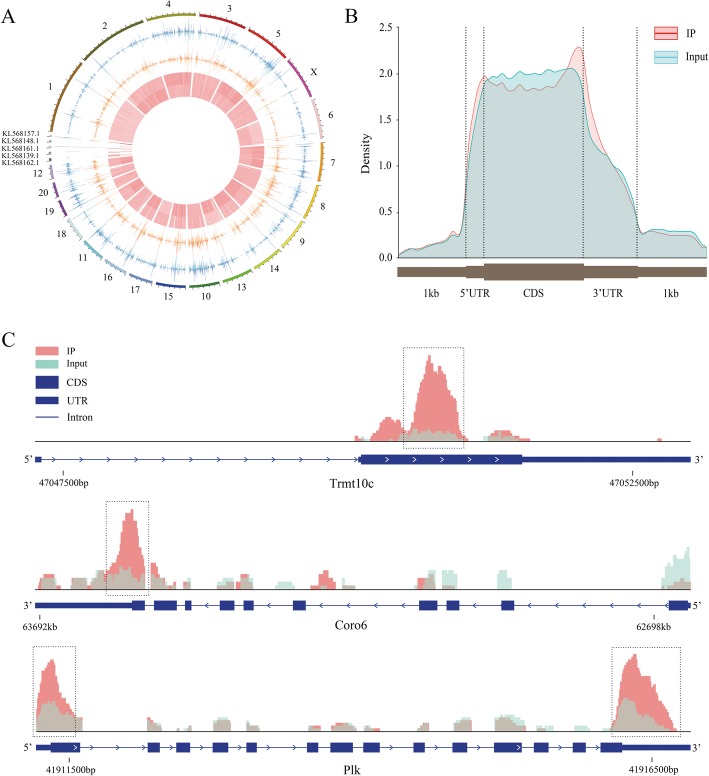
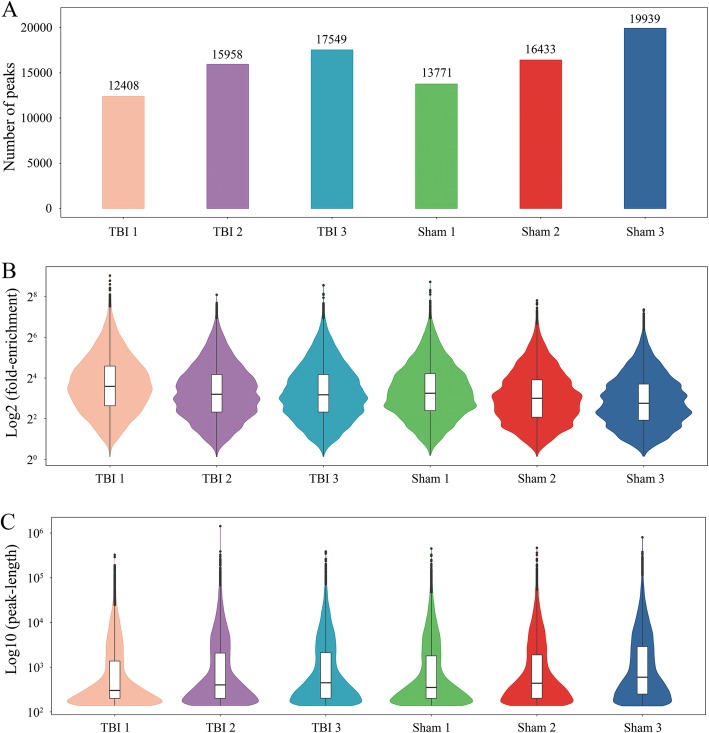
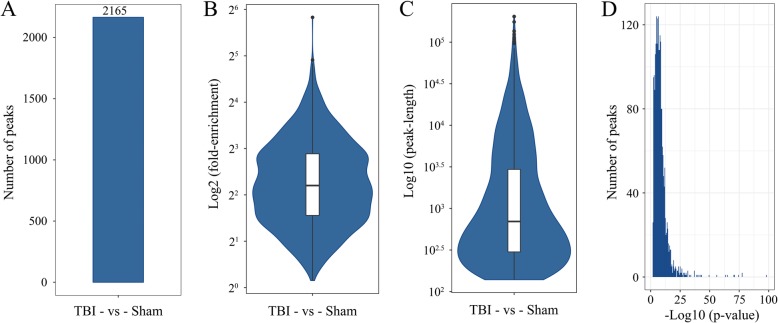
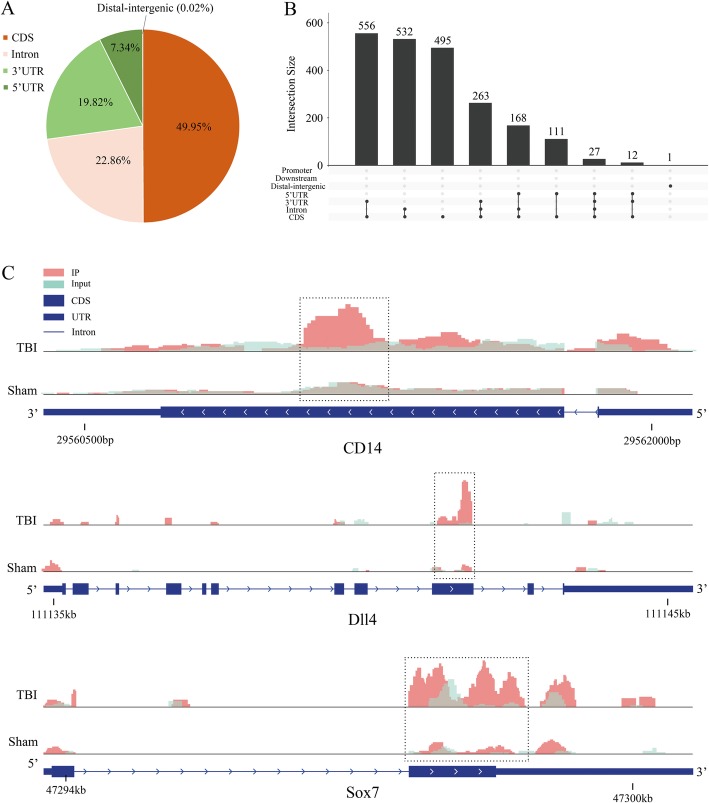
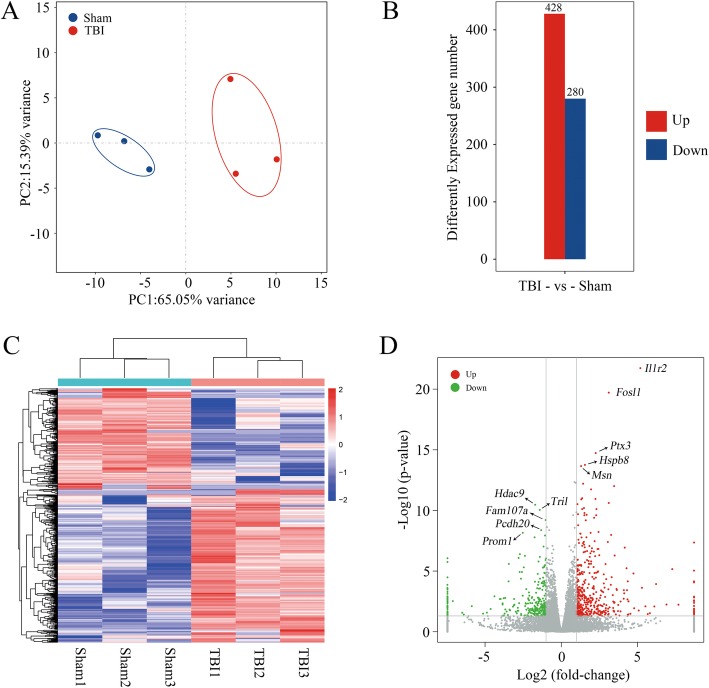
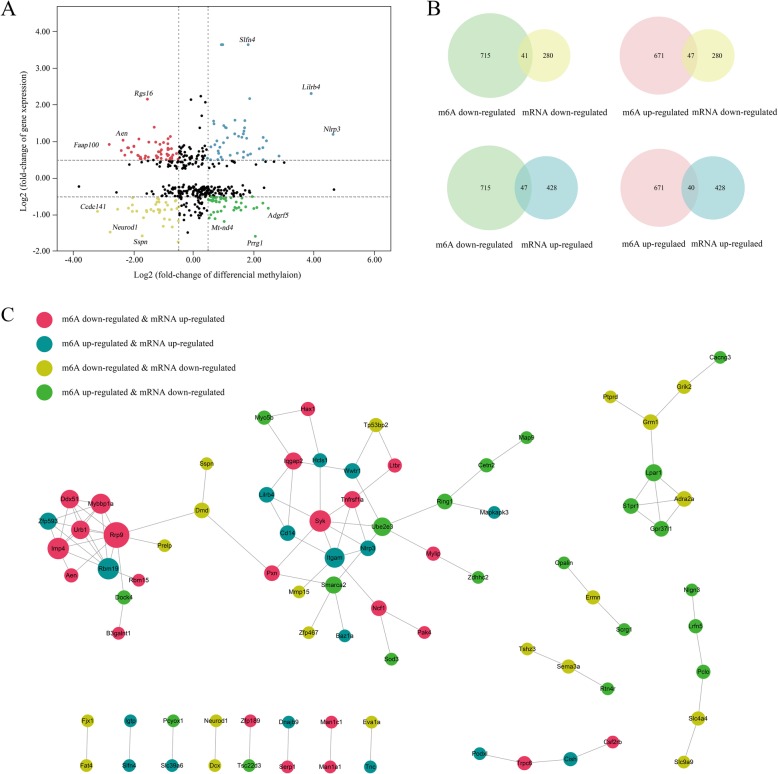
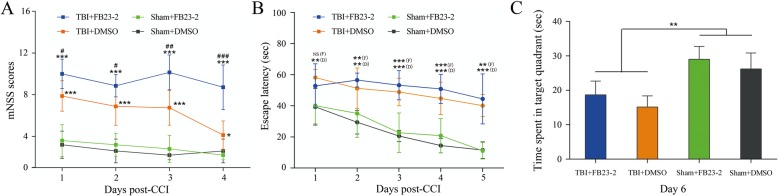
Results: In this study, we conducted a genome-wide profiling of mRNA m6A methylation in rat cortex via methylated RNA immunoprecipitation sequencing (MeRIP-Seq). After TBI, the expressions of METTL14 and FTO were significantly down-regulated in rat cerebral cortex. Using MeRIP-Seq, we identified a total of 2165 significantly changed peaks, of which 1062 were significantly up-regulated and 1103 peaks were significantly down-regulated. These m6A peaks were located across 1850 genes. The analysis of both m6A peaks and mRNA expression revealed that there were 175 mRNA significantly altered methylation and expression levels after TBI. Moreover, it was found that functional FTO is necessary to repair neurological damage caused by TBI but has no effect on the spatial learning and memory abilities of TBI rats by using FTO inhibitor FB23-2.

Conclusion: This study explored the m6A methylation pattern of mRNA after TBI in rat cortex and identified FTO as possible intervention targets in the epigenetic modification of TBI.

Keywords: Epigenetic modification; FTO; Rat cortex; Traumatic brain injury; m6A methylation.


Conflict of interest statement

The authors declare that they have no competing interests.

Figures

Fig. 1
Fig. 1
Reverse transcription polymerase chain reaction (RT-PCR) of METTL3, METTL14, WTAP, VIRMA, FTO, and ALKBH5. ab, RT-PCR of demethylases ALKBH5 and FTO, and the FTO is significantly down-regulated after TBI. cf, RT-PCR of methyltransferases METTL3, METTL14, VIRMA, and WTAP, and the METTL14 is significantly down-regulated after TBI. TBI group (n = 6); Sham group (n = 6). “**” and “***” indicate p < 0.01 and p < 0.001, respectively
Fig. 2
Fig. 2
Topological distribution of m6A peaks. a, The distribution pattern of m6A peaks in different chromosomes. b, The distribution patterns of m6A methylation peaks in gene structures of mRNA. The peaks were mostly distributed on the exon region and there was a distinct enrichment peak at the 3′ terminate (near the stop codon) and an enrichment peak at the 5′ terminate (near the start codon). c, IGV plot shows directly the peaks in the genes of Trmt10c, Coro6 and Plk. The peak of Trmt10c was located at the CDS region, the peak of Coro7 was located at the CDS and 3′ UTR regions, and the peak of Plk was located at the 3′ UTR, the CDS, and the 5′ UTR regions
Fig. 3
Fig. 3
Number of peaks, fold enrichment of peaks and length of peaks in each group after TBI. a, The peak number of each group. An average of 15,305 peaks in the TBI group and an average of 16,714 peaks in the sham group were identified. b, The enrichment of each group. The average logarithmic fold-enrichment of TBI group was 4.11, and the average logarithmic fold-enrichment of sham group was 3.72. c, The peak length of each group. The average peak length of TBI group was 3426.14 bp, and the average peak length of sham group was 3831.73 bp
Fig. 4
Fig. 4
Peak number, fold enrichment, peak length and p-value in the TBI and Sham groups. a, A total of 2165 significantly changed peaks were identified (p < 0.01, FDR < 0.05). b, The average logarithmic fold-enrichment of the peaks were 2.53. c, The average length of each peak was 3.64 (log10). D, The distribution of p-value of all peaks
Fig. 5
Fig. 5
The distribution of significantly changed peaks after TBI. a, Sector graph shows the ratio of peaks in each region. The peaks with significant changes were mainly distributed in the exon (49.95%), CDS (22.86%), 3′ UTR (19.82%), and 5′ UTR (7.34%) and only 0.02% were found in the intergenic region. b, Showing the exact distribution pattern of significantly changed peaks post-TBI. There were 556 peaks distributed in the CDS and 3′ UTR regions, 532 peaks in the CDS and intron regions, and 495 peaks in the CDS region. c, Three representative genes with significantly changed peaks. The m6A level of CD14, Dll4, and Sox7 were significantly up-regulated after TBI by 3.63 fold, 2.10 fold, 3.14 fold, respectively
Fig. 6
Fig. 6
GO and KEGG analyses revealed the biological information behind mRNA m6A methylation. a, The top 10 enriched GO terms of the m6A peaks. b, The top 20 enriched pathways of m6A peaks
Fig. 7
Fig. 7
mRNA changes after traumatic brain injury. a, Principal component analysis of the TBI group and the sham group. The confidence ellipses of samples among sham and TBI groups were separate from each other. b, The expression level of mRNA post-TBI. A total of 428 mRNA expression increased and 280 mRNA expression decreased (p < 0.05, log2FC > 1) in rat cerebral cortex after TBI. c, Heat map shows the relative expression level of the three TBI IP and the three sham IP. d, Volcano plot shows the significantly up-regulated and down-regulated mRNA after TBI
Fig. 8
Fig. 8
Joint analysis of m6A methylation and mRNA expression after TBI. a, b, Four quadrant graph and venn diagram shows the relationship between mRNA m6A methylation and its mRNA expression. c, The protein-protein interaction network shows the connection between the proteins of the genes used in the combined analysis
Fig. 9
Fig. 9
Effects of FTO inhibitior FB23–2 on neurological functions and cognitive and learning abilities in TBI. a, the score of four groups in mNSS: TBI + FB23–2 (n = 7), TBI + DMSO (n = 8), Sham+FB23–2 (n = 5), and Sham+DMSO (n = 5). b and c, the escape latency time and target quadrant time of four groups in MWM, respectively: TBI + FB23–2 (n = 7), TBI + DMSO (n = 8), Sham+FB23–2 (n = 5), and Sham+DMSO (n = 5). “*”, “**”, and “***” indicate p < 0.05, p < 0.01, and p < 0.001 in TBI vs Sham, respectively; “#”, “##”, and “###” indicate p < 0.05, p < 0.01, and p < 0.001 in FB23–2 vs DMSO. Error bars represent SD. NS indicates p > 0.05

Similar articles

Cited by

References

    1. Taylor CA, Bell JM, Breiding MJ, Xu L. Traumatic brain injury-related emergency department visits, hospitalizations, and deaths - United States, 2007 and 2013. MMWR Surveill Summ (Washington, DC : 2002) 2017;66(9):1–16. doi: 10.15585/mmwr.ss6609a1. - DOI - PMC - PubMed
    1. Azouvi P, Arnould A, Dromer E, Vallat-Azouvi C. Neuropsychology of traumatic brain injury: An expert overview. Rev Neurol (Paris) 2017;173(7–8):461–472. doi: 10.1016/j.neurol.2017.07.006. - DOI - PubMed
    1. Dixon KJ. Pathophysiology of traumatic brain injury. Phys Med Rehabil Clin N Am. 2017;28(2):215–225. doi: 10.1016/j.pmr.2016.12.001. - DOI - PubMed
    1. McGinn MJ, Povlishock JT. Pathophysiology of traumatic brain injury. Neurosurg Clin N Am. 2016;27(4):397–407. doi: 10.1016/j.nec.2016.06.002. - DOI - PubMed
    1. Wong VS, Langley B. Epigenetic changes following traumatic brain injury and their implications for outcome, recovery and therapy. Neurosci Lett. 2016;625:26–33. doi: 10.1016/j.neulet.2016.04.009. - DOI - PMC - PubMed

MeSH terms