. 2020 Jan 28;12(1):12.
doi: 10.1186/s13073-020-0710-2.

Interactions between the gut microbiome and host gene regulation in cystic fibrosis

Affiliations

Interactions between the gut microbiome and host gene regulation in cystic fibrosis

Gargi Dayama et al. Genome Med. .

Abstract

Background: Cystic fibrosis is the most common autosomal recessive genetic disease in Caucasians. It is caused by mutations in the CFTR gene, leading to poor hydration of mucus and impairment of the respiratory, digestive, and reproductive organ functions. Advancements in medical care have led to markedly increased longevity of patients with cystic fibrosis, but new complications have emerged, such as early onset of colorectal cancer. Although the pathogenesis of colorectal cancer in cystic fibrosis remains unclear, altered host-microbe interactions might play a critical role. To investigate this, we characterized changes in the microbiome and host gene expression in the colonic mucosa of cystic fibrosis patients relative to healthy controls, and identified host gene-microbiome interactions in the colon of cystic fibrosis patients.

Methods: We performed RNA-seq on colonic mucosa samples from cystic fibrosis patients and healthy controls to determine differentially expressed host genes. We also performed 16S rRNA sequencing to characterize the colonic mucosal microbiome and identify gut microbes that are differentially abundant between patients and healthy controls. Lastly, we modeled associations between relative abundances of specific bacterial taxa in the gut mucosa and host gene expression.

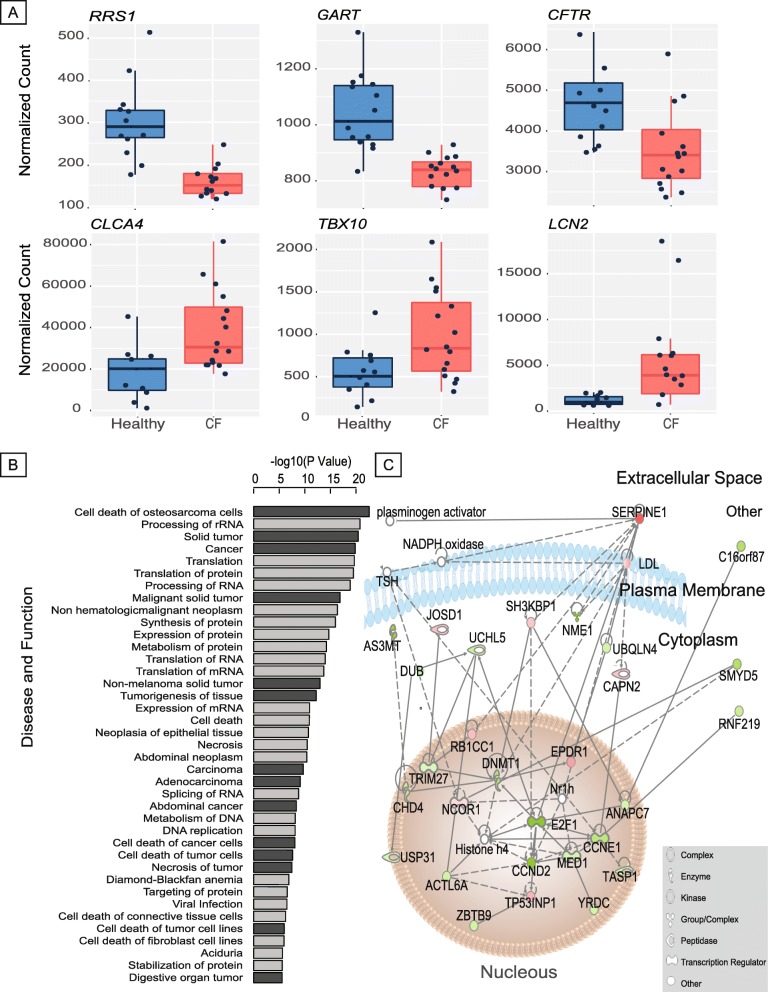
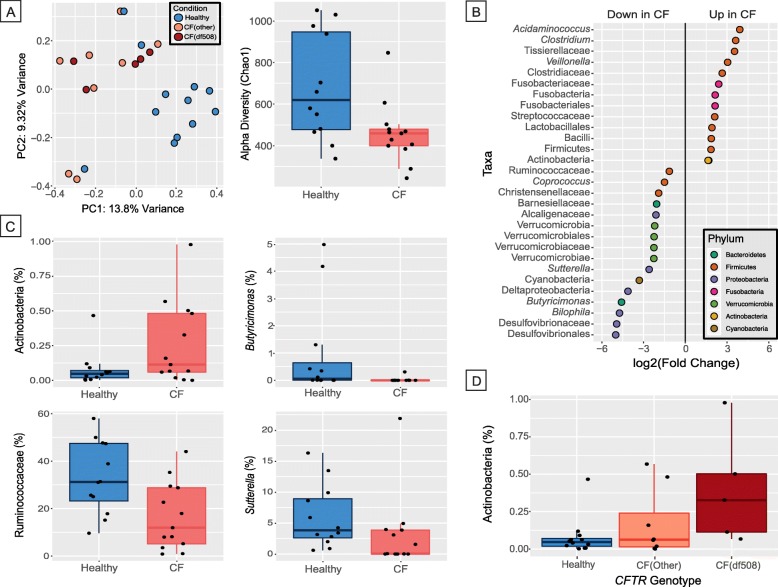
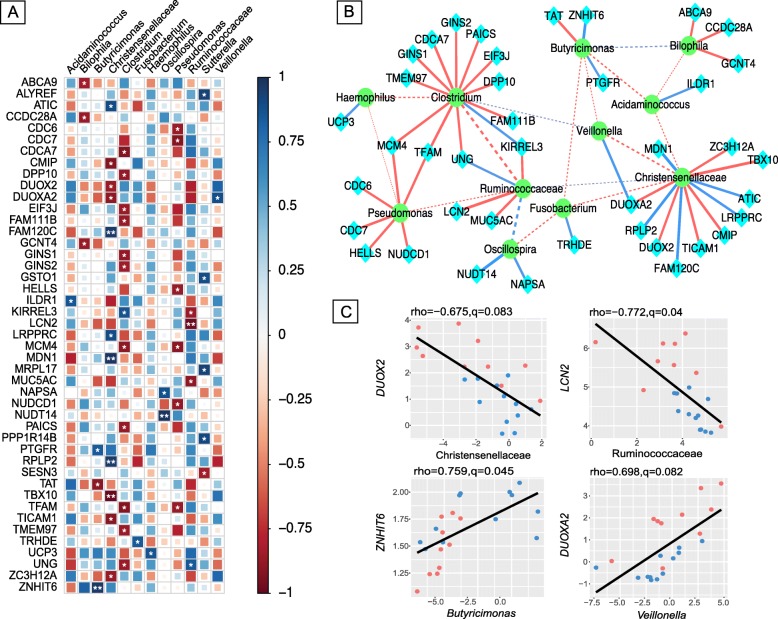
Results: We find that 1543 genes, including CFTR, show differential expression in the colon of cystic fibrosis patients compared to healthy controls. These genes are enriched with functions related to gastrointestinal and colorectal cancer, such as metastasis of colorectal cancer, tumor suppression, p53, and mTOR signaling pathways. In addition, patients with cystic fibrosis show decreased gut microbial diversity, decreased abundance of butyrate producing bacteria, such as Ruminococcaceae and Butyricimonas, and increased abundance of other taxa, such as Actinobacteria and Clostridium. An integrative analysis identified colorectal cancer-related genes, including LCN2 and DUOX2, for which gene expression is correlated with the abundance of colorectal cancer-associated bacteria, such as Ruminococcaceae and Veillonella.

Conclusions: In addition to characterizing host gene expression and mucosal microbiome in cystic fibrosis patients, our study explored the potential role of host-microbe interactions in the etiology of colorectal cancer in cystic fibrosis. Our results provide biomarkers that may potentially serve as targets for stratifying risk of colorectal cancer in patients with cystic fibrosis.

Keywords: Colorectal cancer; Cystic fibrosis; Gene regulation; Host-microbe interactions; Microbiome.


Conflict of interest statement

The authors declare that they have no competing interests.

Figures

Fig. 1
Fig. 1
Differentially expressed (DE) genes in the host. a Box plot of six genes that are a part of the gastrointestinal cancer pathway (one of the key disease pathways influenced by DE gene at q value < 0.05 cutoff), showing differential expression between healthy and CF samples. b Disease and functional pathways that are most significantly enriched with DE genes (q value < 0.05), sorted by the p value (cut off − log10(p value) < 5). The dark gray bars represent cancer-related pathways. c Gastrointestinal cancer pathway gene network with upregulated genes represented in green and downregulated genes represented in red. The intensity of the color is indicative of higher (brighter) or lower (duller) difference in expression. The shapes represent each protein’s role (see legend) and the figure also illustrates the part of the cell they are most active in
Fig. 2
Fig. 2
Differences between cystic fibrosis (CF) and healthy gut mucosal microbiota. a (left) Principal coordinate analysis plot based on Bray-Curtis distance indicating difference in beta-diversity between CF and healthy gut mucosal microbiome. The axes represent the percentage variance along the first two principal components and the color of samples indicates their mutation status, i.e., Healthy, CF (other), and CF (df508); (right) Boxplot depicting difference in alpha diversity (Chao1 metric) between CF and healthy gut microbiome. b Dotplot showing significantly differentially abundant OTUs (q value < 0.1), where OTUs are grouped by genera along the y-axis and colored by phylum. The x-axis indicates the log2 fold-change in CF compared to healthy as baseline. c Boxplots indicating the percentage relative abundance of taxa showing differential abundance between CF and healthy gut microbiome (q value < 0.1). d Boxplot depicting gradient-like trend in abundance for Actinobacteria for three genotypes—Healthy, CF (other), and CF (df508)
Fig. 3
Fig. 3
Interactions between genes associated with colorectal cancer and gut mucosal microbes. a Correlation plot depicting gene-microbe correlations. Color and size of the squares indicate the magnitude of the correlation, asterisks indicate significance of correlation (** indicates q value < 0.05 and * indicates q value < 0.1). b Network visualizing significant gene-microbe correlations (solid edges, q value < 0.1) and significant microbe-microbe correlations (dashed edges, SparCC |R| > =0.1 and p value < 0.05). Blue edges indicate positive correlation and red edges indicate negative correlation. Edge thickness represents the strength of the correlation. c Scatterplots depicting pattern of grouping by cystic fibrosis (red) and healthy (blue) samples in a few representative gene-microbe correlations, where the strength of correlation (Spearman rho) and significance (q) is indicated at the top of each plot

References

    1. O’Sullivan BP, Freedman SD. Cystic fibrosis. Lancet. 2009;373:1891–1904. doi: 10.1016/S0140-6736(09)60327-5. - DOI - PubMed
    1. Maisonneuve P, Marshall BC, Knapp EA, Lowenfels AB. Cancer risk in cystic fibrosis: a 20-year nationwide study from the United States. J Natl Cancer Inst. 2013;105:122–129. doi: 10.1093/jnci/djs481. - DOI - PubMed
    1. Yamada A, Komaki Y, Komaki F, Micic D, Zullow S, Sakuraba A. Risk of gastrointestinal cancers in patients with cystic fibrosis: a systematic review and meta-analysis. Lancet Oncol. 2018;19:758–767. doi: 10.1016/S1470-2045(18)30188-8. - DOI - PubMed
    1. Niccum DE, Billings JL, Dunitz JM, Khoruts A. Colonoscopic screening shows increased early incidence and progression of adenomas in cystic fibrosis. J Cyst Fibros. 2016;15:548–553. doi: 10.1016/j.jcf.2016.01.002. - DOI - PMC - PubMed
    1. Than BLN, Linnekamp JF, Starr TK, Largaespada DA, Rod A, Zhang Y, et al. CFTR is a tumor suppressor gene in murine and human intestinal cancer. Oncogene. 2016;35:4179–4187. doi: 10.1038/onc.2015.483. - DOI - PMC - PubMed