. 2020 Apr 1;80(7):1551-1563.
doi: 10.1158/0008-5472.CAN-19-3183. Epub 2020 Jan 28.

Single-Cell Proteomic Profiling Identifies Combined AXL and JAK1 Inhibition as a Novel Therapeutic Strategy for Lung Cancer

Affiliations

Single-Cell Proteomic Profiling Identifies Combined AXL and JAK1 Inhibition as a Novel Therapeutic Strategy for Lung Cancer

Josephine A Taverna et al. Cancer Res. .

Abstract

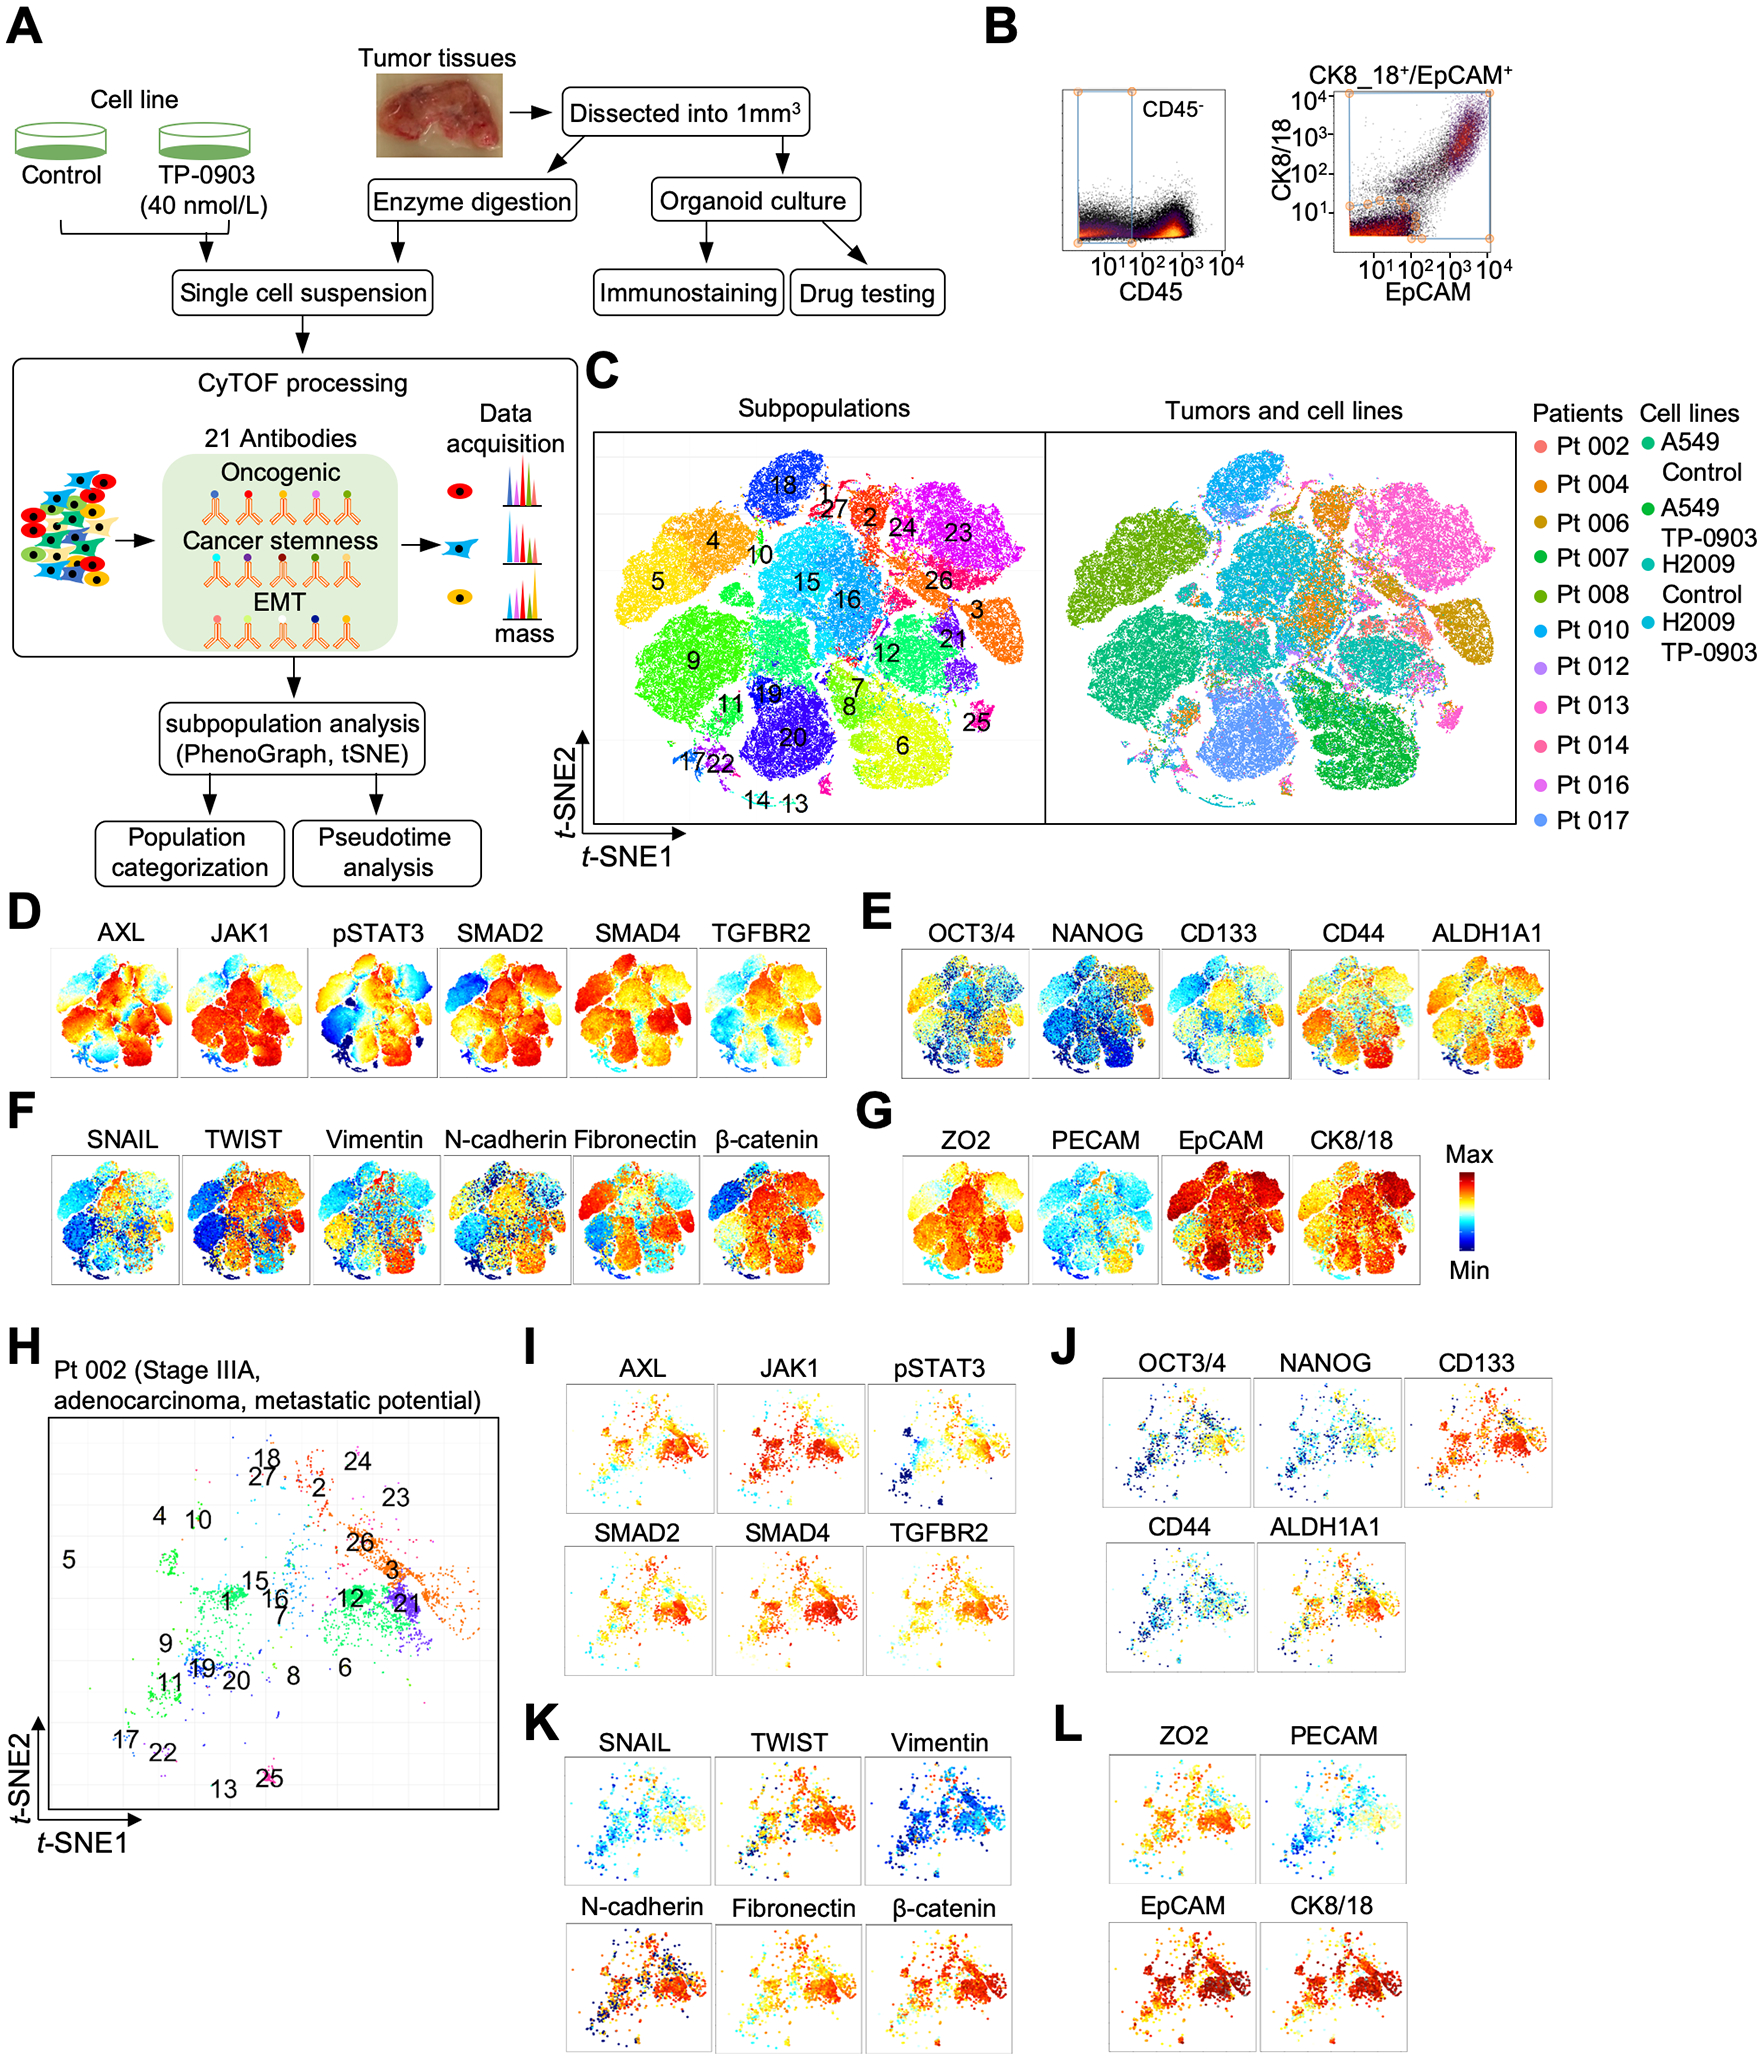
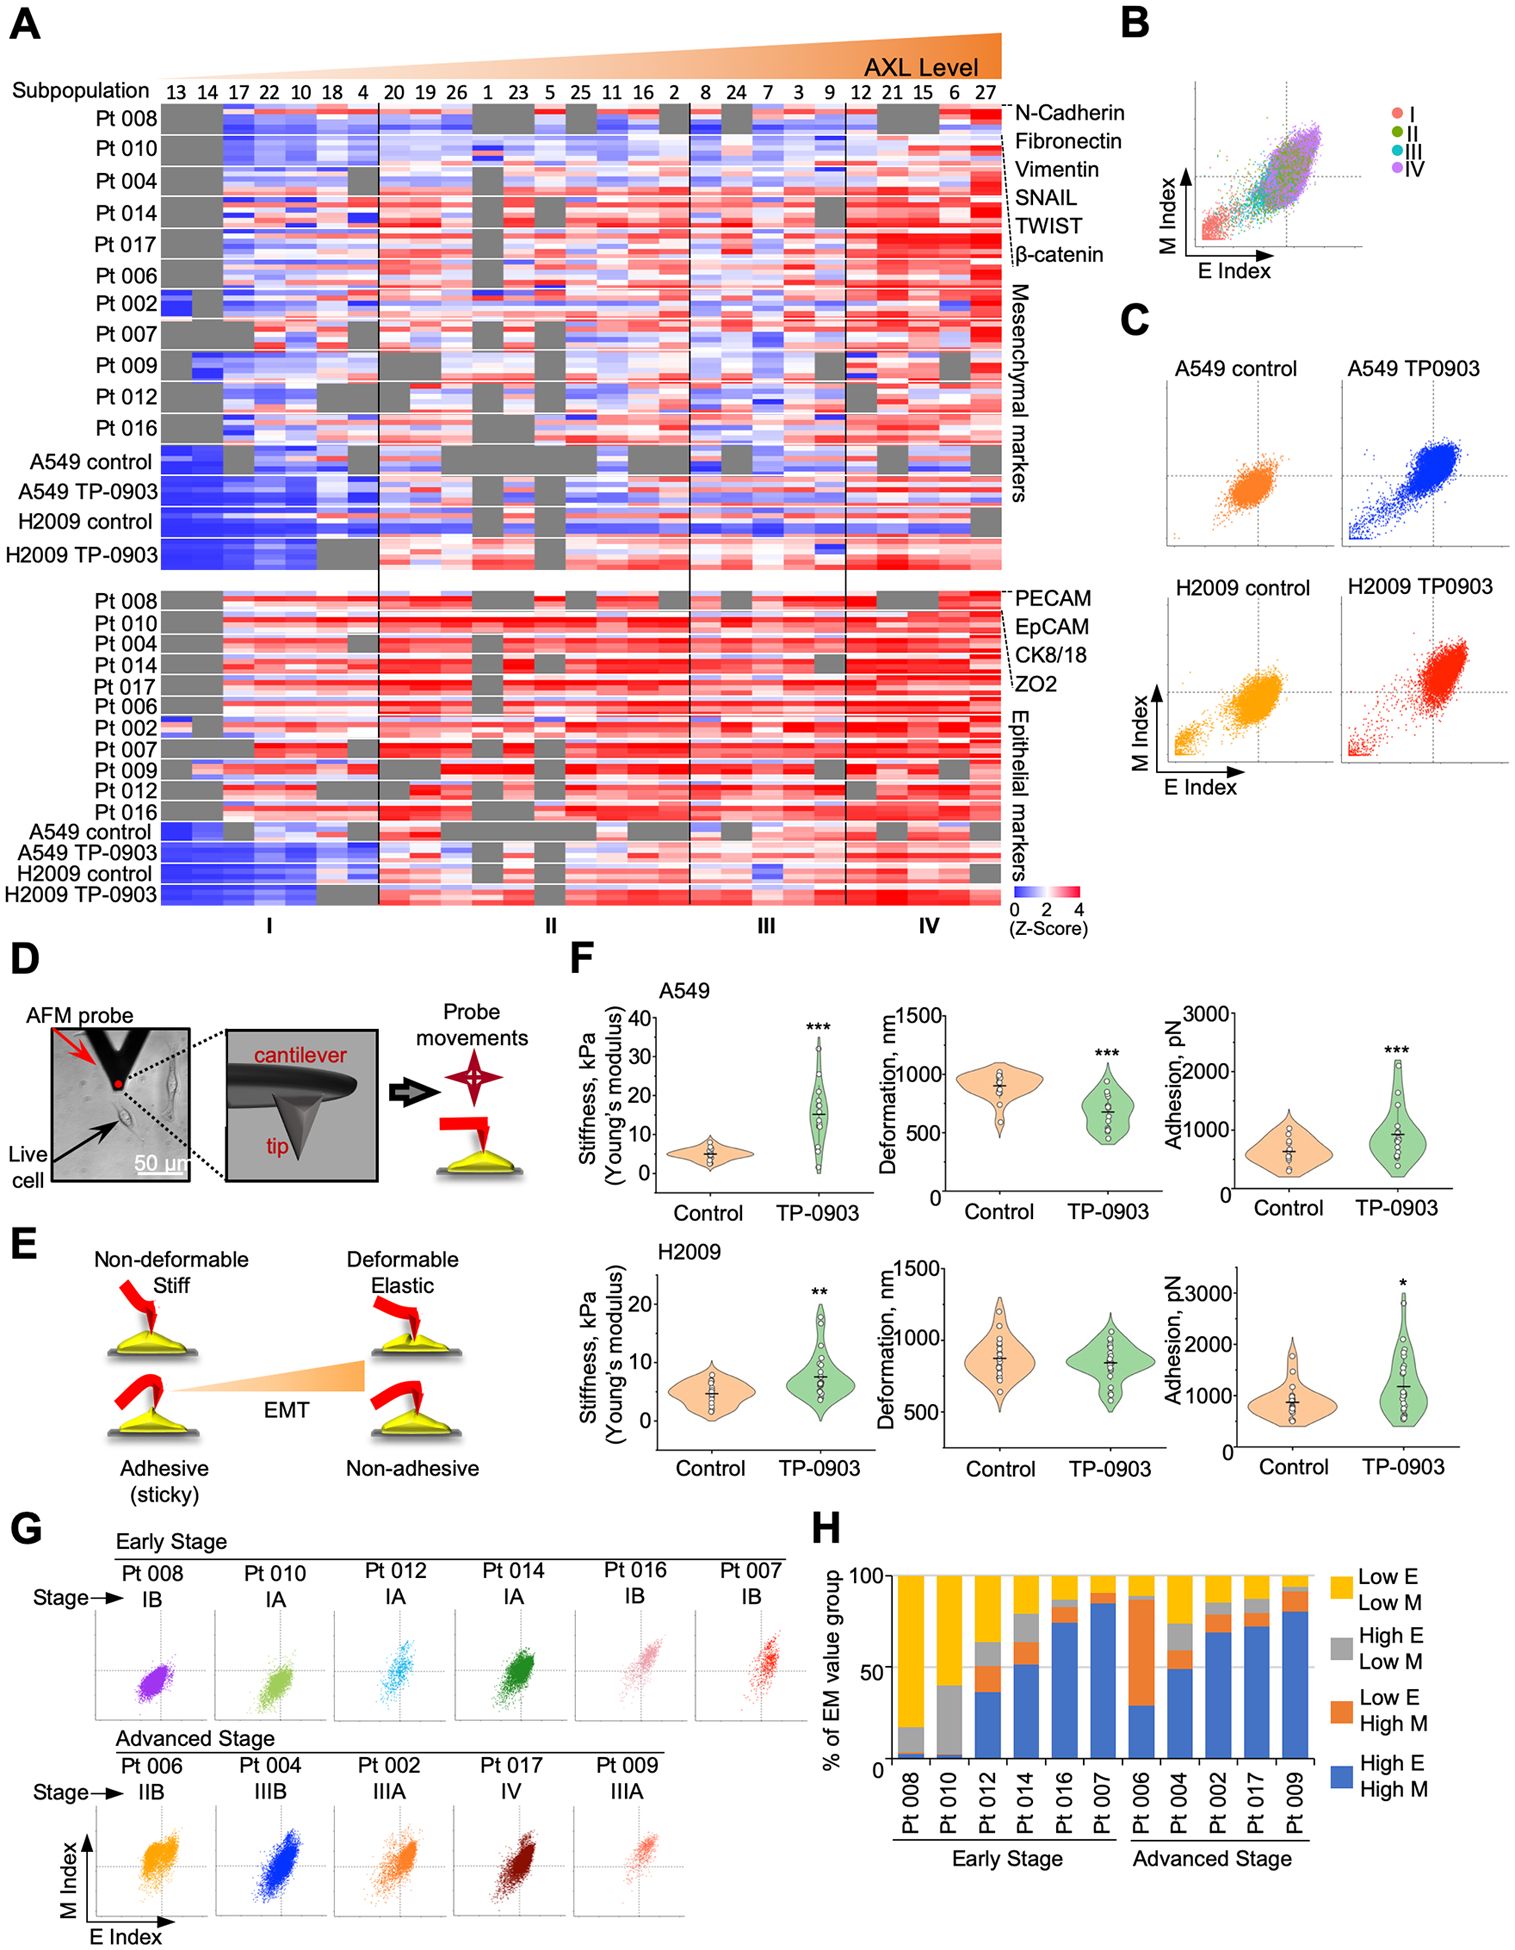
Cytometry by time-of-flight (CyTOF) simultaneously measures multiple cellular proteins at the single-cell level and is used to assess intertumor and intratumor heterogeneity. This approach may be used to investigate the variability of individual tumor responses to treatments. Herein, we stratified lung tumor subpopulations based on AXL signaling as a potential targeting strategy. Integrative transcriptome analyses were used to investigate how TP-0903, an AXL kinase inhibitor, influences redundant oncogenic pathways in metastatic lung cancer cells. CyTOF profiling revealed that AXL inhibition suppressed SMAD4/TGFβ signaling and induced JAK1-STAT3 signaling to compensate for the loss of AXL. Interestingly, high JAK1-STAT3 was associated with increased levels of AXL in treatment-naïve tumors. Tumors with high AXL, TGFβ, and JAK1 signaling concomitantly displayed CD133-mediated cancer stemness and hybrid epithelial-to-mesenchymal transition features in advanced-stage patients, suggesting greater potential for distant dissemination. Diffusion pseudotime analysis revealed cell-fate trajectories among four different categories that were linked to clinicopathologic features for each patient. Patient-derived organoids (PDO) obtained from tumors with high AXL and JAK1 were sensitive to TP-0903 and ruxolitinib (JAK inhibitor) treatments, supporting the CyTOF findings. This study shows that single-cell proteomic profiling of treatment-naïve lung tumors, coupled with ex vivo testing of PDOs, identifies continuous AXL, TGFβ, and JAK1-STAT3 signal activation in select tumors that may be targeted by combined AXL-JAK1 inhibition. SIGNIFICANCE: Single-cell proteomic profiling of clinical samples may facilitate the optimal selection of novel drug targets, interpretation of early-phase clinical trial data, and development of predictive biomarkers valuable for patient stratification.


Conflict of interest statement

Disclosure of Potential Conflicts of Interest: J.A.T. serves has no financial disclosures to report. M.W. and L.M. serve as directors of Biomarker Drug Discovery for Tolero Pharmaceuticals. S.W. is principal scientist at Tolero Pharmaceuticals. D.J.B. is the CEO of Tolero Pharmaceuticals. No potential conflicts of interest were disclosed by the other authors.

Figures

Figure 1.
Figure 1.
Cytometry by mass-of-flight (CyTOF) profiling of oncogenic signaling, cancer stemness, and epithelial-mesenchymal transition (EMT) in lung tumors and cell lines. A, A flow chart was drawn to illustrate the CyTOF and organoid processing. B, Tumor epithelial cells were identified based on CD45/CK8+/18+/EpCAM+ profiles. C, t-distributed stochastic neighbor embedding (t-SNE) scatter plots stratified 27 subpopulations derived from different lung tumors and cell lines. D-G, t-SNE scatter plots were utilized to display expression levels of oncogenic signaling components and markers for cancer stemness and epithelial-mesenchymal transition (EMT). H, t-SNE scatter plot of subpopulations in a patient (Pt 002). See profiles of other patients in Supplementary Fig S5–S14. I-L, t-SNE scatter plots showed expression levels of oncogenic signaling components, markers for cancer stemness and EMT in Pt 002.
Figure 2.
Figure 2.
Single-cell profiling was performed using lung cancer cells treated with TP-0903 by cytometry by mass-of-flight (CyTOF). A, t-distributed stochastic neighbor embedding (t-SNE) scatter plots of subpopulations in A549 and H2009 cells treated with and without 40 nmol/L TP-0903. B-C, t-SNE scatter plots displaying expression levels of oncogenic signaling components in TP-0903-treated and untreated lung cancer cells. D, The bar graph of cell viability at 72 hr in TP-0903 and/or ruxolitinib treated A549 and H2009 cells (Duncan multiple range test; ***, P < 0.001). See the detailed description of treatment protocols in the Materials and Methods section.
Figure 3.
Figure 3.
Four categories among different subpopulations of lung cancer cell lines and lung tumors ordered by AXL expression levels. A, Subpopulations were aligned according to increasing AXL levels (violin plots). Expression heat maps of JAK1, pSTAT3, SMAD2, SAMD4 and TGFBR2 of each subpopulation were arranged accordingly. B, Sizes of each subpopulation in cell lines and lung tumors were indicated. C, Violin plots were employed to illustrate the six signaling components in cell lines and lung tumors. D, Percentage of four categories in patients and cell lines.
Figure 4.
Figure 4.
Features of cancer stemness in cancer cell lines and lung tumors. A, Expression heat maps of OCT3/4, NANOG, CD133, CD44 and ALDH1A1 of each subpopulation were aligned at an increasing AXL level in individual subpopulations. B, Violin plots were employed to highlight the five cancer stemness markers in four categories of cell lines and lung tumors. C, Expression of five cancer stemness markers in cell lines before and after 40 nmol/L TP-0903 treatment was compared in violin plots (Student t test; ***, P < 0.001). D, Expression of five cancer stemness markers in early- and advanced- stage patients shown as violin plots.
Figure 5.
Figure 5.
Profiles of epithelial-mesenchymal transition (EMT) in lung cancer cell lines and lung tumors. A, Expression heat maps of mesenchymal (M) and epithelial (E) markers of each subpopulation were aligned in order of increasing AXL levels accordingly. B-C, E and M index values in each subpopulation category of A549 and H2009 cells treated with and without TP-0903 were compared by scatter plots. D, A bright field image of H2009 cells probed with atomic force microscopy (AFM) is shown. A black triangle represents an AFM cantilever equipped with a scanning tip perpendicularly positioned (red dot). The 3D rendering of an AFM probe showed probe tip location. E, A schematic representation of AFM image formation is illustrated. F, Biophysical profiles (i.e., stiffness, deformation, and adhesion) were compared in A549 and H2009 cells with and without 40 nmol/L TP-0903 treatment. Each symbol represents a single-cell data point. Long vertical lines represent the mean and short vertical lines represent ±SD. (Student’s T-test; *, P < 0.05; **, P < 0.01; ***, P < 0.001) G, Scatter plots were plotted for E and M index values in each subpopulation category among patients’ cells. H, Percentages of different E/M groups were compared among early- and advanced-stage patients.
Figure 6.
Figure 6.
Pseudotime analysis and organoid testing of lung tumors. For patients’ clinicopathological information, see Supplementary Table S1. A, Diffusion maps of linear model. B, Diffusion maps of punctuated model. C, Diffusion maps of punctuated regression model. D, Flow chart of a short-term drug treatment process in patient-derived organoids (PDOs). E, Bright view images of organoid morphology (Scale bar = 500 μm). F, Examples of Immunofluorescence images of DAPI (blue), CD45 (red), pan-cytokeratin (green), and EpCAM (purple) in PDOs (Scale bar = 40 μm). G, Bar graph of cell viability at 72 hr in 20 nmol/L TP-0903 and/or 15 μmol/L ruxolitinib treated PDOs (Duncan multiple range test; *, P < 0.05; **, P < 0.01; ***, P < 0.001). Doses were selected based on in vitro testing of lung cancer cell lines (see Fig. 2D).

References

    1. Zhang G, Wang M, Zhao H, Cui W. Function of Axl receptor tyrosine kinase in non-small cell lung cancer. Oncol Lett 2018;15:2726–34. - PMC - PubMed
    1. Linger RM, Keating AK, Earp HS, Graham DK. Taking aim at Mer and Axl receptor tyrosine kinases as novel therapeutic targets in solid tumors. Expert Opin Ther Targets 2010;14:1073–90. - PMC - PubMed
    1. Bae SY, Hong JY, Lee HJ, Park HJ, Lee SK. Targeting the degradation of AXL receptor tyrosine kinase to overcome resistance in gefitinib-resistant non-small cell lung cancer. Oncotarget 2015;6:10146–60. - PMC - PubMed
    1. Byers LA, Diao L, Wang J, Saintigny P, Girard L, Peyton M, et al. An epithelial-mesenchymal transition gene signature predicts resistance to EGFR and PI3K inhibitors and identifies Axl as a therapeutic target for overcoming EGFR inhibitor resistance. Clin Cancer Res 2013;19:279–90. - PMC - PubMed
    1. Ishikawa M, Sonobe M, Nakayama E, Kobayashi M, Kikuchi R, Kitamura J, et al. Higher expression of receptor tyrosine kinase Axl, and differential expression of its ligand, Gas6, predict poor survival in lung adenocarcinoma patients. Ann Surg Oncol 2013;20 Suppl 3:S467–76. - PMC - PubMed

Publication types

MeSH terms