. 2020 Sep;69(9):1677-1690.
doi: 10.1136/gutjnl-2019-319091. Epub 2020 Jan 28.

TGF-β2 silencing to target biliary-derived liver diseases

Affiliations

TGF-β2 silencing to target biliary-derived liver diseases

Anne Dropmann et al. Gut. 2020 Sep.

Abstract

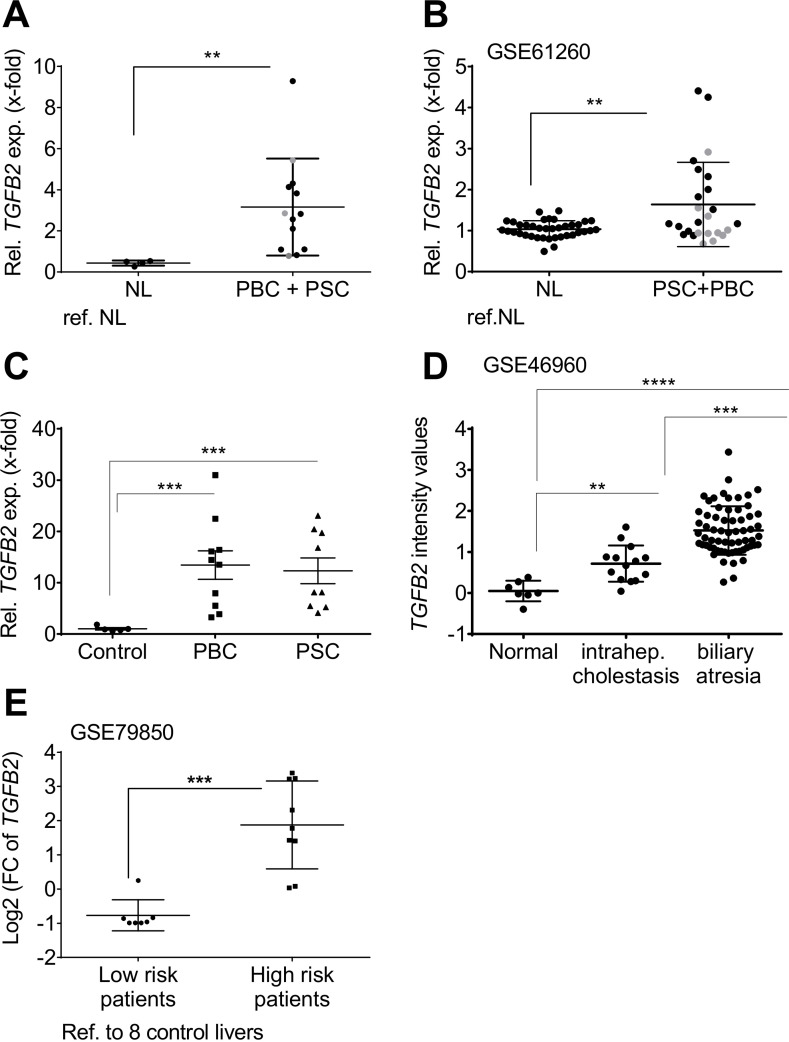
Objective: TGF-β2 (TGF-β, transforming growth factor beta), the less-investigated sibling of TGF-β1, is deregulated in rodent and human liver diseases. Former data from bile duct ligated and MDR2 knockout (KO) mouse models for human cholestatic liver disease suggested an involvement of TGF-β2 in biliary-derived liver diseases.

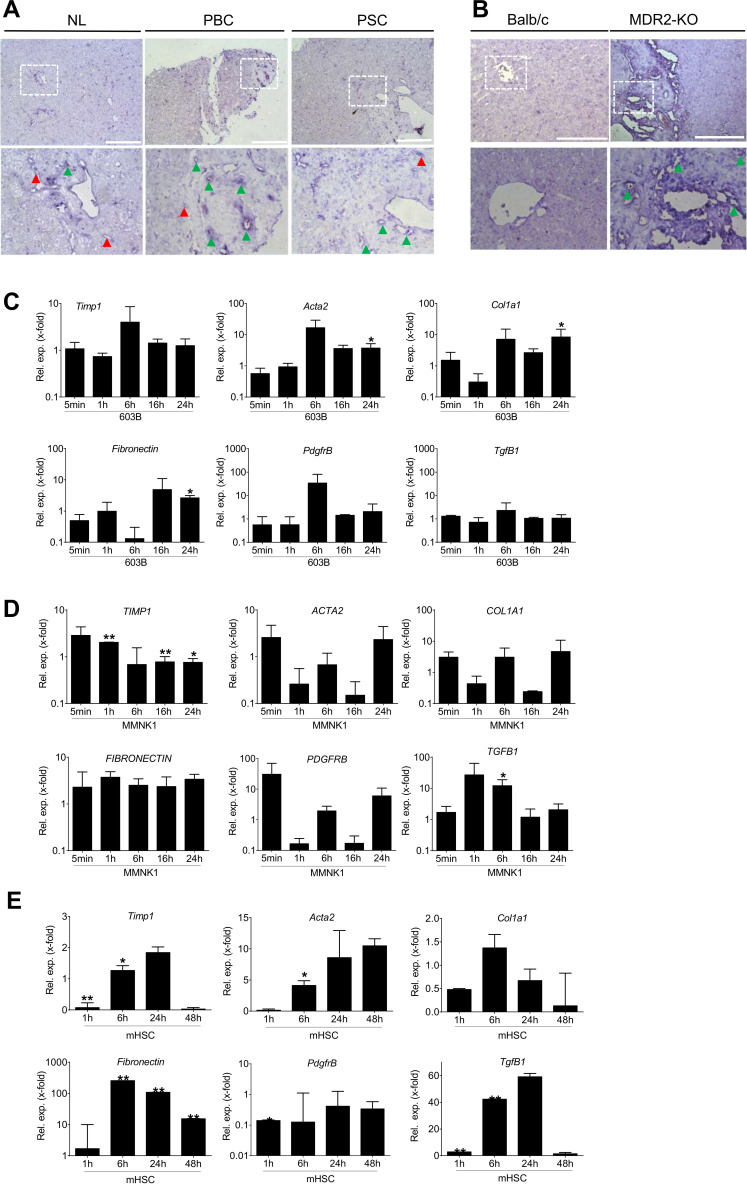
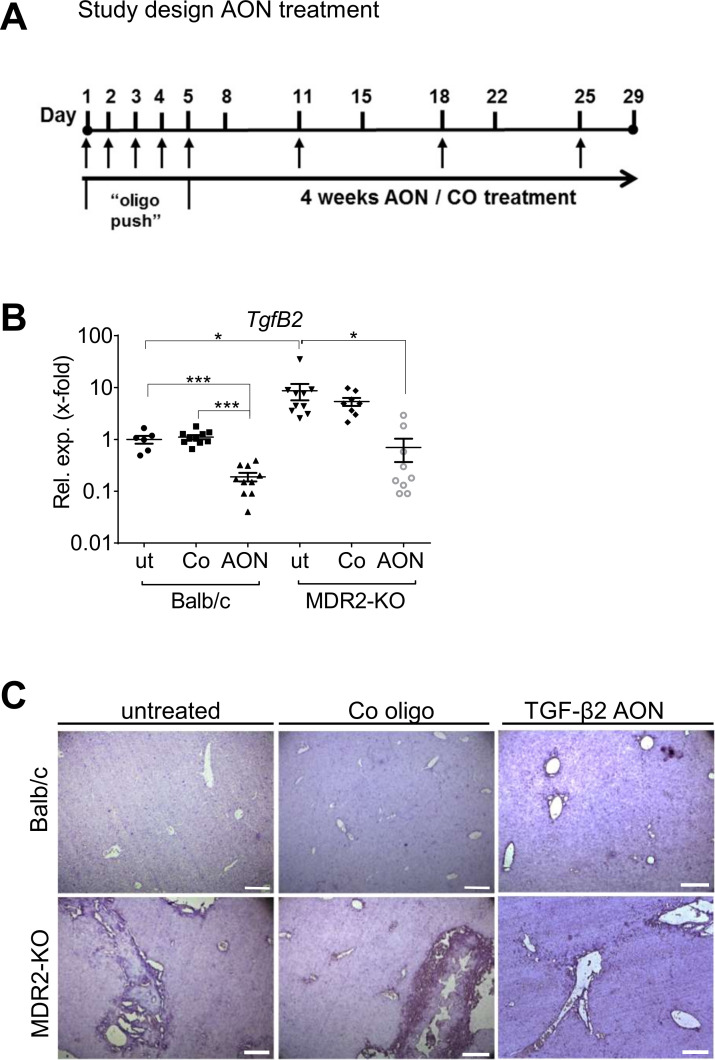
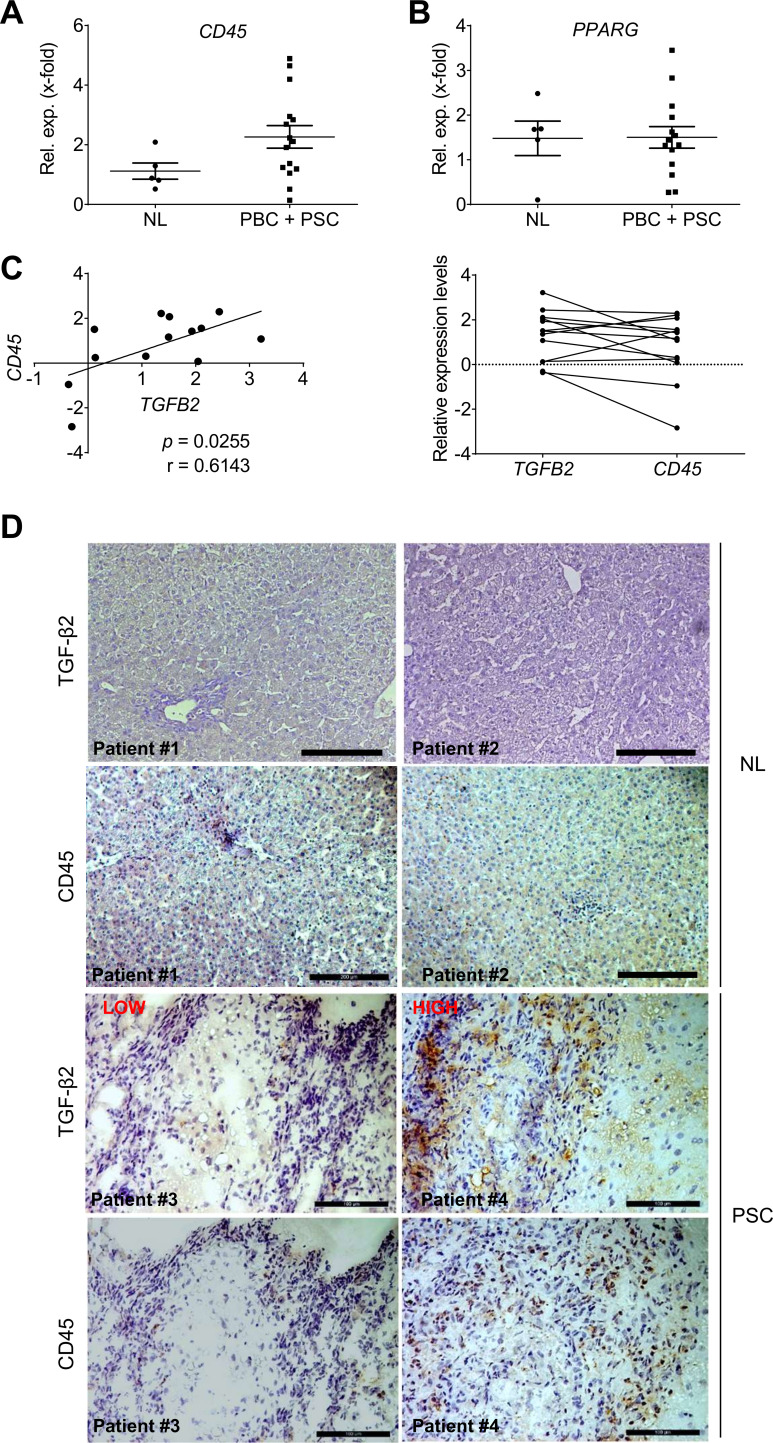
Design: As we also found upregulated TGFB2 in liver tissue of patients with primary sclerosing cholangitis (PSC) and primary biliary cholangitis (PBC), we now fathomed the positive prospects of targeting TGF-β2 in early stage biliary liver disease using the MDR2-KO mice. Specifically, the influence of TgfB2 silencing on the fibrotic and inflammatory niche was analysed on molecular, cellular and tissue levels.

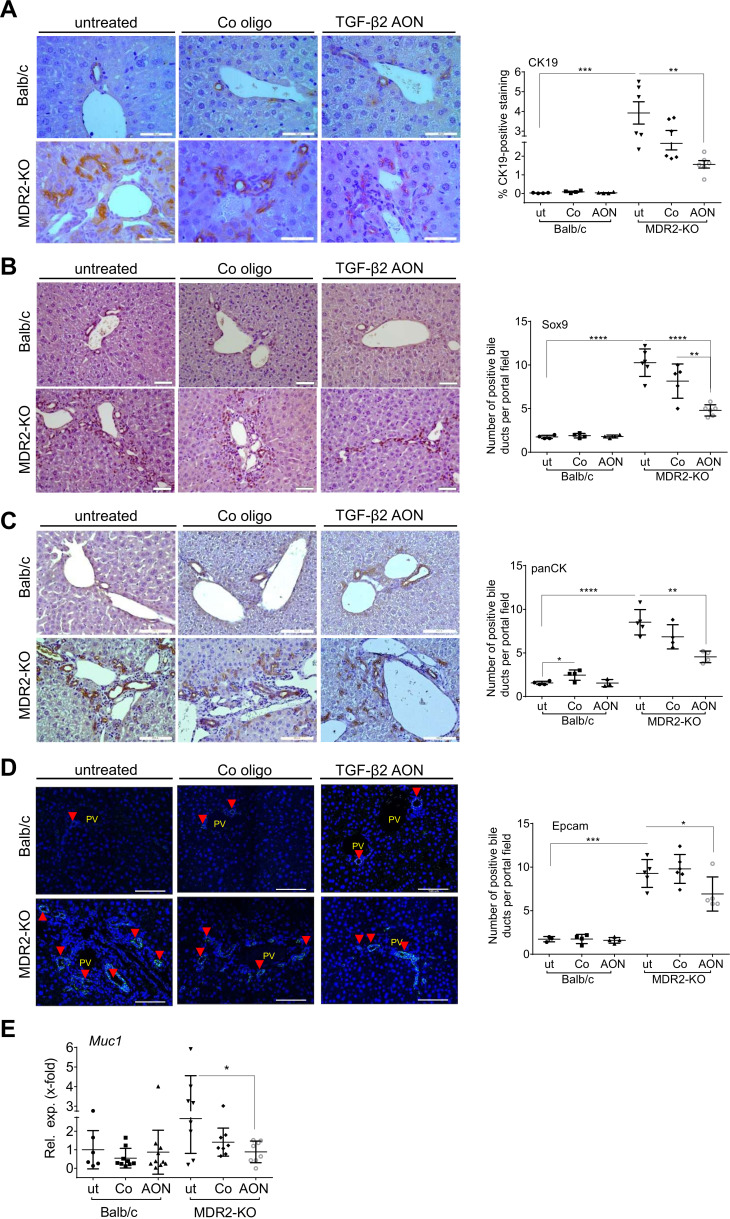
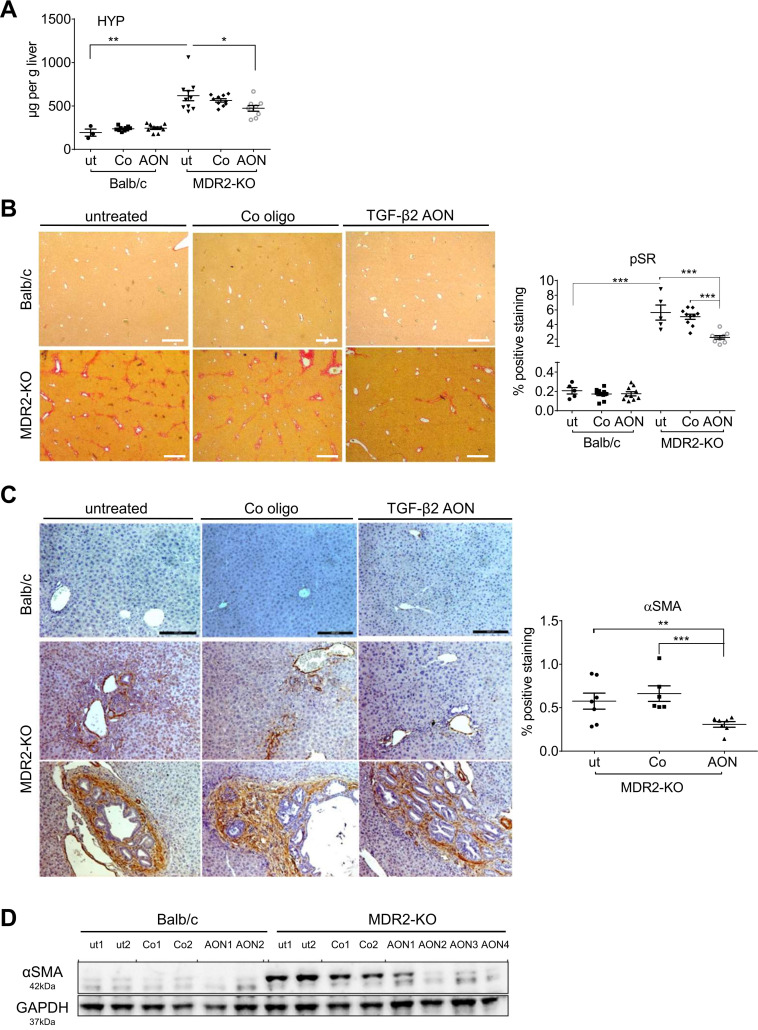
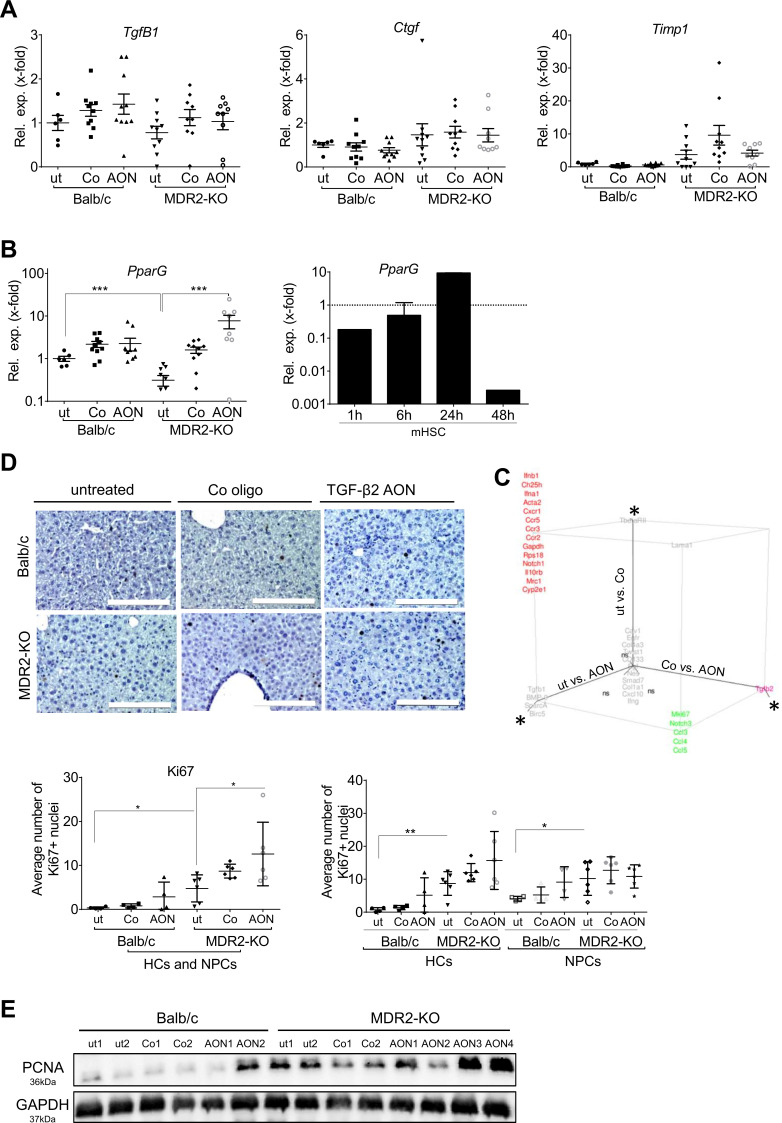
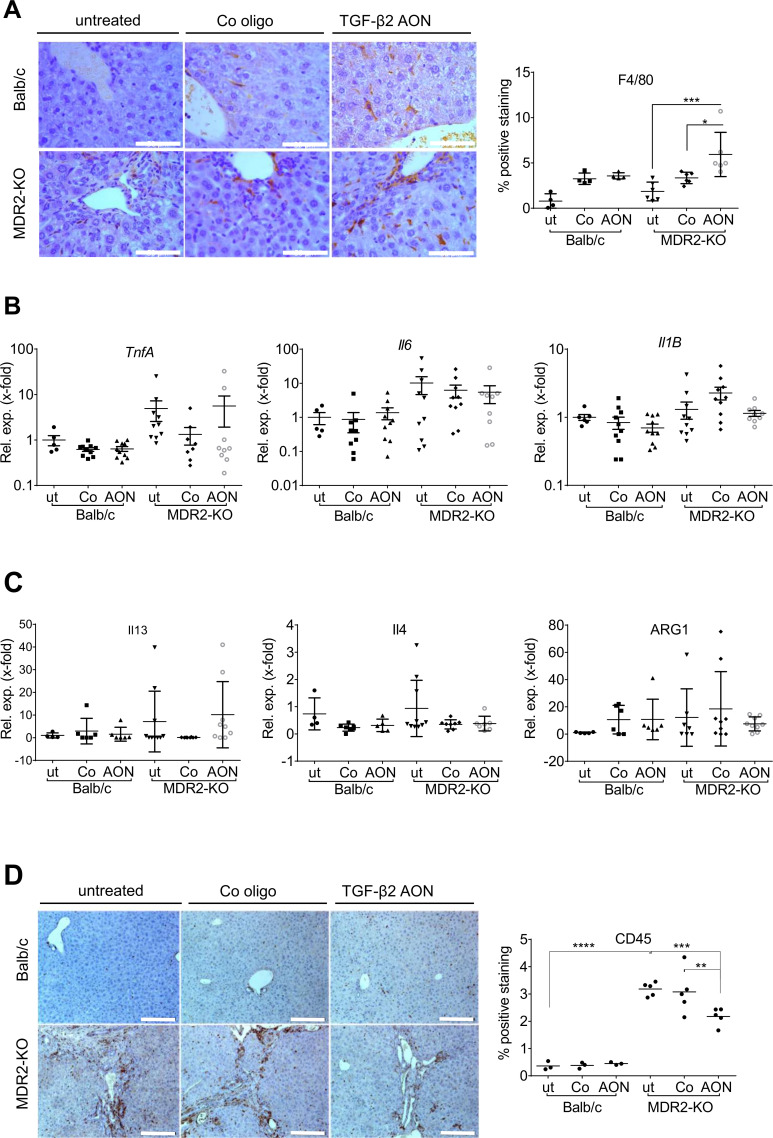
Results: TgfB2-induced expression of fibrotic genes in cholangiocytes and hepatic stellate cellswas detected. TgfB2 expression in MDR2-KO mice was blunted using TgfB2-directed antisense oligonucleotides (AON). Upon AON treatment, reduced collagen deposition, hydroxyproline content and αSMA expression as well as induced PparG expression reflected a significant reduction of fibrogenesis without adverse effects on healthy livers. Expression analyses of fibrotic and inflammatory genes revealed AON-specific regulatory effects on Ccl3, Ccl4, Ccl5, Mki67 and Notch3 expression. Further, AON treatment of MDR2-KO mice increased tissue infiltration by F4/80-positive cells including eosinophils, whereas the number of CD45-positive inflammatory cells decreased. In line, TGFB2 and CD45 expression correlated positively in PSC/PBC patients and localised in similar areas of the diseased liver tissue.

Conclusions: Taken together, our data suggest a new mechanistic explanation for amelioration of fibrogenesis by TGF-β2 silencing and provide a direct rationale for TGF-β2-directed drug development.

Keywords: TGF-beta; cholestasis; fibrosis; primary biliary cirrhosis; primary sclerosing cholangitis.


Conflict of interest statement

Competing interests: Isarna Therapeutics GmbH supported this study financially. The company develops TGF-β isoform specific antisense oligonucleotides for therapeutic approaches. However, the company did not influence experimental design and data interpretation. KW, HK and MJ were employed by Isarna Therapeutics at the time of contribution. The position of AD was funded by Isarna Therapeutics.

Figures

Figure 1
Figure 1
Patient resolved expression of TGFB2 in tissue of cholestatic liver disease patients compared with healthy individuals. Expression changes of TGFB2 in liver tissue of individual patients represented as single dots in (A) the PSC/PBC cohort from Regensburg, (B) the collective GSE61260, (C) the PBC and PSC cohort from Poland, (D) the cohort GSE46960 and (E) in low-risk and high-risk patients described in GSE79850 as determined in comparison to non-diseased control livers. In (E), low-risk patients responded fully to UDCA treatment. High risk was assigned to the need of liver transplantation in the course of disease. Grey dots: PBC; black dots: PSC; **p≤0.01; ***p≤0.001; ****p≤0.0001; NL, normal liver; PBC, primary biliary cholangitis; PSC, primary sclerosing cholangitis; TGFB, transforming growth factor beta; UDCA, ursodeoxycholic acid.
Figure 2
Figure 2
Localisation of TgfB2/TGFB2 in human and murine liver tissue and TGF-β2 treatment of primary mouse HSCs as well as mouse and human cholangiocyte cell lines. In situ hybridisation was performed to assess TGFB2/TgfB2 localisation in (A) healthy liver tissue and PSC/PBC patients as well as (B) wild-type and MDR2-KO mice. In PSC and PBC patients as well as MDR2-KO mice, TGFB2 was localised in portal tracts (green arrow heads) and fibrotic rearranged tissue areas. Additional staining was detected in sinusoids (red arrow heads) of the patients’ tissue. Lower panels represent enlarged images of boxed areas in the upper panel. Scale bars indicate 200 µm. Expression of fibrotic marker genes was induced in (C) murine 603B, (D) human MMNK1 cells and (E) primary mouse hepatic stellate cells on treatment with TGF-β2. Fold expression is given as referred to the correlating untreated control of each time point. Error bars indicate SD. *p≤0.05;**p≤0.01. Acta2, actin alpha 2 or alpha smooth muscle actin; Col1a1, collagen type I alpha 1; HSC, hepatic stellate cells; MDR2-KO, multidrug resistance gene 2 knockout; NL, normal liver; PBC, primary biliary cirrhosis; PdgfrB, platelet-derived growth factor receptor beta; PSC, primary sclerosing cholangitis; TGFB, transforming growth factor beta; TIMP, tissue inhibitor of metalloproteinase.
Figure 3
Figure 3
Study design and AON-mediated TgfB2 downregulation. (A) Schedule of animal treatment with control or TgfB2-specific AONs. TgfB2 expression was significantly downregulated in Balb/c and MDR2-KO animals treated with AONs as (B) analysed by qPCR and (C) visualised by in situ hybridisation. *p≤0.05, ***p≤0.001. Scale bars indicate 200 µm. AON, antisense oligonucleotides; MDR2-KO, multidrug resistance gene 2 knockout; TGFB, transforming growth factor beta.
Figure 4
Figure 4
TgfB2-silencing by AONs reduced biliary damage and ductular reactions (DR). Immunohistochemical staining of (A) CK19, (B) Sox9, (C) and panCK, as well as (D) immunofluorescence-based detection of Epcam as a markers of DR and (E) qPCR of Muc1 as a marker of biliary damage revealed significant downregulation in AON-treated MDR2-KO mice. *p≤0.05, **p≤0.01, ***p≤0.001, ****p≤0.0001; scale bars indicate 50 µm for CK19, and 100 µm for Sox9, panCK and Epcam. AON, antisense oligonucleotides; MDR2-KO, multidrug resistance gene 2 knockout; Muc, Mucin; TGFB, transforming growth factor beta.
Figure 5
Figure 5
Impact of AON-mediated TgfB2 silencing on collagen expression and deposition as well as αSMA expression in MDR2-KO mice. (A) Hydroxyproline (HYP) content in the liver of AON-treated MDR2-KO mice was significantly downregulated compared with untreated and control oligo-treated animals. (B) Sirius red staining (pSR) revealed significant downregulation (~56%) of collagen deposition in the tissue of AON-treated compared with untreated MDR2-KO mice. Scale bars indicate 500 µm. (C) Immunohistochemical staining demonstrated a decrease of αSMA expression in AON-treated animals of 35% compared with untreated animals and 43% compared with animals treated with control oligos. Scale bars indicate 200 µm. (D) Reduction was verified by immunoblot analysis. *p≤0.05, **p≤0.01, ***p≤0.001. AON, antisense oligonucleotides; MDR2-KO, multidrug resistance gene 2 knockout; SMA, smooth muscle actin; TGFB, transforming growth factor beta.
Figure 6
Figure 6
Regulation of fibrosis marker gene expression by TgfB2 silencing. (A) TgfB1, Ctgf and Timp1 mRNA expression was not considerably changed by TgfB2-directed AON treatment. (B) Expression of antifibrotic and anti-inflammatory PparG was markedly upregulated by AONs in MDR2-KO mice. According to a profibrotic role of TGF-β2, TGF-β2 treatment of primary mHSCs inhibited PparG expression. Error bars represent SD for the mHSC experiment. ***p≤0.001. (C) Fluidigm analysis of fibrotic and inflammation-related marker genes (see online supplementary table 6) revealed specific AON-based effects of TgfB2 downregulation as well as placebo-associated effects of oligo treatment in MDR2-KO mice (also see online supplementary table 5) presented as 3D plot. Log2FC values are shown. Changes were considered significant, if Log2FC was >0.5 or <−0.5 and one-way analysis of variance plus Tukey analysis revealed p-values<0.05, here shown as *; ns=non-significant. (D) Ki67 expression was detected by immunohistochemistry in liver tissue of treated and untreated Balb/c and MDR2-KO mice. Quantification was performed for all cells as well as separated for hepatocytes (HC) and non-parenchymal cells (NPC). *p≤0.05, **p≤0.01. Scale bars indicate 200 µm. (E) Immunoblot analysis of PCNA expression. AON, antisense oligonucleotides; Ctgf, connective tissue growth factor; MDR2-KO, multidrug resistance gene 2 knockout; PCNA, proliferating cell nuclear antigen; Ppar, peroxisome proliferator-activated receptor; TGFB, transforming growth factor beta; Timp, tissue inhibitor of metalloproteinases.
Figure 7
Figure 7
Infiltration of immune cells into the liver tissue of AON-treated MDR2-KO mice compared with controls. An anti-inflammatory role of TGF-β2 was suggested. (A) In AON-treated MDR2-KO mice, increased amounts of resident F4/80-positive macrophages were detected. These are probably not polarised to typical M1 or M2 phenotypes as levels of (B) TnfA, Il6 and Il1B and (C) Il13, Il4 and Arg1 were not changed by AON treatment. (D) Immunohistochemical staining of CD45 revealed significant downregulation in AON-treated MDR2-KO mice. *p≤0.05, **p≤0.01, ***p≤0.001. Scale bars indicate (A) 50 µm or (D) 200 µm. AON, antisense oligonucleotides; Arg, arginase; Il, interleucin; MDR2-KO, multidrug resistance gene 2 knockout; TGFB, transforming growth factor beta; Tnfa, tumour necrosis factor-alpha.
Figure 8
Figure 8
Analysis of inflammation marker expression with respect to TGFB2 expression in PSC and PBC patients (Regensburg cohort). Expression of (A) CD45 and (B) PPARG in liver tissue of PSC and PBC patients was determined. (C) CD45 expression levels correlated with TGFB2 expression levels of the same patients (left: Pearson Correlation p TGFB2/CD45=0.0255; rTGFB2/CD45=0.61). (D) Immunohistochemical staining of TGF-β2 and CD45 in liver tissue of PSC patients with low (patient 3) and high (patient 4) CD45 levels as well as healthy controls (patient 1, 2=NL). Scale bars indicate 200 µm for NL, for PSC scale bars indicate 100 µm. NL, normal liver; PBC, primary biliary cirrhosis; PPAR, peroxisome proliferator-activated receptor; PSC, primary sclerosing cholangitis; TGFB, transforming growth factor beta.

References

    1. Jepsen P, Grønbæk L, Vilstrup H. Worldwide incidence of autoimmune liver disease. Dig Dis 2015;33 Suppl 2:2–12. 10.1159/000440705 - DOI - PubMed
    1. Liberal R, Grant CR. Cirrhosis and autoimmune liver disease: current understanding. World J Hepatol 2016;8:1157–68. 10.4254/wjh.v8.i28.1157 - DOI - PMC - PubMed
    1. Prince M, Chetwynd A, Newman W, et al. . Survival and symptom progression in a geographically based cohort of patients with primary biliary cirrhosis: follow-up for up to 28 years. Gastroenterology 2002;123:1044–51. 10.1053/gast.2002.36027 - DOI - PubMed
    1. Christensen E, Neuberger J, Crowe J, et al. . Azathioprine and prognosis in primary biliary cirrhosis. Gastroenterology 1986;90:508–9. 10.1016/0016-5085(86)90972-8 - DOI - PubMed
    1. Broomé U, Olsson R, Lööf L, et al. . Natural history and prognostic factors in 305 Swedish patients with primary sclerosing cholangitis. Gut 1996;38:610–5. 10.1136/gut.38.4.610 - DOI - PMC - PubMed

Publication types

MeSH terms

Substances