. 2020 Mar 6;295(10):3239-3246.
doi: 10.1074/jbc.RA119.010509. Epub 2020 Jan 28.

The murine CD94/NKG2 ligand, Qa-1b, is a high-affinity, functional ligand for the CD8αα homodimer

Affiliations

The murine CD94/NKG2 ligand, Qa-1b, is a high-affinity, functional ligand for the CD8αα homodimer

Katharine Jennifer Goodall et al. J Biol Chem. .

Abstract

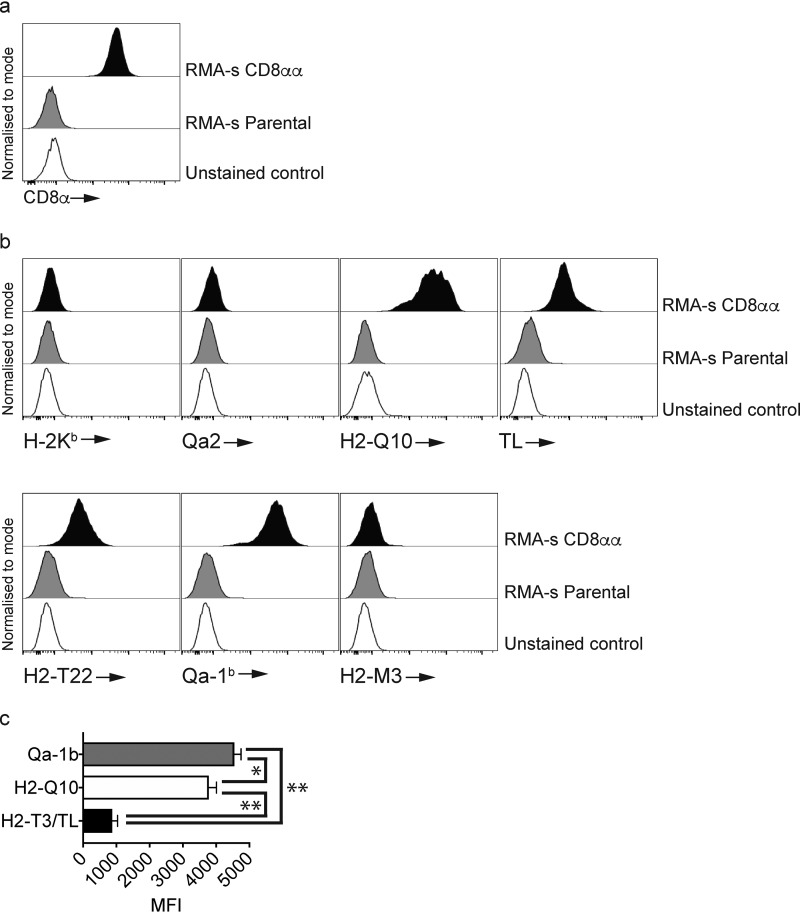
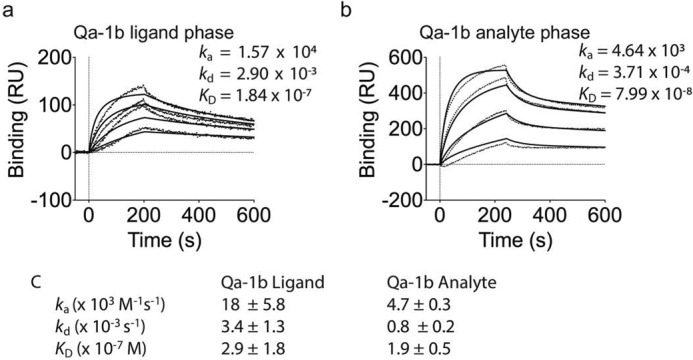
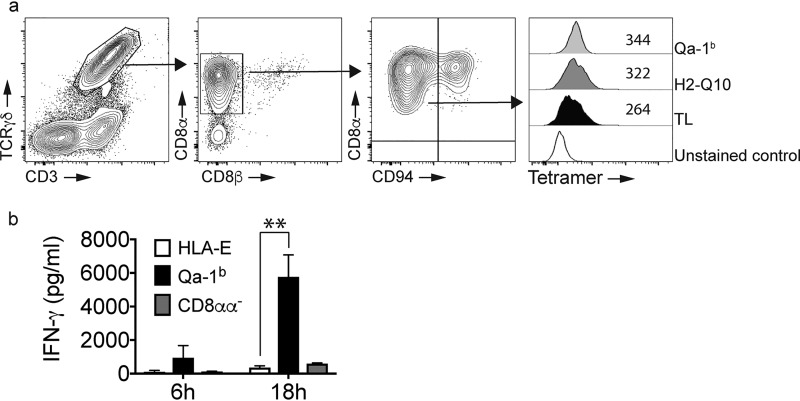
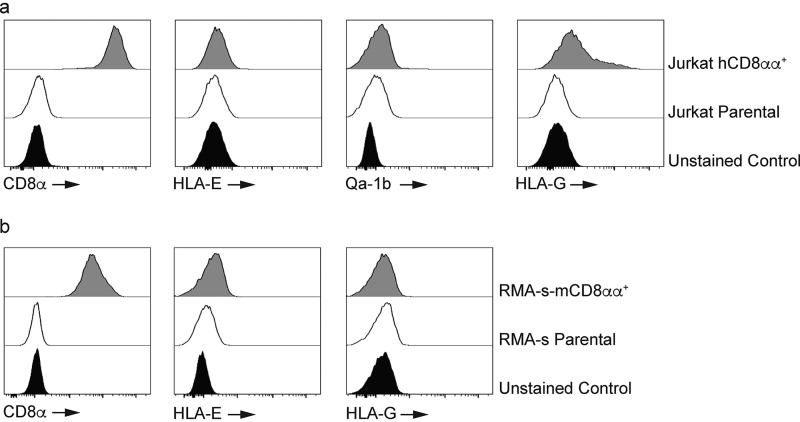
The immune co-receptor CD8 molecule (CD8) has two subunits, CD8α and CD8β, which can assemble into homo or heterodimers. Nonclassical (class-Ib) major histocompatibility complex (MHC) molecules (MHC-Ibs) have recently been identified as ligands for the CD8αα homodimer. This was demonstrated by the observation that histocompatibility 2, Q region locus 10 (H2-Q10) is a high-affinity ligand for CD8αα which also binds the MHC-Ib molecule H2-TL. This suggests that MHC-Ib proteins may be an extended source of CD8αα ligands. Expression of H2-T3/TL and H2-Q10 is restricted to the small intestine and liver, respectively, yet CD8αα-containing lymphocytes are present more broadly. Therefore, here we sought to determine whether murine CD8αα binds only to tissue-specific MHC-Ib molecules or also to ubiquitously expressed MHC-Ib molecules. Using recombinant proteins and surface plasmon resonance-based binding assays, we show that the MHC-Ib family furnishes multiple binding partners for murine CD8αα, including H2-T22 and the CD94/NKG2-A/B-activating NK receptor (NKG2) ligand Qa-1b We also demonstrate a hierarchy among MHC-Ib proteins with respect to CD8αα binding, in which Qa-1b > H2-Q10 > TL. Finally, we provide evidence that Qa-1b is a functional ligand for CD8αα, distinguishing it from its human homologue MHC class I antigen E (HLA-E). These findings provide additional clues as to how CD8αα-expressing cells are controlled in different tissues. They also highlight an unexpected immunological divergence of Qa-1b/HLA-E function, indicating the need for more robust studies of murine MHC-Ib proteins as models for human disease.

Keywords: CD8aa; MHC class I antigen E (HLA-E); MHC-Ib; Qa-1b; T cell; T-cell biology; TL; cell biology; cell surface glycoprotein; innate immunity; lymphocyte; major histocompatibility complex (MHC).


Conflict of interest statement

The authors declare that they have no conflicts of interest with the contents of this article

Figures

Figure 1.
Figure 1.
MHC-Ib are an extended family of ligands for CD8αα. Staining of RMA-s–CD8 αα cells with class Ia and MHC-Ib tetramers demonstrates selectivity of class I MHC binding. a, staining of CD8α on RMA-s–CD8αα cells. The open histogram is the unstained control whereas the light-shaded histogram is CD8 staining on RMA-s parental cells. The filled histogram is CD8 staining on RMA-s–CD8αα cells. Results are representative of at least three independent experiments. All histograms have been offset to stack vertically above one another and scaled to maximum count for clarity. b, staining of RMA-s–CD8αα cells with class Ia and MHC-Ib tetramers demonstrates that H2-T22, TL, H2-Q10, and Qa-1b bind CD8αα. The open histograms are unstained controls, the gray histograms are the indicated tetramers on RMA-s cells and the filled histograms are tetramer staining on RMA-s–CD8αα cells. Results are representative of at least three independent experiments. All histograms have been offset to stack vertically above one another and scaled to maximum count for clarity. c, median fluorescent intensity (MFI) of H2-T3/TL, H2-Q10 and Qa-1b staining on RMA-s–CD8αα cells. The MFI was pooled from five independent experiments using equivalent tetramer concentrations and identical laser voltages. *, p = 0.0476 and **, p = 0.0079.
Figure 2.
Figure 2.
Qa-1b binds CD8αα with high affinity. a and b, binding of (a) decreasing concentrations of CD8αα (1000, 400, 160, and 64 nm; top to bottom) to neutravidin-immobilized Qa-1b or (b) decreasing concentrations of Qa-1b (5000, 2000, 800, and 320 nm; top to bottom) to CD8αα captured by an antibody to CD8α (53–6.72), which was immobilized by amine-coupling. Results are presented in response units (RU) after subtraction of baseline values. Plots are representative of at least two independent experiments. Dotted vertical lines at 0s indicate injection start. Irregular lines represent raw data and solid lines indicate data fit using a 1:1 Langmuir binding model. c, pooled kinetic values from independent SPR experiments, showing mean ± S.E.
Figure 3.
Figure 3.
MHC-Ib binds CD8αα on γδT cells with Qa-1b inducing IFN-γ production. a, the pattern of MHC-Ib binding to CD8αα γδT cells is similar to that observed for RMA-s–CD8αα cells. FACS analysis of small intestine identifies a population of CD8αα+/CD94 γδT cells that bind MHC-Ib tetramers. Contour plots show the staining for CD3+/γδTCR+ cells (left panel), their expression of CD8αα and the delineation of CD8αα+/CD94 and CD8αα+/CD94+ subsets. The arrows show the pattern of electronic gating. Staining of TCRγδ+/CD8αα+/CD94 cells with TL, H2-Q10, and Qa-1b demonstrates increased binding of Qa-1b when compared with H2-Q10 and TL. The open histogram is unstained, the filled histogram is TL, the dark-shaded histogram is H2–10 and the light-shaded histogram is Qa-1b. Numbers in the histogram are the median fluorescent intensity. Results are representative of at least four independent experiments. All histograms have been offset to stack vertically above one another and scaled to maximum count for clarity. b, Qa-1b promotes CD8αα γδT cell activation. TCRγδ+/CD8αα+/CD94 cells were sorted from the small intestine and cultured in the presence of crosslinked HLA-E monomers (open bars) or Qa-1b monomers (filled bars). TCRγδ+/CD8αα/CD94 cells sorted from the small intestine were cultured in the presence of crosslinked Qa-1b monomers (gray bars). At 6 and 18 h post stimulation, the supernatants were harvested and cytokine production assessed using a CBA. The data are pooled from two independent experiments performed in triplicate (n = 6). **, p = 0.0022.
Figure 4.
Figure 4.
Qa-1b and HLA-E differ in their ability to bind CD8αα. a, Jurkat cells were engineered to express human CD8αα (hCD8αα). Antibody staining shows a population of Jurkat-CD8αα cells with high expression of the CD8α homodimer (left panel). The filled histogram is the unstained control whereas the open histogram is CD8 staining on Jurkat cells. The shaded histogram is CD8 staining on Jurkat-CD8αα cells. Results are representative of at least two independent experiments. All histograms have been offset to stack vertically above one another and scaled to maximum count for clarity. Tetramer staining shows that HLA-E and Qa-1b (second and third panels) have minimal binding to human CD8αα whereas HLA-G (right panel) interacts with human CD8αα. The filled histograms are the unstained controls whereas the open histograms are tetramer staining on Jurkat cells. The shaded histograms are tetramer staining on Jurkat-CD8αα cells. Results are representative of at least two independent experiments. All histograms have been offset to stack vertically above one another and scaled to maximum count for clarity. b, HLA-E and HLA-G show minimal interaction with mouse CD8αα (mCD8αα). Antibody staining of RMA-s-mCD8αα cells (left panel). The filled histogram is the unstained control whereas the open histogram is CD8 staining on RMA-s cells. The shaded histogram is CD8 staining on RMA-s–mCD8αα cells. Results are representative of at least two independent experiments. All histograms have been offset to stack vertically above one another and scaled to maximum count for clarity. Tetramer staining shows that HLA-E (middle panel) and HLA-G (right panel) do not bind mouse CD8αα. The filled histograms are the unstained controls whereas the open histograms are tetramer staining on RMA-s cells. The shaded histograms are tetramer staining on RMA-s–mCD8αα cells. Results are representative of at least three independent experiments. All histograms have been offset to stack vertically above one another and scaled to maximum count for clarity.

References

    1. DiSanto J. P., Knowles R. W., and Flomenberg N. (1988) The human Lyt-3 molecule requires CD8 for cell surface expression. EMBO J. 7, 3465–3470 10.1002/j.1460-2075.1988.tb03221.x - DOI - PMC - PubMed
    1. Norment A. M., and Littman D. R. (1988) A second subunit of CD8 is expressed in human T cells. EMBO J. 7, 3433–3439 10.1002/j.1460-2075.1988.tb03217.x - DOI - PMC - PubMed
    1. Cheroutre H., and Lambolez F. (2008) Doubting the TCR coreceptor function of CD8αα. Immunity 28, 149–159 10.1016/j.immuni.2008.01.005 - DOI - PubMed
    1. Torres-Nagel N., Kraus E., Brown M. H., Tiefenthaler G., Mitnacht R., Williams A. F., and Hünig T. (1992) Differential thymus dependence of rat CD8 isoform expression. Eur. J. Immunol. 22, 2841–2848 10.1002/eji.1830221113 - DOI - PubMed
    1. Guy-Grand D., Cerf-Bensussan N., Malissen B., Malassis-Seris M., Briottet C., and Vassalli P. (1991) Two gut intraepithelial CD8+ lymphocyte populations with different T cell receptors: A role for the gut epithelium in T cell differentiation. J. Exp. Med. 173, 471–481 10.1084/jem.173.2.471 - DOI - PMC - PubMed

Publication types

MeSH terms