. 2020 Jan 28;11(1):548.
doi: 10.1038/s41467-019-14071-8.

Formation of bridgmanite-enriched layer at the top lower-mantle during magma ocean solidification

Affiliations

Formation of bridgmanite-enriched layer at the top lower-mantle during magma ocean solidification

Longjian Xie et al. Nat Commun. .

Abstract

Thermochemical heterogeneities detected today in the Earth's mantle could arise from ongoing partial melting in different mantle regions. A major open question, however, is the level of chemical stratification inherited from an early magma-ocean (MO) solidification. Here we show that the MO crystallized homogeneously in the deep mantle, but with chemical fractionation at depths around 1000 km and in the upper mantle. Our arguments are based on accurate measurements of the viscosity of melts with forsterite, enstatite and diopside compositions up to ~30 GPa and more than 3000 K at synchrotron X-ray facilities. Fractional solidification would induce the formation of a bridgmanite-enriched layer at ~1000 km depth. This layer may have resisted to mantle mixing by convection and cause the reported viscosity peak and anomalous dynamic impedance. On the other hand, fractional solidification in the upper mantle would have favored the formation of the first crust.


Conflict of interest statement

The authors declare no competing interests.

Figures

Fig. 1
Fig. 1. Experimental observation of the falling sphere.
a Sequential radiographic images recorded at ~24 GPa and ~2873 K during the fall of a Re-sphere of ~65 μm diameter (Run MA24). b Position of the sphere as a function of time in Run MA24. The sphere position was fitted by a Gaussian function in each X-ray radiographic image (blue symbol). The melt viscosity can be calculated from the terminal velocity (red dashed line) using Eq. (4). c Velocity/time plot of the sphere in Run MA24, using a sampling time of 10 ms. The red dashed line is a best fit through the data points located on the "velocity plateau" corresponding to the terminal velocity.
Fig. 2
Fig. 2. Viscosities of silicate melts under pressure.
ac Fo, En, and Di composition, respectively. We report our experimental data as red crosses, whose temperatures are shown in Supplementary Fig. 2 and Supplementary Table. 1. Dashed black lines are viscosities along liquidus. Colored lines are viscosities recalculated along isotherms with their 1σ standard deviation.
Fig. 3
Fig. 3. Change of magma ocean viscosity with depth.
a, b We report MO viscosities with KLB-1 (left) and chondrite-type (right) compositions for potential surface temperatures from 2000 to 3000 K. Solid and dashed lines are calculated along mantle adiabats and liquidus profiles, respectively. c, d Solid and dashed lines represent adiabatic and liquidus, profiles, respectively, for molten KLB-1 and chondrite-type mantle compositions.
Fig. 4
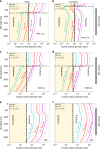
Fig. 4. Crystal/critical diameter ratio as a function of magma ocean depth.
Rcc parameter calculated for KLB-1 MO (a, c, e) and chondritic-type MO (b, d, f) using bridgmanite as solid phase and a solid-melt Fe partition coefficient of 0.6. We considered MO viscosities of 10 (green), 1 (red), and 0.1 (blue) times the MO viscosity determined in this study. Solid or dotted profiles correspond to no blanketing atmosphere (Cf = 1) or an atmosphere reducing the effective surface temperature by 20% (Cf = 0.8, see Eq. (16)), respectively. Zones colored in yellow (Rcc lower than 1) or white (Rcc higher than 1) indicate MO expected to solidify at chemical equilibrium or through fractional solidification with sedimentation of bridgmanite, respectively. The horizontal black dashed-dotted line marks the MO-bottom depth when crystallization starts at the surface of the MO. Upper, middle and lower frames consider a crystallization zone that extends from the MO bottom to (a, b) the intersection of adiabatic and liquidus profiles (Adia.-Liq.; see situation (3) in the main text), (c, d) 1000 km above MO bottom, (e, f) MO surface, respectively.

References

    1. Carlson RW, et al. How did early earth become our modern world? Annu. Rev. Earth Planet. Sci. 2014;42:151–178. doi: 10.1146/annurev-earth-060313-055016. - DOI
    1. Labrosse S, Hernlund JW, Coltice N. A crystallizing dense magma ocean at the base of the Earth's mantle. Nature. 2007;450:866–869. doi: 10.1038/nature06355. - DOI - PubMed
    1. Williams CD, Mukhopadhyay S. Capture of nebular gases during Earth’s accretion is preserved in deep-mantle neon. Nature. 2019;565:78. doi: 10.1038/s41586-018-0771-1. - DOI - PubMed
    1. Touboul M, Puchtel IS, Walker RJ. W-182 evidence for long-term preservation of early mantle differentiation products. Science. 2012;335:1065–1069. doi: 10.1126/science.1216351. - DOI - PubMed
    1. Solomatov VS. Fractional versus equilibrium crystallization. Magma oceans and primordial mantle differentiation. Treatise Geophys. 2007;9:91–120. doi: 10.1016/B978-044452748-6/00141-3. - DOI