. 2020 Jan 28;11(1):566.
doi: 10.1038/s41467-019-14179-x.

Studying biomolecular folding and binding using temperature-jump mass spectrometry

Affiliations

Studying biomolecular folding and binding using temperature-jump mass spectrometry

Adrien Marchand et al. Nat Commun. .

Abstract

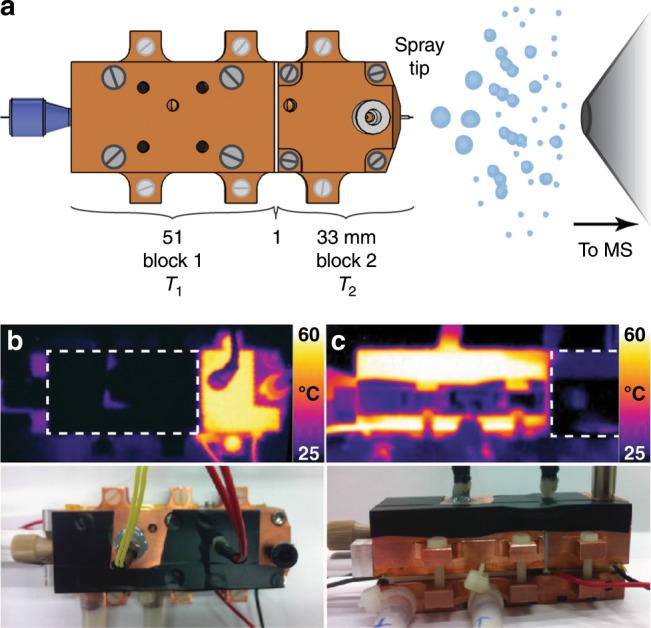
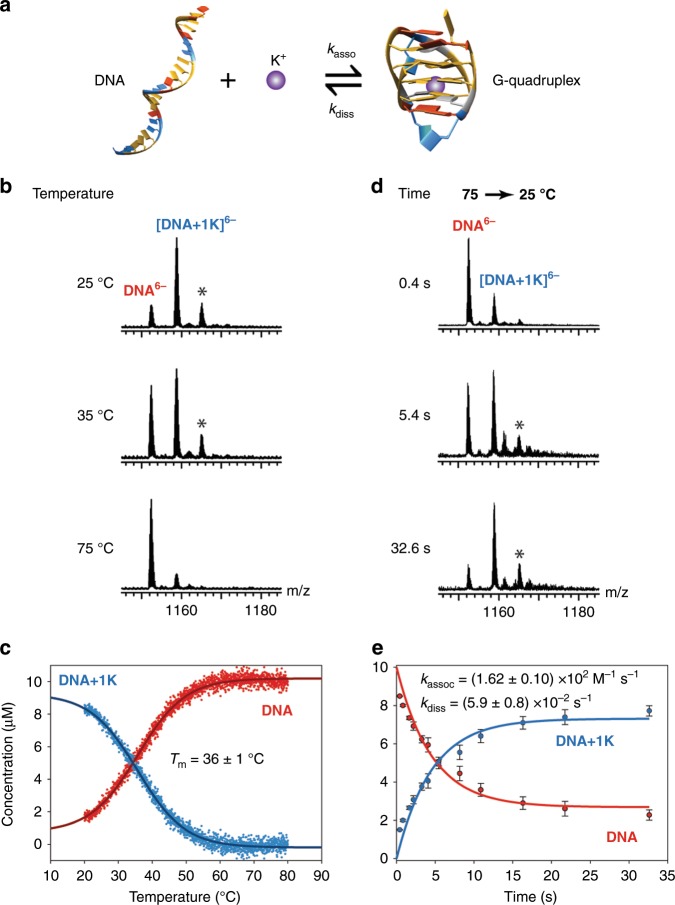
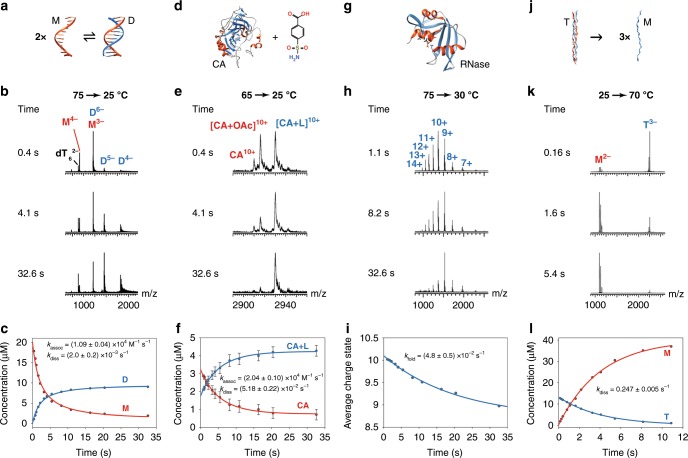
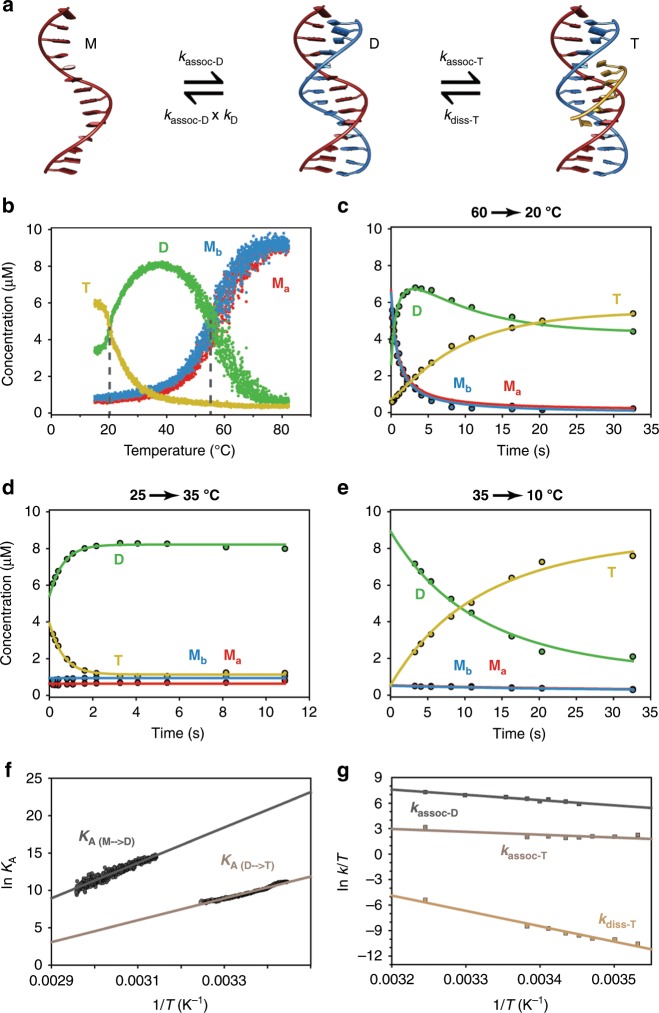
Characterizing folding and complex formation of biomolecules provides a view into their thermodynamics, kinetics and folding pathways. Deciphering kinetic intermediates is particularly important because they can often be targeted by drugs. The key advantage of native mass spectrometry over conventional methods that monitor a single observable is its ability to identify and quantify coexisting species. Here, we show the design of a temperature-jump electrospray source for mass spectrometry that allows one to perform fast kinetics experiments (0.16-32 s) at different temperatures (10-90 °C). The setup allows recording of both folding and unfolding kinetics by using temperature jumps from high to low, and low to high, temperatures. Six biological systems, ranging from peptides to proteins to DNA complexes, exemplify the use of this device. Using temperature-dependent experiments, the folding and unfolding of a DNA triplex are studied, providing detailed information on its thermodynamics and kinetics.


Conflict of interest statement

The authors declare no competing interests.

Figures

Fig. 1
Fig. 1. Experimental setup.
a Schematic representation of the temperature-jump electrospray source. b, c Infrared pictures of the source with blocks 1 and 2 maintained at 60 and 25 °C and the reverse. The bottom pictures show the source in similar positions. To obtain the IR pictures, black tape was placed on the source in order to enhance blackbody emission and to reduce the reflection of light coming from other sources.
Fig. 2
Fig. 2. Kinetics of G-quadruplex formation.
a Representation of the chemical equilibrium of binding of K+ to the DNA sequence 22CTA (d(A(GGGCTA)3GGG), PDB ID: 2KM3). b, c Thermal denaturation of 22CTA–K+, monitored by MS (10 µM DNA in 100 mM TMAA and 1 mM KCl). d, e Kinetics recorded using the T-jump ESI source (jump from 75 to 25 °C). The mass spectra are magnified views of the 6- charge state. The peaks labeled with a star correspond to a nonspecifically bound K+ ion. c, e Quantification of the species taking into account nonspecific adducts as described previously,. The 5- and 6- charge states were averaged. The vertical error bars in e are the standard deviation obtained from the quantification on different charge states (5- and 6-, n = 2). The reproducibility of the experiment is discussed in the Discussion section. The errors on the rate constants are the standard deviations from the fitting. Source data are provided as a Source Data file.
Fig. 3
Fig. 3. Kinetics recorded using the temperature-jump source for exemplary biological systems.
a–c the formation of a self-complementary DNA duplex (20  µM d(CGT AAA TTT ACG) in 100 mM TMAA). M and D denote the mononer and duplex, respectively; d–f the binding of a ligand to a protein (5 µM Carbonic Anhydrase II (PDB ID: 1CA2) with 5 µM 4-carboxybenzene sulfonamide in 10 mM NH4OAc). CA and L denote Carbonic Anhydrase II and ligand, respectively; gi the folding of a protein (10 µM Ribonuclease A (PDB ID: 5RSA) in 100 mM NH4OAc at pH 2.75). RNase denotes Ribonuclease A; jl the dissociation of a collagen peptide triple helix into monomers (40 µM [POG]8 collagen peptide (PDB ID: 1CGD) in 10 mM NH4OAc). M and T denote monomer and trimer, respectively. The vertical error bars in f are the standard deviation obtained from the quantification on different charge states (12+, 11+, 10+, and 9+, n = 4). The reproducibility of the experiment is discussed in the Discussion section. The errors on the rate constants are the standard deviations from the fitting. Source data are provided as a Source Data file.
Fig. 4
Fig. 4. Thermal denaturation and kinetics of folding and unfolding of a DNA triplex.
a Representation of the chemical equilibrium of formation of a DNA triplex. b Thermal denaturation experiment of a DNA triplex monitored by native MS (10 µM Ma, 10 µM Mb, and 30 µM Mc in 100 mM TMAA at pH 5.5). c–e Kinetics of triplex formation monitored using T-jump ESI-MS, using jumps from from 60 to 20 °C, 25–35 °C, and 35–10 °C, as indicated. For the kinetics, a model corresponding to the chemical equations displayed in a was fitted to the data to obtain the rate constants. f Van’t Hoff plots for the formation of the duplex and the triplex. The intercept is proportional to ∆S0 and the slope to ∆H0. g Eyring plot for the formation of the duplex and the formation and dissociation of the triplex. The intercept is proportional to ∆S and the slope to ∆H.
Fig. 5
Fig. 5. Energy surfaces obtained from the combined equilibria and kinetics experiments.
The experiments were monitored using mass spectrometry for the formation of the DNA duplex and triplex in 100 mM TMAA at pH 5.5: a Gibbs free energies, ∆G at 298 K, b Enthalpies, ∆H, and c Entropies, – T.S at 298 K. The y-axis corresponds to the calculated energies and the x-axis to the reaction coordinate. The values are reported in kcal/mol. The errors are the standard deviation obtained from the Van’t Hoff or Eyring analyses of Fig. 4.
Fig. 6
Fig. 6. kassoc and kdiss for bimolecular interactions compatible with the temperature-jump source.
The compatible area, represented in green, was plotted based on three strict criteria: (1) the time needed to fold/unfold half the complexes is longer than 0.16 s (t1/2 > 160 ms); (2) the plateau is reached in the time scale of the experiment (32 s); and (3) the concentration of the folded species changes by at least 20% of the total concentration. In dark green, the kinetics can be recorded directly at 10 µM in both target and ligand. Light green: the concentrations of the ligand and/or the target have to be adjusted to be able to access kinetics (concentrations decreased to 1 µM in both ligand and target if the reaction is too fast and concentration of the ligand increased to 100 µM or more if the reaction is too slow). Blue: the kinetics are too fast for the source and only the equilibrium constant is accessible with good confidence using mass spectrometry. Red: combinations that are not compatible with the current setup. Note that on the scheme the zones are defined with hard borders; however, in practice, the compatible zone is not so strictly defined. The black dots correspond to the values determined for the multimolecular biological systems reported in this manuscript. Since the fittings for the unfolding of the collagen model peptides were performed only considering the unfolding reactions, the dots were placed on the x-axis.

References

    1. Dobson CM. Protein folding and misfolding. Nature. 2003;426:884–890. doi: 10.1038/nature02261. - DOI - PubMed
    1. Brooks CL., III Statistical thermodynamics: taking a walk on a landscape. Science. 2001;293:612–613. doi: 10.1126/science.1062559. - DOI - PubMed
    1. Anfinsen CB. Principles that govern the folding of protein chains. Science. 1973;181:223–230. doi: 10.1126/science.181.4096.223. - DOI - PubMed
    1. Brooks CL, Gruebele M, Onuchic JN, Wolynes PG. Chemical physics of protein folding. Proc. Natl Acad. Sci. USA. 1998;95:11037–11038. doi: 10.1073/pnas.95.19.11037. - DOI - PMC - PubMed
    1. Neupane K, et al. Direct observation of transition paths during the folding of proteins and nucleic acids. Science. 2016;352:239–242. doi: 10.1126/science.aad0637. - DOI - PubMed