. 2020 Jan 28;11(1):559.
doi: 10.1038/s41467-020-14325-w.

Tunable anomalous Hall conductivity through volume-wise magnetic competition in a topological kagome magnet

Affiliations

Tunable anomalous Hall conductivity through volume-wise magnetic competition in a topological kagome magnet

Z Guguchia et al. Nat Commun. .

Abstract

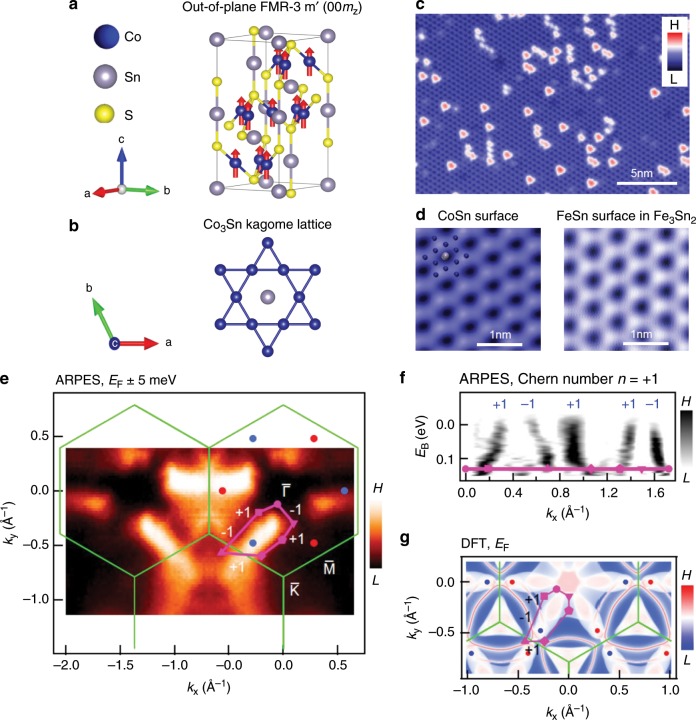
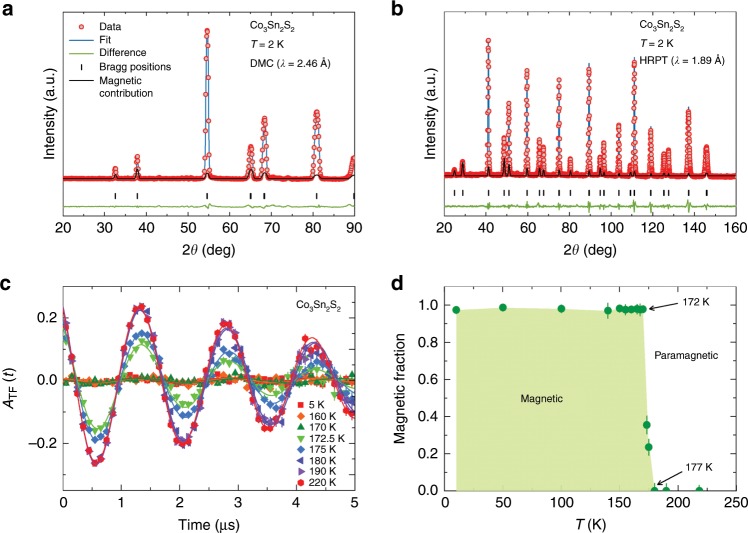
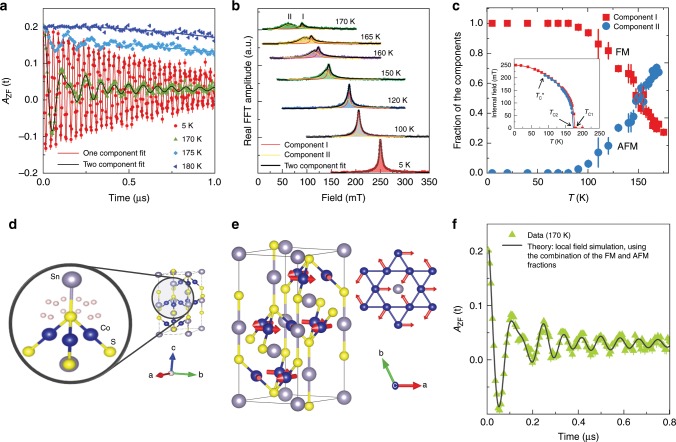
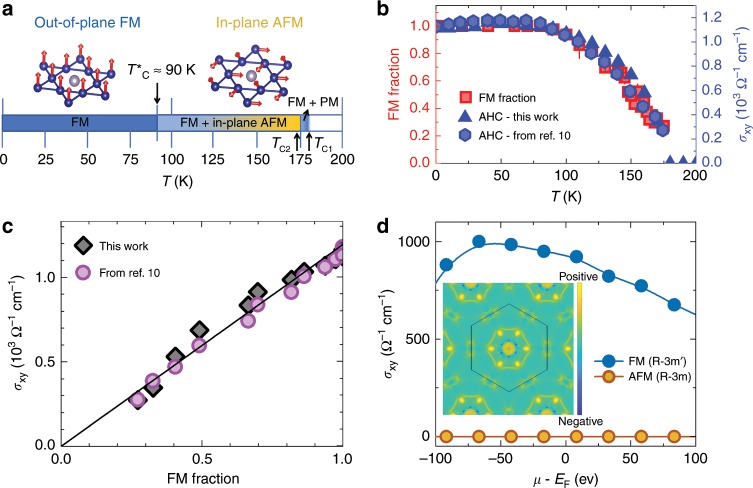
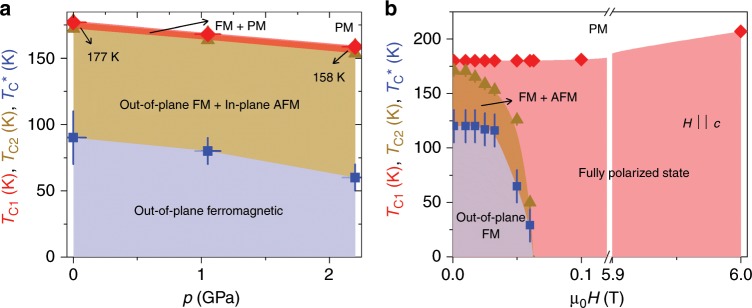
Magnetic topological phases of quantum matter are an emerging frontier in physics and material science. Along these lines, several kagome magnets have appeared as the most promising platforms. Here, we explore magnetic correlations in the kagome magnet Co3Sn2S2. Using muon spin-rotation, we present evidence for competing magnetic orders in the kagome lattice of this compound. Our results show that while the sample exhibits an out-of-plane ferromagnetic ground state, an in-plane antiferromagnetic state appears at temperatures above 90 K, eventually attaining a volume fraction of 80% around 170 K, before reaching a non-magnetic state. Strikingly, the reduction of the anomalous Hall conductivity (AHC) above 90 K linearly follows the disappearance of the volume fraction of the ferromagnetic state. We further show that the competition of these magnetic phases is tunable through applying either an external magnetic field or hydrostatic pressure. Our results taken together suggest the thermal and quantum tuning of Berry curvature induced AHC via external tuning of magnetic order.


Conflict of interest statement

The authors declare no competing interests.

Figures

Fig. 1
Fig. 1. Topological ground state of the kagome system Co3Sn2S2.
a Magnetic structure of Co3Sn2S2, showing a ferromagnetic ground state with spins on Co atoms aligned along the c-axis. b Kagome lattice structure of the Co3Sn layer. c Topographic image of the CoSn surface. d A zoom-in image of the CoSn surface (left) that shows similar morphology with the FeSn surface (right) in Fe3Sn2. The inset illustrates the possible atomic assignment of the kagome lattice. Data are taken at the tunnelling junction: V = 50 mV, I = 0.8 nA, T = 4.2 K. e Fermi surface of Co3Sn2S2 acquired using angle-resolved photoemission spectroscopy (ARPES) at temperature T = 22 K with surface Brillouin zone (green lines) determined from the crystal structure; predicted topological band crossing points (positive Chern number: blue dots, negative Chern number: red dots) from first-principles calculation; and a closed surface momentum-space loop (purple quadrilateral). f Energy-momentum cut along the purple loop, indicating an unconventional odd number of band crossings. g Calculated (momentum-resolved) surface density of states at EF for Co3Sn2S2.
Fig. 2
Fig. 2. Ferromagnetic ground state and the ordered fraction versus temperature in Co3Sn2S2.
a, b Neutron powder diffraction pattern, recorded at 2 K for the sample Co3Sn2S2 with two different instruments. The solid black lines represent a Rietveld refinement profile. The residuals are plotted at the bottom of the figure. The solid green lines are the fitted magnetic contributions. To better visualise the magnetic peaks, the intensities are multiplied by 500 and 300 for (a) and (b), respectively. c The weak-TF μSR spectra, obtained above and below Curie temperature TC. d The temperature dependence of the magnetically ordered volume fraction, extracted from the amplitude of the TF μSR spectra. The error bars represent the s.d. of the fit parameters.
Fig. 3
Fig. 3. Phase separation between two distinct magnetically ordered regions in Co3Sn2S2.
a Zero-field spectra, recorded at temperatures above and below TC. The solid lines are the fit of the data using Eq. (2). Error bars are the s.e.m. in about 106 events. The error of each bin count n is given by the s.d. of n. The errors of each bin in A(t) are then calculated by s.e. propagation. b Fourier transform amplitudes of the oscillating components of the μSR time spectra as a function of temperature. c The temperature dependences of the relative volume fractions of the two magnetically ordered regions. Inset shows the temperature dependences of the internal magnetic fields for the two components. Arrows mark the critical temperatures TC1 and TC2 for high frequency and low-frequency components, respectively as well as the transition temperature TC*, below which only one component signal is observed. The error bars represent the s.d. of the fit parameters. d Crystallographically equivalent muon stopping sites with the Wyckoff position 36i within the structure of CoSn2S2. e In-plane antiferromagnetic structure. Grey solid lines indicate the boundaries of a single unit cell of the crystal structure. f μSR spectrum, recorded at 170 K, is shown along with the result of the local field simulation (black solid line) at the muon stopping site, considering two distinct magnetically ordered regions with out-of-plane and in-plane magnetic configurations, respectively.
Fig. 4
Fig. 4. Magnetic competition driven thermal evolution of anomalous Hall conductivity.
a Schematic magnetic phase diagram as a function of temperature and spin structures of Co3Sn2S2, i.e. the FM and the in-plane AFM structures. The arrows mark the transition temperatures TC1 ≃ 177 K, TC2 ≃ 172 K and TC* ≃ 90 K. b The temperature dependence of the FM volume fraction and the in-plane anomalous Hall conductivity σxy. The error bars of the FM fraction represent the s.d. of the fit parameters. c The correlation plot of σxy vs fraction of the ferromagnetically ordered region. The solid straight line is drawn between a hypothetical situation of the minimum (zero) and the maximum values of σxy and the FM fraction. Data shown in solid circles are taken from ref. . d The dependence of σxy on the chemical potential, calculated for the out-of-plane FM and the in-plane AFM structures. The inset shows the calculated Berry curvature distribution in the BZ at the Ferromagnetic phase.
Fig. 5
Fig. 5. Magnetic field and hydrostatic pressure tuning of the magnetic competition in Co3Sn2S2.
a Temperature–pressure phase diagram for Co3Sn2S2 obtained by microscopic μSR technique. (b) Temperature–field phase diagram for Co3Sn2S2, obtained from the macroscopic magnetisation measurements. The error bars represent the s.d. of the fit parameters.

References

    1. Yin J-X, et al. Negative flatband magnetism in a spin-orbit coupled kagome magnet. Nat. Phys. 2019;15:443–448. doi: 10.1038/s41567-019-0426-7. - DOI
    1. Yin J-X, et al. Giant and anisotropic spin-orbit tunability in a strongly correlated kagome magnet. Nature. 2018;562:91–95. doi: 10.1038/s41586-018-0502-7. - DOI - PubMed
    1. Ye L, et al. Massive Dirac fermions in a ferromagnetic kagome metal. Nature. 2018;555:638–642. doi: 10.1038/nature25987. - DOI - PubMed
    1. Han T-H, et al. Fractionalized excitations in the spin-liquid state of a kagome-lattice antiferromagnet. Nature. 2012;492:406–410. doi: 10.1038/nature11659. - DOI - PubMed
    1. Yan S, Huse DA, White SR. Spin-liquid ground state of the S=1/2 kagome Heisenberg antiferromagnet. Science. 2011;332:1173–1176. doi: 10.1126/science.1201080. - DOI - PubMed