Randomized Controlled Trial
. 2020 Jan 28;10(1):1374.
doi: 10.1038/s41598-019-57373-z.

Maternal preconception lipid profile and gestational lipid changes in relation to birthweight outcomes

Affiliations
Randomized Controlled Trial

Maternal preconception lipid profile and gestational lipid changes in relation to birthweight outcomes

Alaina M Bever et al. Sci Rep. .

Abstract

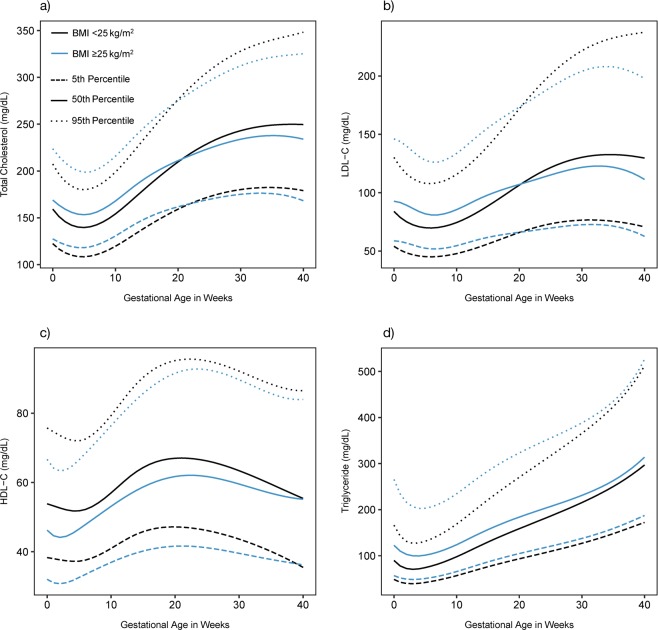
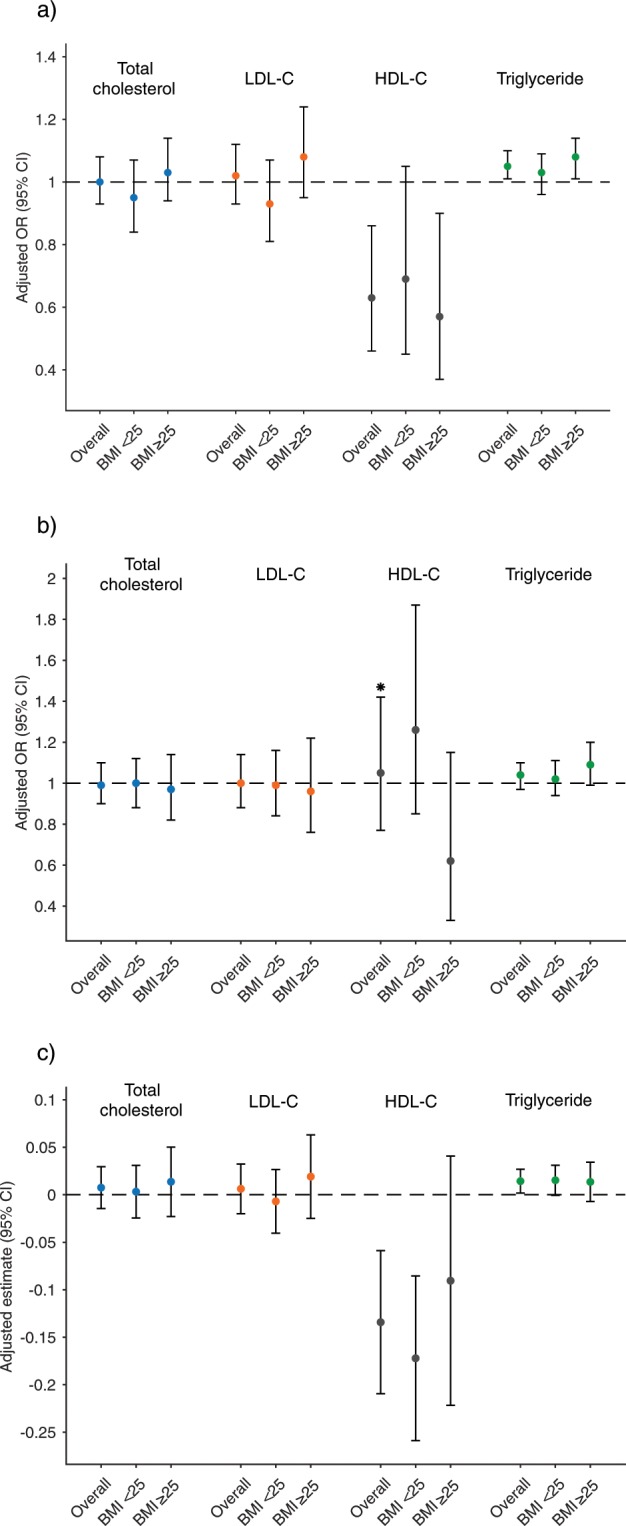
In 575 women with 1-2 prior pregnancy losses; total cholesterol, low-density lipoprotein cholesterol (LDL-C), high-density lipoprotein cholesterol (HDL-C), and triglycerides (TG) were evaluated preconception and throughout pregnancy to evaluate whether previously observed associations between third trimester maternal lipid profile and birthweight outcomes are driven by preconception lipids or lipid changes during pregnancy. Lipid trajectories were compared by pre-pregnancy body mass index (BMI) <25 or ≥25 kg/m2; logistic regression models evaluated preconception lipid concentration and change from preconception to 28 weeks with adjusted odds of large- or small-for-gestational age (LGA or SGA) neonate by BMI group. Preconception lipid concentrations and gestational lipid trajectories varied by BMI group (P < 0.001). Preconception lipids were not associated with LGA or SGA in either group. A 10 mg/dL increase in HDL-C change from preconception to 28 weeks was associated with decreased odds of LGA (odds ratio (OR) = 0.63, 95% confidence interval (CI): 0.46, 0.86) and 10 mg/dL increase in TG change associated with increased odds of LGA (OR = 1.05, 95% CI: 1.01, 1.1) overall. For ≥25 BMI only, 10 mg/dL increase in HDL-C change was associated with decreased SGA odds (OR = 0.35, 95% CI: 0.19, 0.64). Gestational lipid trajectories differed by BMI group and were differentially associated with birthweight outcomes, with HDL-C more strongly associated with healthy birthweight in women with BMI ≥25.


Conflict of interest statement

Dr. Silver reports grants from the NIH during the conduct of the study. All other authors have no conflicts of interest to disclose.

Figures

Figure 1
Figure 1
Trajectories of maternal lipid concentration (mg/dL) from preconception through 40 weeks gestation, by two preconception BMI groups in the EAGeR population. Estimated mean lipid concentration by preconception BMI group (<25 or ≥25 kg/m2), as estimated from linear mixed models with log-transformed outcomes and cubic splines. Limited to n = 575 women with birthweight outcomes. (a) Total cholesterol, (b) HDL-C, (c) LDL-C, (d) Triglyceride. BMI, body mass index; LDL-C, low-density lipoprotein cholesterol; HDL-C, high-density lipoprotein cholesterol.
Figure 2
Figure 2
Birthweight outcomes by preconception lipid concentration and preconception BMI group. Data are interpreted as odds of large-for-gestational age (LGA) or small-for-gestational age (SGA) neonate or estimated change in birthweight z-score per 10 mg/dL increase in preconception lipid concentration (mg/dL). (a) Large-for-gestational age, (b) Small-for-gestational age, (c) Birthweight z-score. BMI, body mass index; LDL-C, low-density lipoprotein cholesterol; HDL-C, high-density lipoprotein cholesterol. *Indicates a significant effect modification (P < 0.20) by preconception BMI group (<25 kg/m2 v. ≥25 kg/m2). All models adjusted for: maternal age, race, education level, preconception smoking and alcohol habits, preconception BMI, total cholesterol (excluding total cholesterol models), and fasting status at preconception serum collection.
Figure 3
Figure 3
Spline regression between preconception lipid concentration (mg/dL) and birthweight z-score by preconception BMI group (<25 or ≥25 kg/m2). (a) LDL-C, BMI <25; (b) LDL-C, BMI ≥25; (c) HDL-C, BMI <25; (d) HDL-C, BMI ≥25. BMI, body mass index; LDL-C, low-density lipoprotein cholesterol; HDL-C, high-density lipoprotein cholesterol.
Figure 4
Figure 4
Birthweight outcomes by change in lipid concentration from preconception to 28 weeks gestation and preconception BMI group. Data are interpreted as odds of large-for-gestational age (LGA) or small-for-gestational age (SGA) neonate or estimated change in birthweight z-score per 10 mg/dL increase in lipid concentration (mg/dL) change. (a) Large-for-gestational age, (b) Small-for-gestational age, (c) Birthweight z-score. BMI, body mass index; LDL-C, low-density lipoprotein cholesterol; HDL-C, high-density lipoprotein cholesterol. *Indicates a significant effect modification (P < 0.20) by preconception BMI group (<25 kg/m2 v. ≥25 kg/m2). All models adjusted for: maternal age, race, education level, preconception smoking and alcohol habits, preconception BMI, average total cholesterol of preconception and 28-week visit (excluding total cholesterol models), and fasting status at preconception serum collection.

References

    1. Fuchs F, Bouyer J, Rozenberg P, Senat MV. Adverse maternal outcomes associated with fetal macrosomia: what are the risk factors beyond birthweight? BMC Pregnancy Childbirth. 2013;13:90. doi: 10.1186/1471-2393-13-90. - DOI - PMC - PubMed
    1. Stones RW, Paterson CM, Saunders NJ. Risk factors for major obstetric haemorrhage. Eur J Obstet Gynecol Reprod Biol. 1993;48:15–18. doi: 10.1016/0028-2243(93)90047-G. - DOI - PubMed
    1. Hei Mingyan, Lee Shoo, Shah Prakesh, Jain Amish. Outcomes for Symmetrical and Asymmetrical Small for Gestational Age Preterm Infants in Canadian Tertiary NICUs. American Journal of Perinatology. 2014;32(08):725–732. doi: 10.1055/s-0034-1395479. - DOI - PubMed
    1. Agarwal V, et al. Association of Lipid Profile and Uric Acid with Pre-eclampsia of Third Trimester in Nullipara Women. J Clin Diagn Res. 2014;8:CC04–07. doi: 10.7860/JCDR/2014/7901.4533. - DOI - PMC - PubMed
    1. Berntorp K, Anderberg E, Claesson R, Ignell C, Kallen K. The relative importance of maternal body mass index and glucose levels for prediction of large-for-gestational-age births. BMC Pregnancy Childbirth. 2015;15:280. doi: 10.1186/s12884-015-0722-x. - DOI - PMC - PubMed

Publication types