. 2020 Jan 28;10(1):1300.
doi: 10.1038/s41598-020-57971-2.

Jedi-1 deficiency increases sensory neuron excitability through a non-cell autonomous mechanism

Affiliations

Jedi-1 deficiency increases sensory neuron excitability through a non-cell autonomous mechanism

Alexandra J Trevisan et al. Sci Rep. .

Abstract

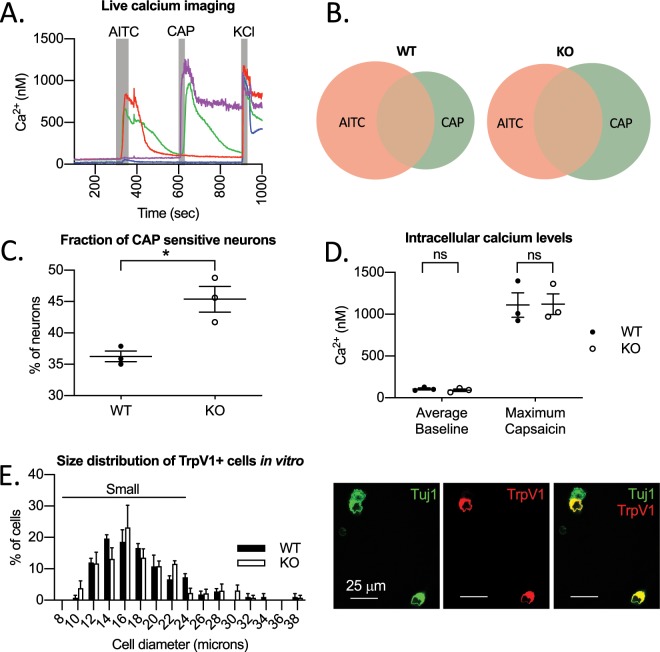
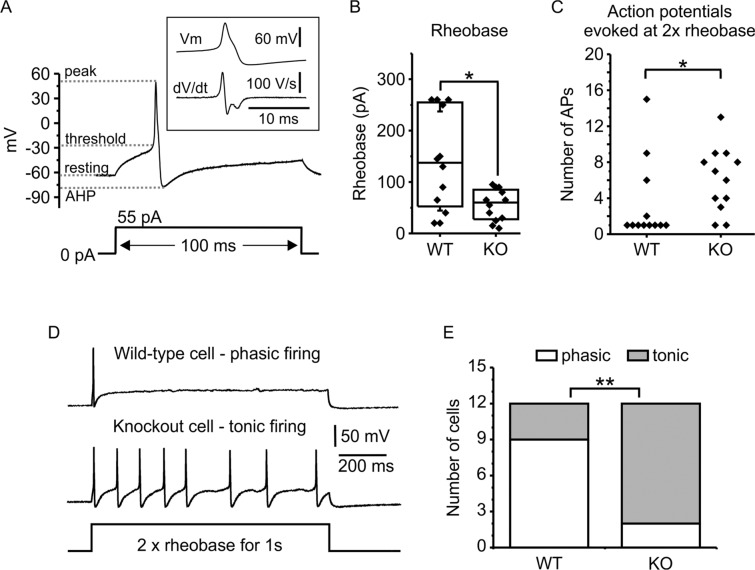
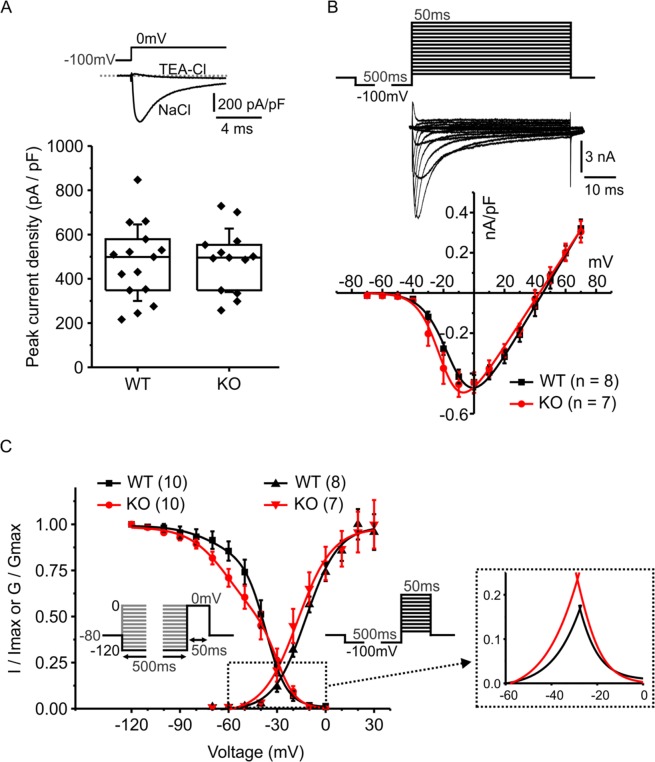
The dorsal root ganglia (DRG) house the primary afferent neurons responsible for somatosensation, including pain. We previously identified Jedi-1 (PEAR1/MEGF12) as a phagocytic receptor expressed by satellite glia in the DRG involved in clearing apoptotic neurons during development. Here, we further investigated the function of this receptor in vivo using Jedi-1 null mice. In addition to satellite glia, we found Jedi-1 expression in perineurial glia and endothelial cells, but not in sensory neurons. We did not detect any morphological or functional changes in the glial cells or vasculature of Jedi-1 knockout mice. Surprisingly, we did observe changes in DRG neuron activity. In neurons from Jedi-1 knockout (KO) mice, there was an increase in the fraction of capsaicin-sensitive cells relative to wild type (WT) controls. Patch-clamp electrophysiology revealed an increase in excitability, with a shift from phasic to tonic action potential firing patterns in KO neurons. We also found alterations in the properties of voltage-gated sodium channel currents in Jedi-1 null neurons. These results provide new insight into the expression pattern of Jedi-1 in the peripheral nervous system and indicate that loss of Jedi-1 alters DRG neuron activity indirectly through an intercellular interaction between non-neuronal cells and sensory neurons.


Conflict of interest statement

The authors declare no competing interests.

Figures

Figure 1
Figure 1
Jedi is expressed in peripheral glia and endothelium. (A) Cross section of adult (8–12 weeks old) WT sciatic nerve stained for Jedi-1 (magenta) and DAPI (blue). Insets 1 and 2 show Jedi expression in blood vessels. See Supplementary Fig. S2 for validation of Jedi-1 expression in perineurial glial cells. (B) WT P0 DRG co-stained for Jedi-1 (red), satellite glial marker BFABP (green), and DAPI (blue). (C) WT DRG co-stained for Jedi-1 (red) and PGP9.5 (green) and TOPRO3 (blue). Right shows inset. (D) Right: Primary WT DRG cultures stained for neurons using Tuj1 (green) and Jedi-1 (red). Left: HeLa cells overexpressing mouse Jedi-1 were used as a positive control for Jedi-1 immunocytochemistry in vitro. All images were analyzed in ImageJ version 2.0.0-rc-69/1.52p.
Figure 2
Figure 2
Peripheral glia are not altered in the absence of Jedi-1. (A) TEM images of WT and KO sciatic nerves showing the morphology of the perineurial cell layer, labeled in brackets. (B) Glutamine synthetase (GS, red) and glial fibrillary acidic protein (GFAP, green) immunostaining of spinal cord (positive control) or DRG of P1 mice from WT and KO animals. (C) Ki67 (red) and DAPI (blue) staining in adult WT or KO DRG 8–12 weeks old. Circles (left axis) are Ki67+ SGCs while squares (right axis) are Ki67+ perineurial cells. 16 animals analyzed per genotype with a minimum of 5 sections 60 microns apart analyzed per animal. No statistical difference between genotypes. (D) Quantification of laminin IF pictures such as those shown in Supplementary Fig. S2C. Thickness of the perineurial sheath measured in pixels. n = 3 animals analyzed per genotype with a minimum of 8 sections analyzed per animal at least 60 microns apart. Error bars represent SEM. No statistically significant difference between genotypes. (E) Evan’s blue dye extravasation from brain, DRG, sciatic nerve (SN), and kidney in adult WT and KO mice. Absorbance normalized to weight of tissue. No statistical difference between genotypes. All images were analyzed in ImageJ version 2.0.0-rc-69/1.52p.
Figure 3
Figure 3
DRG neurons develop normally in the absence of Jedi-1. (A) Example pictures of toluidine blue staining of DRG sections from adult (8–12 weeks) WT and KO mice quantified in B and C. (B) Quantification of total DRG neuron counts from serially sectioned thoracic level 13 (T13) DRGs where every 12th section was counted, summed, and total neuron counts were estimated by multiplying by 12. Analysis was performed at two different developmental ages, P0 and adult animals 8–12 weeks old. Error bars indicated SEM. No statistically significant change between genotypes at either time point. (C) Frequency distribution of soma size measured from toluidine blue staining of adult DRGs WT n = 4 animals, KO n = 3 animals with a minimum of 500 cells analyzed per animal. Small DRGs less than 25 microns in diameter are indicated by the top horizontal bar. Error bars indicated SEM. No statistical difference between genotypes in any group using 2-way ANOVA. All images were analyzed in ImageJ version 2.0.0-rc-69/1.52p.
Figure 4
Figure 4
DRG neurons isolated from Jedi-1 KO mice are sensitized to capsaicin. (A) Representative trace of 4 cells used to obtain live cell calcium imaging data. Duration of treatment with allylisothiocyanate (AITC), capsaicin (CAP), and KCl is shown in grey boxes. Blue cell is a healthy neuron that responded to KCl but not AITC or CAP. Red cell responded to AITC and KCl. Purple cell responded to CAP and KCl. CAP responding cells often did not return to baseline. Green cell responded to AITC, CAP, and KCl. (B) Venn diagrams showing the proportions of cells that responded to AITC and CAP. t tests were used to compare overall responses to each drug. There was no statistical difference in AITC responses between genotypes. (C) Fraction of cells that responded to capsaicin over the course of 3 independent experiments with a minimum of 100 cells analyzed in each experiment. Two-tailed t test with Welch’s correction p = 0.03. (D) Intracellular calcium concentration measured by Fura-2AM. 34. Baseline calcium concentration was averaged over the course of 1 minute before any drug treatment. Maximum calcium concentration is the peak calcium concentration during treatment with 500 nM capsaicin for 30 seconds. Each data point represents an independent experiment with a minimum of 100 cells analyzed in each. Students t test was used to compare calcium concentrations between genotypes at baseline and after CAP treatment. (E) Left: Quantification of the size of of TrpV1+ neurons in vitro. n = 4 animals per genotype analyzed. Scale bars represent SEM. 2 way ANOVA used to compare genotypes across all size categories. No statistical differences between genotypes. Right: Representative image of TrpV1 staining in primary DRG cultures showing neurons in Tuj1 (green) and TrpV1 (red). All images were analyzed in ImageJ version 2.0.0-rc-69/1.52p.
Figure 5
Figure 5
DRG neurons cultured from Jedi-1 KO mice are hyperexcitable. Patch clamp electrophysiology was used to record evoked action potentials from small diameter WT and KO DRG neurons. (A) Representative current-clamp recording from a Jedi-1 KO neuron. Stimulation with an excitatory current step (55 pA for 100 ms, lower trace) evoked a typical action potential (upper trace). The upper inset trace shows the action potential on an expanded time scale along with the 1st derivative of the trace. (B) Rheobase (defined as the smallest current step that evoked an action potential) was significantly smaller in Jedi-1 KO cells (*p = 0.03, Mann-Whitney test). Each point is from an individual cell and the box indicates median, 25% and 75% of the distribution. (C) Each point represents the number of action potentials evoked in an individual cell by a 1s current step at twice rheobase (see panel D). Significantly more action potentials were evoked in Jedi-1 KO neurons compared to WT (*p = 0.04, Mann-Whitney test). (D) Representative traces from a WT neuron (upper trace) and Jedi-1 KO neuron (lower trace) stimulated with a 1s current step at twice rheobase. The WT cell displayed phasic firing (a single action potential evoked at the onset of the stimulus) and the KO cell displayed tonic firing (8 action potentials evoked over the duration of the 1s stimulus). (E) The number of cells that displayed either phasic or tonic firing during a 1s stimulus (as in panel D) is shown. The proportion of Jedi-1 KO cells displaying tonic firing was significantly higher than WT (**p = 0.01, Fishers exact test).
Figure 6
Figure 6
Voltage gated sodium channels have altered properties in DRG neurons isolated from Jedi-1 KO mice. Whole cell patch clamp electrophysiology was used to record voltage-gated sodium channel currents from small diameter wild-type (WT) and Jedi-1 knockout (KO) DRG neurons. (A) The upper trace shows two superimposed currents from the same cell evoked by a voltage step from −100 mV to 0 mV. Replacement of extracellular NaCl with TEA-Cl abolished the fast inward current confirming it was due to activation of voltage-gated sodium channels. The peak current density evoked by a voltage step to 0 mV was not significantly different between genotypes. Each point is from an individual cell, box indicates median, 25% and 75% of the distribution, whisker indicate standard deviation of the mean. (B) Current-voltage relationship for wild type (WT) and knockout (KO) neurons. The upper panel shows an example of the stimulus protocol and sodium currents from a representative neuron. The lower panel plots mean peak current density against the test potential. (C) Normalized inactivation curves (left two curves) and activation curves (right two curves) for wild type and knockout neurons are superimposed. The inset cartoons depict the voltage protocols: inactivation was produced by a series of 500ms steps (−120 mV to 0 mV) prior to a 50ms test pulse to 0 mV. Peak current amplitude produced by the test pulse was normalized to the largest current and plotted against the voltage of the 500ms conditioning pulse. Solid curves show the fit with a double Boltzmann function. Activation curves were derived from the same data used to produce the current voltage-relationship in panel (B) (see methods for more detail). Solid curves show the fit with a Boltzmann function. The “window current” is shown on an expanded scale in the dashed box to the right.

References

    1. Lallemend, F. & Ernfors, P. Molecular interactions underlying the specification of sensory neurons. Trends in Neurosciences, 10.1016/j.tins.2012.03.006 (2012). - PubMed
    1. Oppenheim, R. Cell Death During Development Of The Nervous System. Annu. Rev. Neurosci., 10.1146/annurev.neuro.14.1.453 (1991). - PubMed
    1. Wu, H. H. et al. Glial precursors clear sensory neuron corpses during development via Jedi-1, an engulfment receptor. Nat. Neurosci., 10.1038/nn.2446 (2009). - PMC - PubMed
    1. Sullivan, C. S. et al. The adaptor protein GULP promotes Jedi-1-mediated phagocytosis through a clathrin-dependent mechanism. Mol. Biol. Cell., 10.1091/mbc.e13-11-0658 (2014). - PMC - PubMed
    1. Scheib, J. L., Sullivan, C. S. & Carter, B. D. Jedi-1 and MEGF10 Signal Engulfment of Apoptotic Neurons through the Tyrosine Kinase Syk. J. Neurosci., 10.1523/jneurosci.6350-11.2012 (2012). - PMC - PubMed