. 2019 Oct 31;13(2):388-399.
doi: 10.1111/eva.12876. eCollection 2020 Feb.

The genetics of phenotypic plasticity. XVII. Response to climate change

Affiliations

The genetics of phenotypic plasticity. XVII. Response to climate change

Samuel M Scheiner et al. Evol Appl. .

Abstract

The world is changing at a rapid rate, threatening extinction for a large part of the world's biota. One potential response to those altered conditions is to evolve so as to be able to persist in place. Such evolution includes not just traits themselves, but also the phenotypic plasticity of those traits. We used individual-based simulations to explore the potential of an evolving phenotypic plasticity to increase the probability of persistence in the response to either a step change or continual, directional change in the environment accompanied by within-generation random environmental fluctuations. Populations could evolve by altering both their nonplastic and plastic genetic components. We found that phenotypic plasticity enhanced survival and adaptation if that plasticity was not costly. If plasticity was costly, for it to be beneficial the phenotypic magnitude of plasticity had to be great enough in the initial generations to overcome those costs. These results were not sensitive to either the magnitude of the within-generation correlation between the environment of development and the environment of selection or the magnitude of the environmental fluctuations, except for very small phenotypic magnitudes of plasticity. So, phenotypic plasticity has the potential to enhance survival; however, more data are needed on the ubiquity of trait plasticity, the extent of costs of plasticity, and the rate of mutational input of genetic variation for plasticity.

Keywords: climate change; evolutionary rescue; genetic assimilation; model; phenotypic plasticity.


Figures

Figure 1
Figure 1
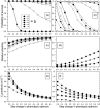
Responses after 1,000 generations to a step change in the environment for different plasticity parameters (b) and different magnitudes of the correlations between the environments at development and selection (ρ: 0.25 = open symbols, solid lines; 0.50 = solid symbols; 0.75 = open symbols, dashed lines). Other parameters were as follows: τ = 0.5. (a, c, e) Without plasticity costs. (b, d, f) With plasticity costs. (a, b) The probability of survival. (c, d) Final relative plasticity. (e, f) Final genetic variation for plasticity (variance of ∑Pijk). When only solid symbols are shown, the amount of temporal autocorrelation made little or no difference
Figure 2
Figure 2
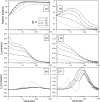
Temporal dynamics following a step change in the environment for different plasticity parameters (b). Other parameters were as follows: ρ = 0.5, τ = 0.5. (a, c, e) Without plasticity costs and with a step change in the environment of 4.0 units. (b, d, f) With plasticity costs and a step change in the environment of 2.8 units. (a, b) Relative plasticity. (c, d) Genetic variation for plasticity (∑Pijk). (e, f) Genetic variation for nonplastic phenotype component (∑Nijk)
Figure 3
Figure 3
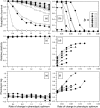
Responses after 1,000 generations of continual environmental change for different plasticity parameters (b) and different magnitudes of the correlations between the environments at development and selection (ρ: 0.25 = open symbols; 0.50 = solid symbols). Other parameters were as follows: τ = 0.5. (a, c, e) Without plasticity costs. (b, d, f) With plasticity costs. (a, b) The probability of survival. (c, d) Average final relative plasticity. (e, f) Expected value of final phenotypic lag (average optimum phenotype minus average phenotype). When only solid symbols are shown, there was little or no difference as a function of the amount of temporal autocorrelation
Figure 4
Figure 4
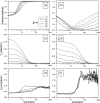
Temporal dynamics during continual environmental change for different plasticity parameters (b). Other parameters were as follows: ρ = 0.5, τ = 0.5. (a, c, e) Without plasticity costs and a rate of environmental change of 1.2 units/generation. (b, d, f) With plasticity costs and a rate of environmental change of 0.06 units/generation. (a, b) Average relative plasticity. (c, d) Average genetic variation for plasticity (∑Pijk). (e, f) Average genetic variance of nonplastic alleles (∑Nijk). All values were averaged over all populations that survived until the end of the simulation. For b = 0.1 without a cost, populations that survived had a higher than average initial plasticity, while with a cost, surviving populations had a lower than average initial plasticity. Therefore, in A and B the b = 0.1 curves do not begin at ρ = 0.5

References

    1. Acasuso‐Rivero, C. , Murren Courtney, J. , Schlichting Carl, D. , & Steiner Ulrich, K. (2019). Adaptive phenotypic plasticity for life‐history and less fitness‐related traits. Proceedings of the Royal Society B: Biological Sciences, 286, 20190653. - PMC - PubMed
    1. Barfield, M. , & Holt, R. D. (2016). Evolutionary rescue in novel environments: Towards improving predictability. Evolutionary Ecology Research, 17, 771–786.
    1. Bell, G. (2013). Evolutionary rescue and the limits of adaptation. Philosophical Transactions of the Royal Society B: Biological Sciences, 368, 20120080. - PMC - PubMed
    1. Botero, C. A. , Weissing, F. J. , Wright, J. , & Rubenstein, D. R. (2015). Evolutionary tipping points in the capacity to adapt to environmental change. Proceedings of the National Academy of Sciences, 112, 184–189. - PMC - PubMed
    1. Bürger, R. , & Lynch, M. (1995). Evolution and extinction in a changing environment. Evolution, 49, 151–163. - PubMed

LinkOut - more resources