. 2020 Jan 14:9:444.
doi: 10.3389/fcimb.2019.00444. eCollection 2019.

Age-Related Changes in the Gut Microbiota Modify Brain Lipid Composition

Affiliations

Age-Related Changes in the Gut Microbiota Modify Brain Lipid Composition

Mayssa Albouery et al. Front Cell Infect Microbiol. .

Abstract

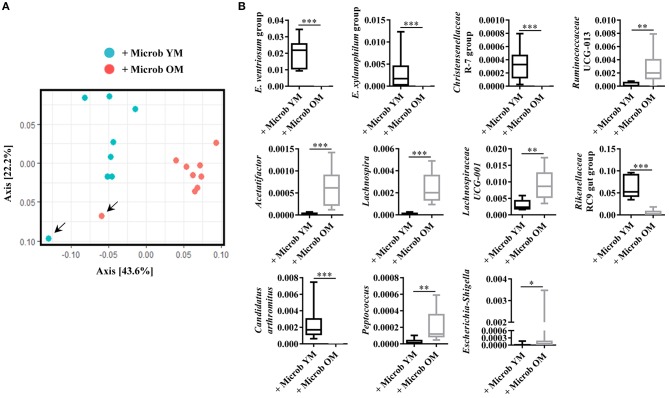
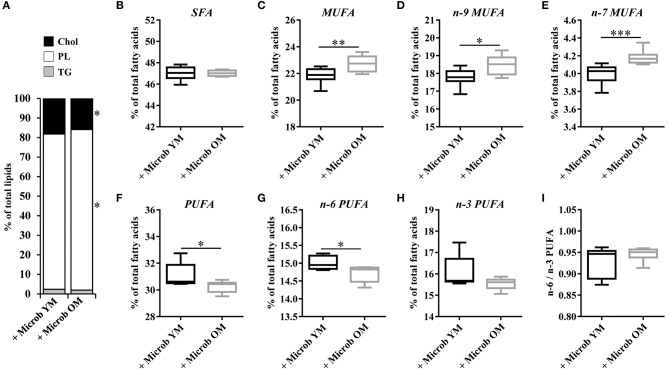
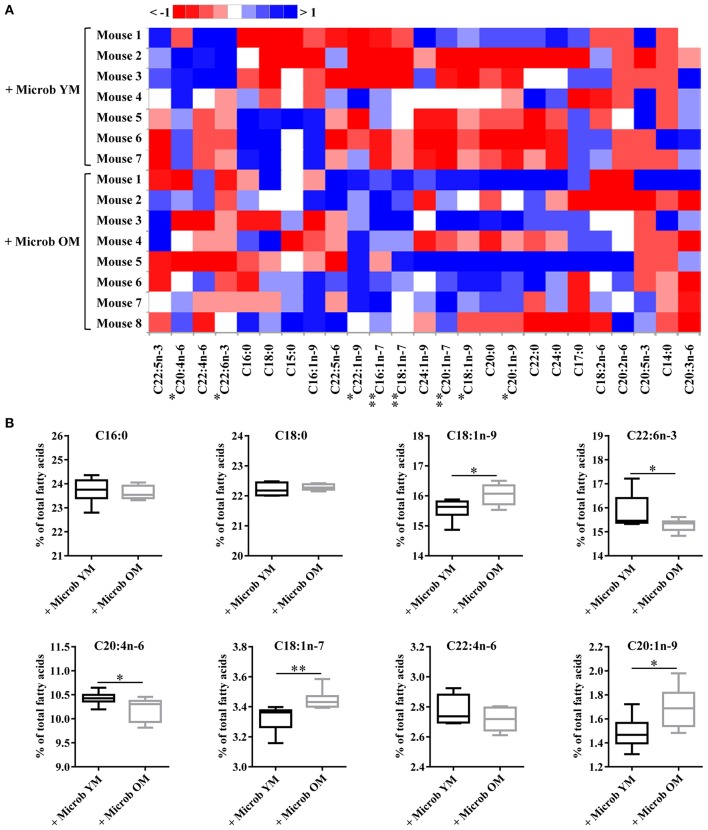
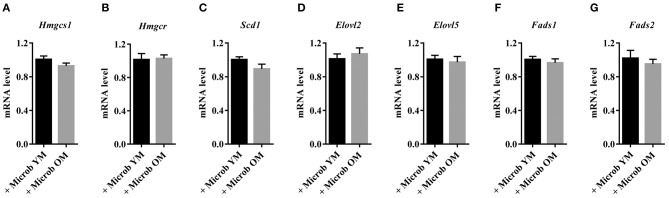
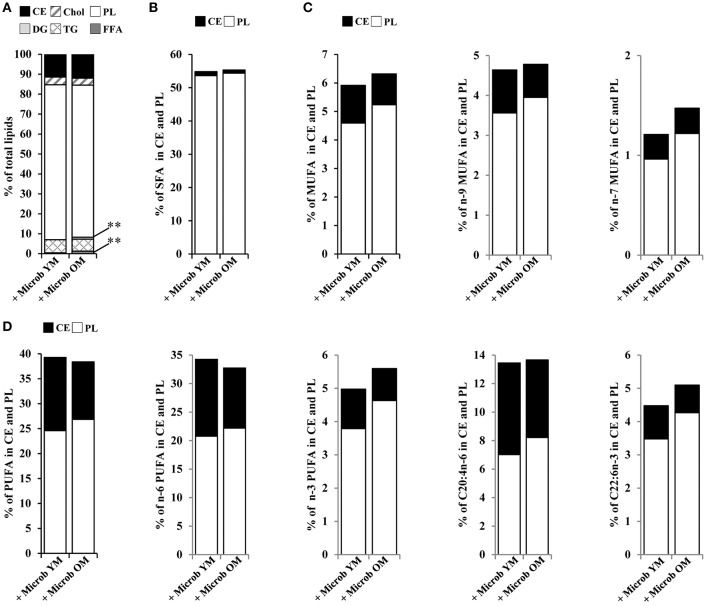
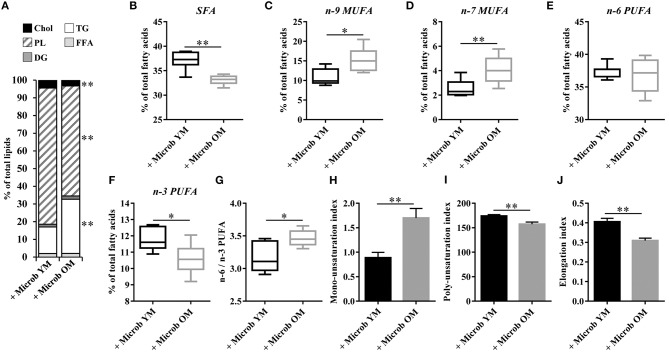
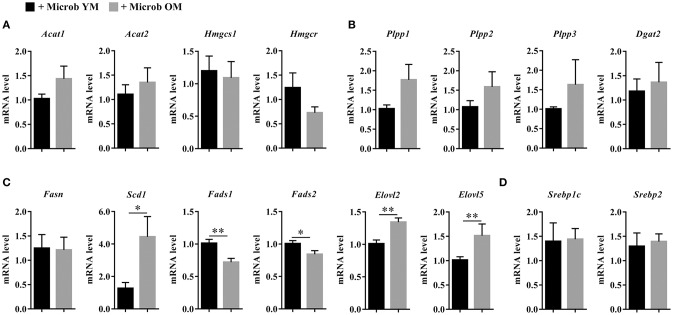
Understanding the molecular mechanisms underlying the changes observed during aging is a prerequisite to design strategies to prevent age-related diseases. Aging is associated with metabolic changes, including alteration in the brain lipid metabolism. These alterations may contribute to the development of pathophysiological conditions. Modifications in the gut microbiota composition are also observed during aging. As communication axes exist between the gut microbiota and the brain and knowing that microbiota influences the host metabolism, we speculated on whether age-associated modifications in the gut microbiota could be involved in the lipid changes observed in aging brain. For that purpose, germ-free mice were colonized by the fecal microbiota of young or old donor mice. Lipid classes and fatty acid profiles were determined in the brain (cortex), plasma and liver by thin-layer chromatography on silica gel-coated quartz rods and gas chromatography. Gut colonization by microbiota of old mice resulted in a significant increase in total monounsaturated fatty acids (MUFA) and a significant decrease in the relative amounts of cholesterol and total polyunsaturated fatty acids (PUFA) in the cortex. Among the eight most represented fatty acids in the cortex, the relative abundances of five (C18:1n-9, C22:6n-3, C20:4n-6, C18:1n-7, and C20:1n-9) were significantly altered in mice inoculated with an aged microbiota. Liquid chromatography analyses revealed that the relative abundance of major species among phosphatidyl and plasmenylcholine (PC 16:0/18:1), phosphatidyl and plasmenylethanolamine (PE 18:0/22:6), lysophosphatidylethanolamine (LPE 22:6) and sphingomyelins (SM d18:1/18:0) were significantly altered in the cortex of mice colonized by the microbiota obtained from aged donors. Transplantation of microbiota from old mice also modified the lipid class and fatty acid content in the liver. Finally, we found that the expression of several genes involved in MUFA and PUFA synthesis (Scd1, Fads1, Fads2, Elovl2, and Elovl5) was dysregulated in mice inoculated with an aged microbiota. In conclusion, our data suggest that changes in gut microbiota that are associated with aging can impact brain and liver lipid metabolisms. Lipid changes induced by an aged microbiota recapitulate some features of aging, thus pointing out the potential role of microbiota alterations in the age-related degradation of the health status.

Keywords: aging; cholesterol; cortex; fatty acid; lipid; liver; microbiota; phospholipid.


Figures

Figure 1
Figure 1
Microbiota analysis in recipient germ-free mice. (A) Composition of the fecal microbiota analyzed by Unifrac distance. Each dot represents one mouse. Blue dots represent fecal microbiota from germ-free mice (n = 7) inoculated with feces of conventionally raised young mice (+ Microb YM) and red dots represent fecal microbiota of germ-free mice (n = 8) inoculated with feces from conventionally raised old mice (+ Microb OM). Arrows indicate donors. (B) Relative abundance in percentage of genus significantly modified in fecal microbiota of mice inoculated with feces from young mice and of mice inoculated with feces from old mice. E. ventriosum group: [Eubacterium] ventriosum group, and E. xylanophilum group: [Eubacterium] xylanophilum group. Comparisons were done between the two groups of mice (+ Microb YM and + Microb OM). *p < 0.05, **p < 0.01 and ***p < 0.001.
Figure 2
Figure 2
Relative abundance of lipid classes and ester-linked fatty acids in the cortex of mice harboring different age-related microbiota. Lipids were extracted from the cortex of mice inoculated with fecal microbiota of young mice (+ Microb YM) or old mice (+ Microb OM). (A) Relative abundance of lipid classes. Results are expressed as the percentages of cholesterol (Chol), phospholipids (PL), and triglycerides (TG) relative to total lipids, defined as 100%. (B–H) Relative abundance of ester-linked fatty acids. The results correspond to the quantification of fatty acid methyl esters derivatives (FAME) by GC-FID. They are expressed as the percentages of total (B) saturated fatty acids (SFA), (C) monounsaturated fatty acids (MUFA), (D) omega-9 (n-9) MUFA, (E) omega-7 (n-7) MUFA, (F) polyunsaturated fatty acids (PUFA), (G) omega-6 (n-6) PUFA and (H) omega-3 (n-3) PUFA relative to total fatty acids, defined as 100%. (I) Ratio of n-6/n-3 PUFA. (B–I) All data are presented as mean ± SEM. n = 7 for the group of mice inoculated with the microbiota of young mice and n = 8 for the group of mice inoculated with the microbiota of old mice. Comparisons were done between the two groups of mice (+ Microb YM and + Microb OM). *p < 0.05, **p < 0.01 and ***p < 0.001.
Figure 3
Figure 3
Ester-linked fatty acid profile in the cortex of mice inoculated with different age-related microbiota. Lipids were extracted from the cortex of mice inoculated with fecal microbiota of young mice (+ Microb YM) or old mice (+ Microb OM). The results correspond to quantification of fatty acid methyl esters (FAME) derivatives by GC-FID. The percentage of each fatty acid relative to that of total fatty acids (100%) was determined. (A) Heat map showing the abundance of each fatty acid relative to total fatty acids, defined as 100% (B) Relative abundance of the eight most abundant fatty acids quantified in the brain. All data are presented as mean ± SEM. n = 7 for the group of mice inoculated with the microbiota of young mice and n = 8 for the group of mice inoculated with the microbiota of old mice. Comparisons were done between the two groups of mice (+ Microb YM and + Microb OM). *p < 0.05 and **p < 0.01.
Figure 4
Figure 4
Cortical expression of enzymes involved in cholesterol synthesis in mice harboring age-dependent microbiota. (A,B) Cortical expression of genes encoding enzymes involved in the biosynthesis of cholesterol: (A) hydroxymethylglutaryl-CoA synthase (Hmgcs1) and (B) 3-hydroxy-3-methylglutaryl-CoA reductase (Hmgcr). (C–G) Cortical expression of genes encoding enzymes involved in the biosynthesis of fatty acids: (C) acyl-CoA desaturase 1 (Scd1), (D,E) elongation of very long chain fatty acids proteins 2 and 5 (Elovl2 and Elovl5), (F) acyl-CoA (8-3)-desaturase (Fads1) and (G) acyl-CoA 6-desaturase (Fads2). The levels of mRNA were normalized to Hprt mRNA level for calculation of the relative levels of transcripts. mRNA levels are illustrated as fold change. All data are presented as mean ± SEM. n = 7 for the group of mice inoculated with the microbiota of young mice and n = 8 for the group of mice inoculated with the microbiota of old mice.
Figure 5
Figure 5
Plasma lipid and fatty acid profile in mice inoculated with different age-related microbiota. Lipids were extracted from the plasma of mice inoculated with fecal microbiota of young mice (+ Microb YM) or old mice (+ Microb OM). (A) Relative abundance of lipid classes. Results are expressed as the percentages of cholesteryl esters (CE), cholesterol (Chol), phospholipids (PL), diglycerides (DG), triglycerides (TG), and free fatty acids (FFA) relative to total lipids, defined as 100%. (B–D) Total lipid extract was separated on silica gel. CE and PL were extracted and their fatty acid profiles were determined by GC-FID. To express the results, we took into account the relative proportions of CE and PL measured in the total lipid extracts. Results are expressed as percentages of (B) total saturated fatty acids (SFA), (C) monounsaturated fatty acids (MUFA), and (D) polyunsaturated fatty acids (PUFA) on CE and PL in total lipid extracts, defined as 100%. All data are presented as mean. n = 7 for the group of mice inoculated with the microbiota of young mice and n = 7 for the group of mice inoculated with the microbiota of old mice. **p < 0.01.
Figure 6
Figure 6
Relative abundance of lipid classes and ester-linked fatty acids in the liver of mice inoculated with different age-related microbiota. Lipids were extracted from the liver of mice inoculated with fecal microbiota of young mice (+ Microb YM) or old mice (+ Microb OM). (A) Relative abundance of lipid classes. Results are expressed as the percentages of cholesterol (Chol), phospholipids (PL), diglycerides (DG), triglycerides (TG), and free fatty acids (FFA) relative to total lipids, defined as 100%. (B–J) The results presented were obtained from the analysis of the quantification data of fatty acid methyl esters (FAME) derivatives by GC-FID. Results are expressed as the percentages of total (B) saturated fatty acids (SFA), (C) omega-9 (n-9) monounsaturated fatty acids (MUFA), (D) omega-7 (n-7) MUFA, (E) omega-6 (n-6) polyunsaturated fatty acids (PUFA), and (F) omega-3 (n-3) PUFA relative to total fatty acids, defined as 100%. (G) Ratio of n-6/n-3 PUFA. (H) Mono-unsaturation index corresponding to the sum of the ratios “products” (C16:1n-7 and C16:1n-9)/“precursor” (C16) and “products” (C18:1n-7 and C18:1n-9)/“precursor” (C18). (I) Poly-unsaturation index corresponding to the sum of the amounts of each fatty acid that had more than on carbon-carbon double bond multiplied by its unsaturated bond number. (J) Elongation index corresponding to the ratio of fatty acids with 20-carbons and more/fatty acids with 16- and 18-carbons. All data are presented as mean ± SEM. n = 7 for the group of mice inoculated with the microbiota of young mice and n = 8 for the group of mice inoculated with the microbiota of old mice. Comparisons were done between the two groups of mice (+ Microb YM and + Microb OM). *p < 0.05 and **p < 0.01.
Figure 7
Figure 7
Expression of hepatic genes involved in lipid biosynthesis. (A) Hepatic expression of genes encoding enzymes involved in the biosynthesis of cholesterol: acetyl-CoA acetyltransferase 1 and 2 (Acat1 and Acat2), hydroxymethylglutaryl-CoA synthase (Hmgcs1) and 3-hydroxy-3-methylglutaryl-CoA reductase (Hmgcr). (B) Hepatic expression of genes encoding enzymes involved in the biosynthesis of di- and triglycerides: phospholipid phosphatases 1, 2, and 3 (Plpp1, Plpp2 and Plpp3) and diacylglycerol O-acyltransferase 2 (Dgat2). (C) Hepatic expression of genes encoding enzymes involved in the biosynthesis of fatty acids: fatty acid synthase (Fasn), acyl-CoA desaturase 1 (Scd1), acyl-CoA (8-3)-desaturase (Fads1), acyl-CoA 6-desaturase (Fads2), and elongation of very long chain fatty acids proteins 2 and 5 (Elovl2 and Elovl5). (D) Hepatic expression of genes encoding enzymes involved in the regulation of lipid synthesis: sterol regulatory element-binding proteins 1 (variant 3) and 2 (Srebp1c and Srebp2). The levels of mRNA were normalized to Hprt mRNA level for calculation of the relative levels of transcripts. mRNA levels are illustrated as fold change. All data are presented as mean ± SEM. n = 7 for the group of mice inoculated with the microbiota of young mice and n = 8 for the group of mice inoculated with the microbiota of old mice. Comparisons were done between the two groups of mice (+ Microb YM and + Microb OM). *p < 0.05 and **p < 0.01.

Similar articles

Cited by

References

    1. Acar N., Berdeaux O., Juaneda P., Gregoire S., Cabaret S., Joffre C., et al. . (2009). Red blood cell plasmalogens and docosahexaenoic acid are independently reduced in primary open-angle glaucoma. Exp. Eye Res. 89, 840–853. 10.1016/j.exer.2009.07.008 - DOI - PubMed
    1. Adak A., Khan M. R. (2019). An insight into gut microbiota and its functionalities. Cell Mol. Life Sci. 76, 473–493. 10.1007/s00018-018-2943-4 - DOI - PMC - PubMed
    1. Adibhatla R. M., Hatcher J. F. (2007). Role of lipids in brain injury and diseases. Fut. Lipidol 2, 403–422. 10.2217/17460875.2.4.403 - DOI - PMC - PubMed
    1. Alvarez-Mercado A. I., Navarro-Oliveros M., Robles-Sanchez C., Plaza-Diaz J., Saez-Lara M. J., Munoz-Quezada S., et al. . (2019). Microbial population changes and their relationship with human health and disease. Microorganisms 7:68. 10.3390/microorganisms7030068 - DOI - PMC - PubMed
    1. Backhed F., Ding H., Wang T., Hooper L. V., Koh G. Y., Nagy A., et al. . (2004). The gut microbiota as an environmental factor that regulates fat storage. Proc. Natl. Acad. Sci. U.S.A. 101, 15718–15723. 10.1073/pnas.0407076101 - DOI - PMC - PubMed

Publication types

MeSH terms