. 2020 May;139(5):855-874.
doi: 10.1007/s00401-020-02126-w. Epub 2020 Jan 29.

T cell infiltration in both human multiple system atrophy and a novel mouse model of the disease

Affiliations

T cell infiltration in both human multiple system atrophy and a novel mouse model of the disease

Gregory P Williams et al. Acta Neuropathol. 2020 May.

Abstract

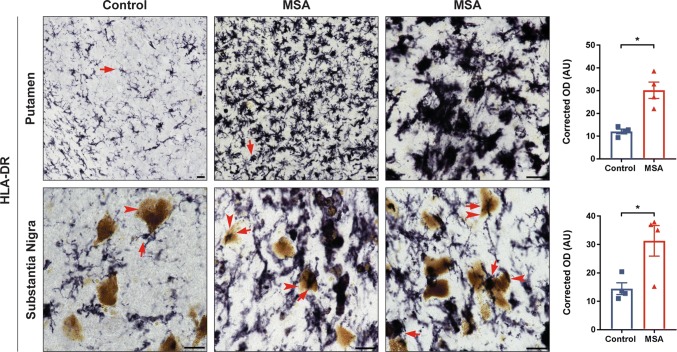
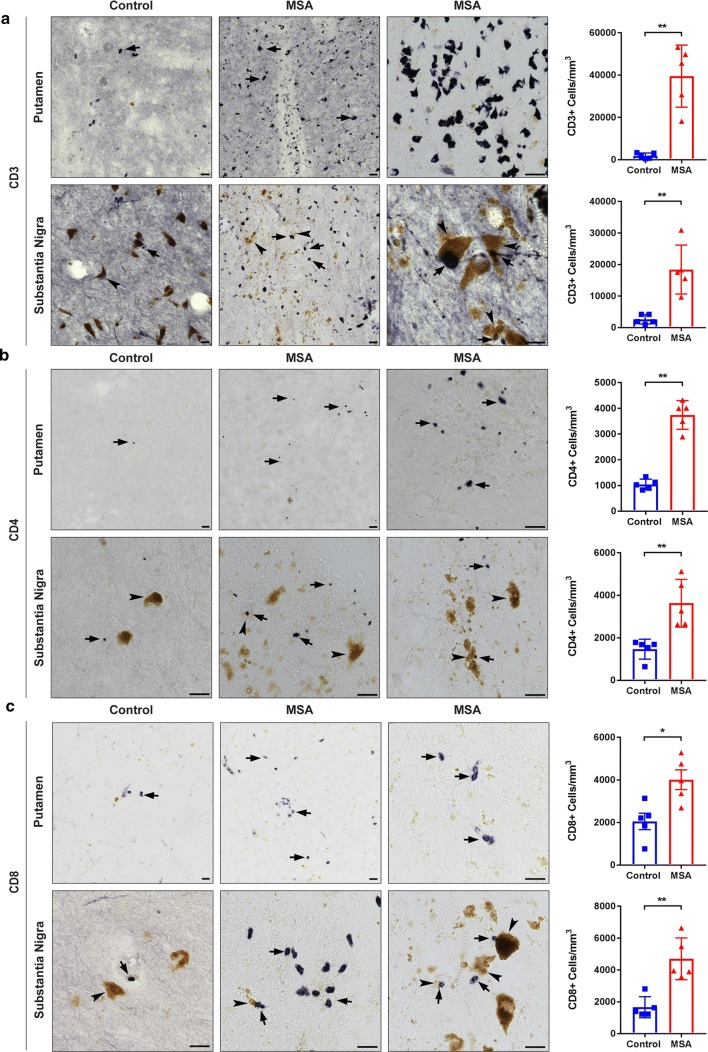
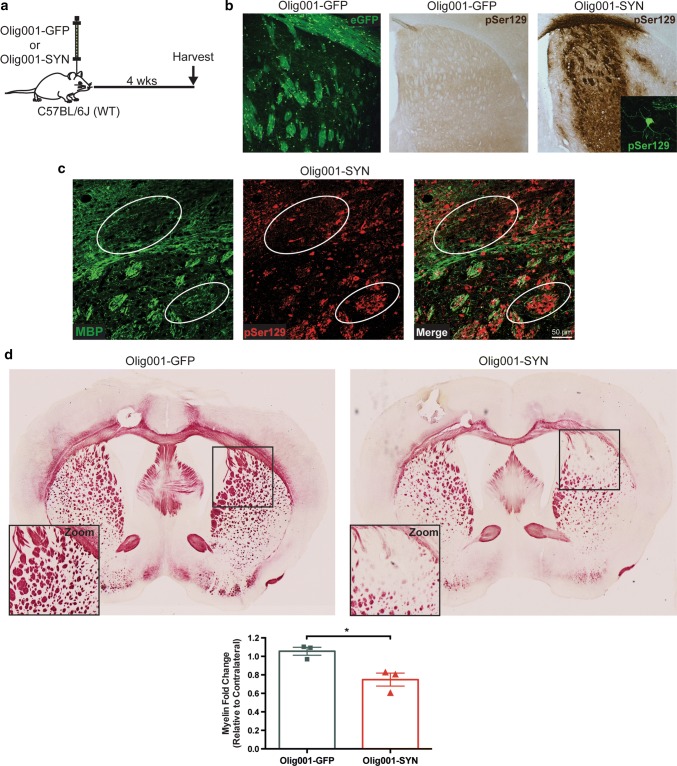
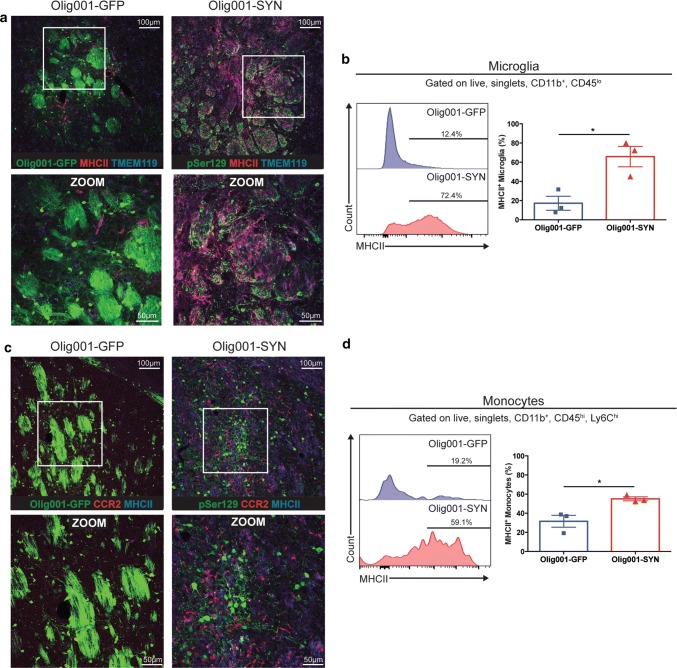
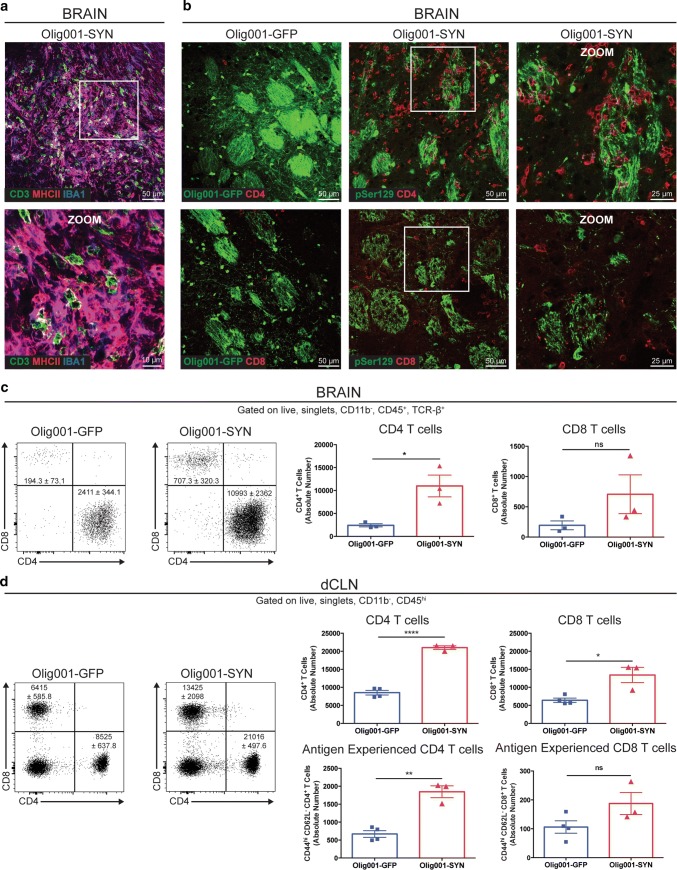
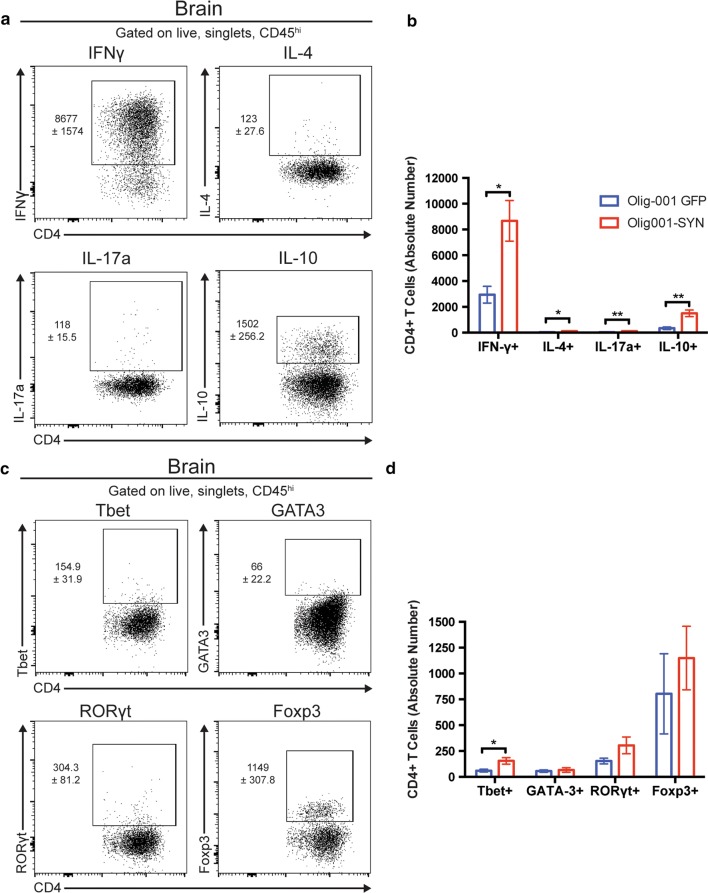
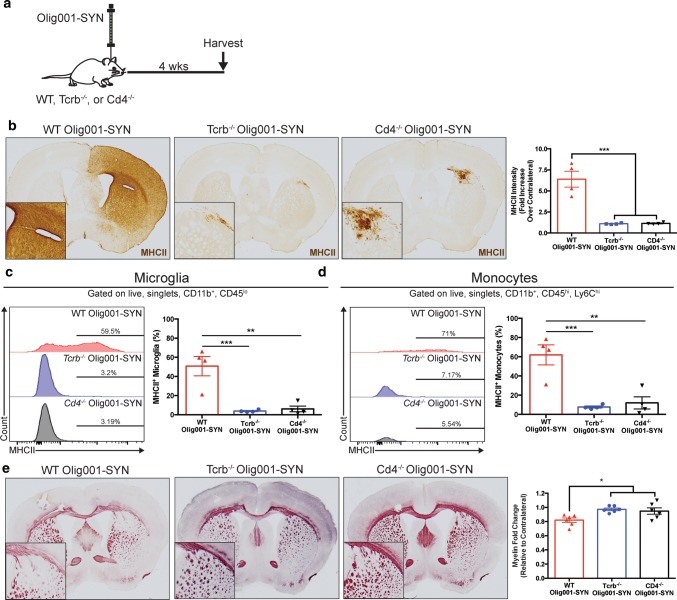
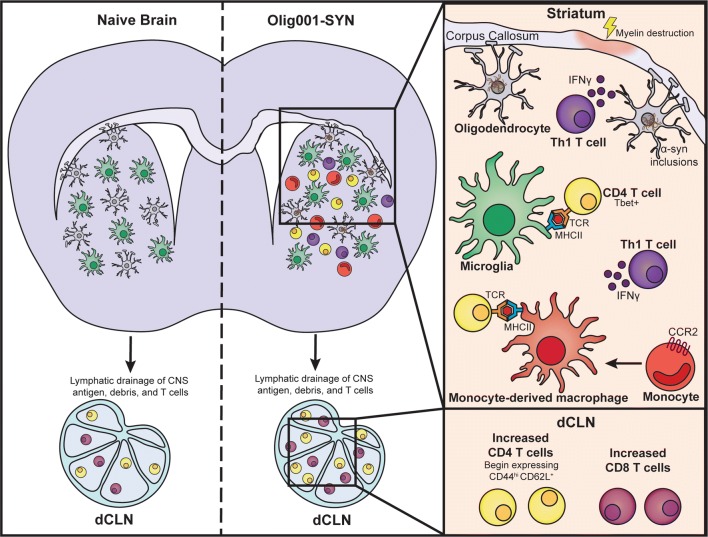
Multiple system atrophy (MSA) is a progressive neurodegenerative disorder characterized by abnormal accumulation of alpha-synuclein (α-syn) in oligodendrocytes accompanied by inflammation, demyelination, and subsequent synapse and neuronal loss. Little is known about the mechanisms of neurodegeneration in MSA. However, recent work has highlighted the important role of the immune system to the pathophysiology of other synuclein-related diseases such as Parkinson's disease. In this study, we investigated postmortem brain tissue from MSA patients and control subjects for evidence of immune activation in the brain. We found a significant increase of HLA-DR+ microglia in the putamen and substantia nigra of MSA patient tissue compared to controls, as well as significant increases in CD3+, CD4+, and CD8+ T cells in these same brain regions. To model MSA in vivo, we utilized a viral vector that selectively overexpresses α-syn in oligodendrocytes (Olig001-SYN) with > 95% tropism in the dorsal striatum of mice, resulting in demyelination and neuroinflammation similar to that observed in human MSA. Oligodendrocyte transduction with this vector resulted in a robust inflammatory response, which included increased MHCII expression on central nervous system (CNS) resident microglia, and infiltration of pro-inflammatory monocytes into the CNS. We also observed robust infiltration of CD4 T cells into the CNS and antigen-experienced CD4 T cells in the draining cervical lymph nodes. Importantly, genetic deletion of TCR-β or CD4 T cells attenuated α-syn-induced inflammation and demyelination in vivo. These results suggest that T cell priming and infiltration into the CNS are key mechanisms of disease pathogenesis in MSA, and therapeutics targeting T cells may be disease modifying.

Keywords: Alpha-synuclein; Demyelination; Microglia; Monocytes; Multiple system atrophy; Oligodendrocytes; T cells.


Figures

Fig. 1
Fig. 1
HLA-DR expression in human postmortem MSA brain tissue. Control (left) and MSA (middle and right) postmortem brain sections of the putamen (top) and substantia nigra (bottom) stained with HLA-DR (DAB, black staining). Quantification of the staining intensity revealed a significant increase of HLA-DR staining in the putamen and in the substantia nigra. Arrows denote “resting” (control, left) or “activated” (MSA, middle and right) microglia; arrowheads denote neuromelanin laden dopamine neurons in the substantia nigra. Representative images. All scale bars indicate 25 μm. Graphs display the mean ± SEM. *p < 0.05, unpaired nonparametric Mann Whitney Test was used to compare groups, n = 4 per group
Fig. 2
Fig. 2
T cell infiltration in human postmortem MSA brain tissue. Control (left) and MSA (middle, right) postmortem brain sections of the putamen (top panel) and substantia nigra (bottom panel) were stained with CD3 (a), CD4 (b), and CD8 (c) antibodies (DAB, black staining). Unbiased stereological cell counts indicate a significant increase in the number of CD3+ T cells (a), CD4+ T (b), and CD8+ T cells (c) in the putamen and in the substantia nigra of MSA cases compared to control subjects. Brown coloring in the nigral sections are neuromalanin laden dopamine neurons (arrowheads). Of note, the yellow–brown pigment in putamenal sections is lipofuscin, an aging pigment composed of lipid residues of lysosomal digestion. Arrows denote T cells; arrowheads denote neuromelanin laden dopamine neurons in the substantia nigra. Representative images. All scale bars indicate 25 μm. Graphs display the mean ± SEM. *p < 0.05, **p < 0.01, unpaired nonparametric Mann Whitney Test was used to compare groups, n = 5 per group
Fig. 3
Fig. 3
Olig001-SYN expression in oligodendrocytes results in demyelination in the striatum and corpus callosum of mice. a C57BL/6 J mice 8–12 weeks of age received a unilateral stereotaxic injection of Olig001-GFP (control) or Olig001-SYN into the right dorsal striatum. b 4 weeks post-transduction, eGFP (green) is visible in the dorsal striatum and corpus callosum of Olig001-GFP transduced animals and pSer129 (DAB, brown) in Olig001-SYN transduced animals, but not Olig001-GFP transduced animals. Zoom inset shows viral transduction in oligodendrocytes (pSer129, green). Representative images. c IHC shows areas with decreased MBP expression (white circle inserts) in the striatum and corpus callosum of mice transduced with Olig001-SYN. Olig001-SYN expression (pSer129, red) is associated with demyelination (MBP, green) 4 weeks post transduction. 40X confocal images. Scale bar is 50 μm d BlackGold+ staining in Olig001 transduced mice revealed areas of active demyelination (black square insert) in the corpus callosum and dorsal striatum. 10× brightfield images. BlackGold+ myelin is quantified and plotted as fold change relative to contralateral (uninjected side). Mean values ± SEM, unpaired t test, *p < 0.05, n = 3 per group
Fig. 4
Fig. 4
Olig001-SYN expression in the striatum induces MHCII expression on CNS resident microglia and infiltrating monocytes. C57BL/6J mice 8–12 weeks of age received a unilateral stereotaxic injection of Olig001-GFP (control) or Olig001-SYN into the right dorsal striatum. 4 weeks post-transduction a MHCII+ (red), TMEM119+ (blue) microglia are observed in dorsal striatum and corpus callosum of Olig001-SYN (pSer129, green) transduced animals. Zoom inserts (white boxes) show cells with distinct microglial morphology surrounding eGFP+ or pSer129 oligodendrocytes. Confocal images displaying co-localization of TMEM119+ microglia with MHCII. Representative images, Scale bar is 100 μM in 20× confocal images and 50μM in zoom inserts. b Mononuclear isolation and flow cytometry on isolated dorsal striatal tissues revealed a significant number and percentage of single, live, CD45lo, CD11b+, MHCII+ microglia in Olig001-SYN transduced mice when compared to Olig001-GFP control. Mean values are plotted ± SEM, unpaired t test. *p < 0.05, n = 3 per group. c C57BL6/J mice 8–12 weeks of age received a unilateral stereotaxic injection of Olig001-GFP (control) or Olig001-SYN into the right dorsal striatum. 4 weeks post-transduction CCR2+ (red), MHCII+ (blue) monocytes are observed in dorsal striatum and corpus callosum of Olig001-SYN (pSer129, green) transduced animals. Confocal images displaying co-localization of CCR2+ monocytes with MHCII. Representative images, Scale bar is 100 μM in 20× confocal images and 50 μM in zoom inserts. d Mononuclear cell isolation and flow cytometry revealed a significant increase in the percent of single, live, CD45hi, CD11b+, Ly6Chi, MHCII+ monocytes. Mean values are plotted ± SEM, unpaired t-test *p < 0.05, n = 3 per group
Fig. 5
Fig. 5
T cells infiltrate into the CNS and accumulate in draining LNs in response to oligodendrocyte expression of α-syn. a C57BL/6 J mice 8–12 weeks of age received a unilateral stereotaxic injection of Olig001-SYN into the right dorsal striatum. 4 weeks post-transduction in the CNS, CD3+ (green) T cells are observed in close proximity with IBA-1+ (blue) MHCII + (red) microglia/macrophages in the ipsilateral striatum. Bottom panel (white box, zoom insert) displays a cluster of CD3+ cells (green) in close proximity of IBA-1+ MHCII + microglia/macrophages in the dorsal striatum. 40 × confocal images. Scale bar is 50 μM in top paneel images and 10 μM in zoom insert. b Representative confocal images show CD8+ or CD4+ T cells (red) surrounding oligodendrocytes transduced with Olig001-SYN (pSer129, green) but not Olig001-GFP control. 40 × Confocal images. White box is zoom insert. Scale bar is 50 μM in 20 × images and 25 μM in zoom inserts. c C57BL/6 J mice 8–12 weeks of age received a bilateral stereotaxic injection of Olig001-SYN or Olig001-GFP control into the right dorsal striatum. 4 weeks post-transduction in the CNS, mononuclear cell isolation and flow cytometry on striatal tissues revealed an increase in the percent and number of single, live, CD45+, TCR-β+, CD4+ or CD8+ T cells in response to Olig001-SYN expression in the dorsal striatum. Mean values are plotted ± SEM, unpaired t-test. *p < 0.05. ns not significant, n = 3 per group. d C57BL/6 J mice 8–12 weeks of age received bilateral stereotaxic injections of Olig001-GFP (control) or Olig001-SYN into the right dorsal striatum. 4 weeks post-transduction draining cervical lymph nodes were isolated and analyzed by flow cytometry. Analysis revealed an increase in the absolute number of CD4+ T cells (gated as single, live, CD45hi, CD4+), as well as antigen-experienced CD4+ T cells (gated as single, live, CD45+, TCR-β+, CD4+, CD44hi, CD62L). Mean values are plotted ± SEM, unpaired t-test. ****p < 0.0001, **p < 0.01. Analysis also revealed an increase in the absolute number of CD8+ T cells (gated as single, live, CD45hi, CD8+), but no increase in antigen experienced T cells (gated as single, live, CD45+, TCR-β+, CD4+, CD44hi, CD62L). unpaired t test. *p < 0.05, n = 3–4 per group
Fig. 6
Fig. 6
α-Syn responding CD4 T cells are associated with a Th1 phenotype. C57BL/6 J mice 8–12 weeks of age received a bilateral stereotaxic injection of Olig001-SYN or Olig001-GFP control into the right dorsal striatum. 4 weeks post-transduction in the CNS, mononuclear cell isolation, intracellular cytokine/transcription factor staining, and flow cytometry were performed on the isolated dorsal striatal tissues. a Representative flow cytometry plots depicting partial gating of the stained Th cytokines IFN-γ, IL-4, IL-17a, and IL-10. b Quantification of cytokine staining showing increased amounts of Th cytokines in the Olig001-SYN transduced animals compared to Olig001-GFP controls. Mean values are plotted ± SEM, unpaired t test. *p < 0.05, **p < 0.01, n = 4 per group. c Representative flow cytometry plots depicting partial gating of the stained transcription factors Tbet, GATA3, RORγt, and Foxp3. d Quantification of the transcription factor staining in c showing a significant increase in Th1 associated, Tbet+ CD4 T cells in the Olig001-SYN transduced animals compared to Olig001-GFP controls. Mean values are plotted ± SEM, unpaired t-test. *p < 0.05, n = 4 per group
Fig. 7
Fig. 7
Knockout of αβ T Cells or CD4 T Cells alone reduces CNS myeloid activation and demyelination in response to α-syn expression. a WT, Tcrb−/−, or Cd4−/− mice 8–12 weeks of age on a C57BL/6 J congenic background received a unilateral stereotaxic injection of Olig001-SYN into the right dorsal striatum. b 4 weeks post transduction MHCII+ immunostaining (DAB, brown) was assessed. Quantification of MHCII staining intensity relative to contralateral side in WT, Tcrb−/−, or Cd4−/− mice transduced with Olig001-SYN. Knockout of TCRβ and CD4 attenuated Olig001-SYN induced MHCII expression. Mean values are plotted ± SEM, One way ANOVA with Dunnett’s post-hoc test ***p < 0.001, n = 4 per group. c Mononuclear isolation and flow cytometry on isolated dorsal striatal tissues from Tcrb−/− and Cd4−/− mice revealed a significant decrease in the percentage of CD45lo, CD11b+, MHCII+ microglia when compared to WT injected control. Mean values are plotted ± SEM, One-way ANOVA, Dunnett’s post-hoc test, **p < 0.01, ***p < 0.001, n = 4 per group. d Mononuclear cell isolation and flow cytometry on dorsal striatum isolated from Tcrb−/− and Cd4−/− revealed a significant decrease in the percent of CD45hi, CD11b+, Ly6Chi, MHCII+ monocytes when compared to WT control. Mean values are plotted ± SEM, One-way ANOVA Dunnett’s post-hoc test, **p < 0.01, ***p < 0.001, n = 4 per group. e WT, Tcrb−/−, or Cd4−/− mice 8–12 weeks of age received a unilateral stereotaxic injection of Olig001-SYN into the right dorsal striatum. 4 weeks post transduction BlackGold staining in virally transduced mice revealed areas of active demyelination (zoom, square insert) that were attenuated in both Tcrb−/− and Cd4−/− mice. Mean values are plotted ± SEM, One-way ANOVA with Dunnett’s post-hoc test, *p < 0.05 n = 6 per group
Fig. 8
Fig. 8
Proposed hypothesis of inflammation and neuropathology in the Olig001-SYN mouse model of MSA. The accumulation of pathogenic α-syn in oligodendrocytes (gray cells) leads to upregulation of MHCII on microglia (green cells). These activated microglia then produce signals that promote the infiltration of CD4+ T cells (yellow cells) and CCR2+ monocytes (moncyte derived macrophages, red cells) from the peripheral blood. The infiltrated CD4 T cells, now in the CNS, can interact with microglial/macrophage MHCII via their TCR. After this MHCII/TCR interaction, CD4 T cells further differentiate into Tbet+ Th1 T cells (purple cells) that produce IFN-γ. These CD4 T cells also drain to CNS draining deep cervical lymph nodes (dCLN) where they can potentiate further immunological responses. All of these pro-inflammatory cells (microglia, monocyte-derived macrophages, and CD4 T cells) promote dysfunction/destruction of oligodendrocytes leading to demyelination of the striatum and corpus callosum

References

    1. Allen Reish HE, Standaert DG. Role of alpha-synuclein in inducing innate and adaptive immunity in Parkinson disease. J Parkinsons Dis. 2015;5:1–19. doi: 10.3233/JPD-140491. - DOI - PMC - PubMed
    1. Anderson JP, Walker DE, Goldstein JM, de Laat R, Banducci K, Caccavello RJ, et al. Phosphorylation of Ser-129 is the dominant pathological modification of alpha-synuclein in familial and sporadic Lewy body disease. J Biol Chem. 2006;281:29739–29752. doi: 10.1074/jbc.M600933200. - DOI - PubMed
    1. Arima K, Ueda K, Sunohara N, Arakawa K, Hirai S, Nakamura M, et al. NACP/alpha-synuclein immunoreactivity in fibrillary components of neuronal and oligodendroglial cytoplasmic inclusions in the pontine nuclei in multiple system atrophy. Acta Neuropathol. 1998;96:439–444. doi: 10.1007/s004010050917. - DOI - PubMed
    1. Beach TG, Adler CH, Sue LI, Serrano G, Shill HA, Walker DG, et al. Arizona study of aging and neurodegenerative disorders and brain and body donation program. Neuropathology. 2015;35:354–389. doi: 10.1111/neup.12189. - DOI - PMC - PubMed
    1. Bower JH, Maraganore DM, McDonnell SK, Rocca WA. Incidence of progressive supranuclear palsy and multiple system atrophy in Olmsted County, Minnesota, 1976 to 1990. Neurology. 1997;49:1284–1288. doi: 10.1212/wnl.49.5.1284. - DOI - PubMed

Publication types