. 2020 Jul;82(5):2482-2501.
doi: 10.3758/s13414-019-01952-9.

Task-related gaze control in human crowd navigation

Affiliations

Task-related gaze control in human crowd navigation

Roy S Hessels et al. Atten Percept Psychophys. 2020 Jul.

Abstract

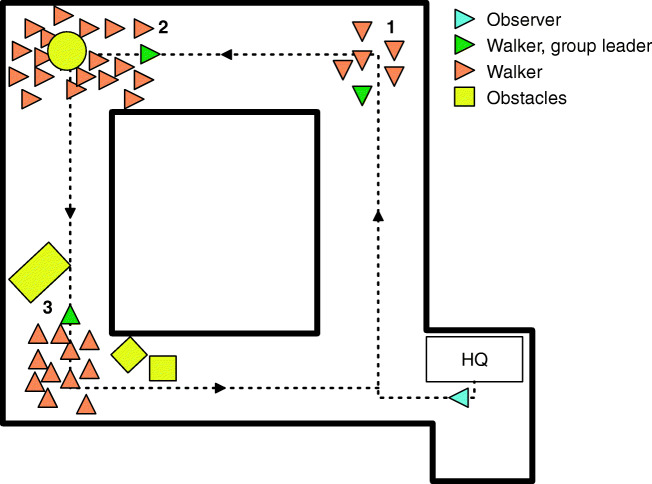
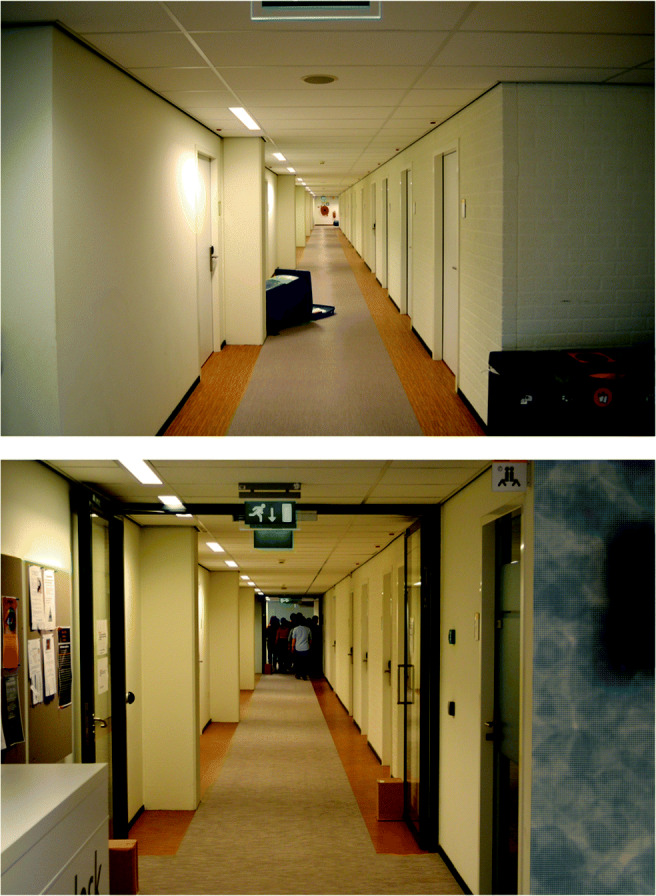
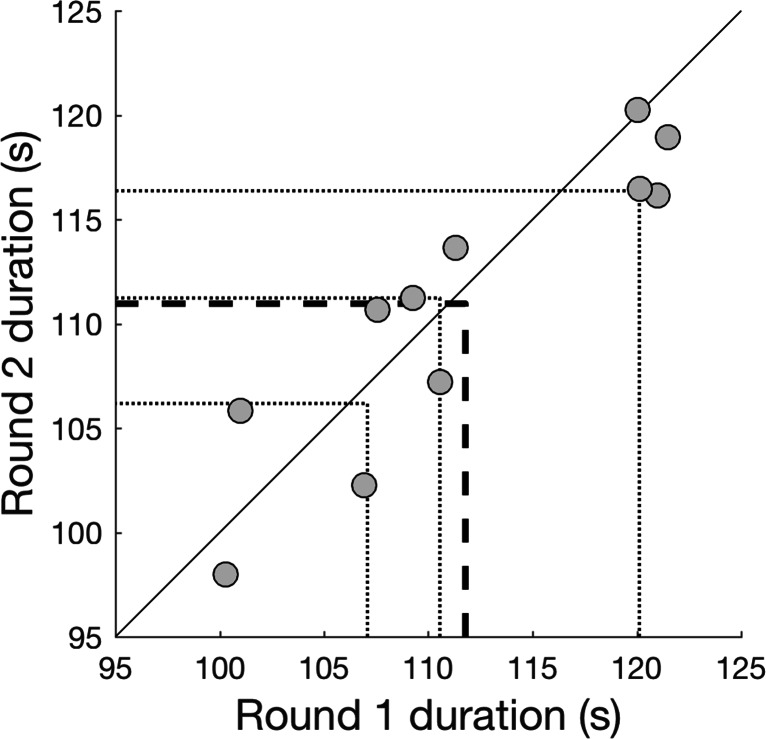
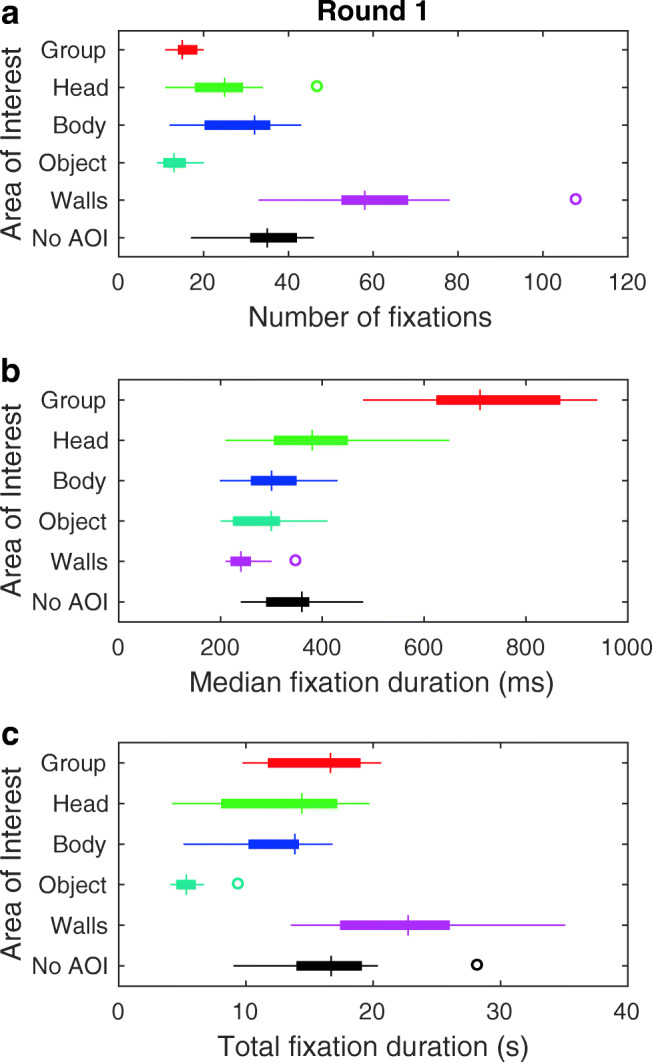
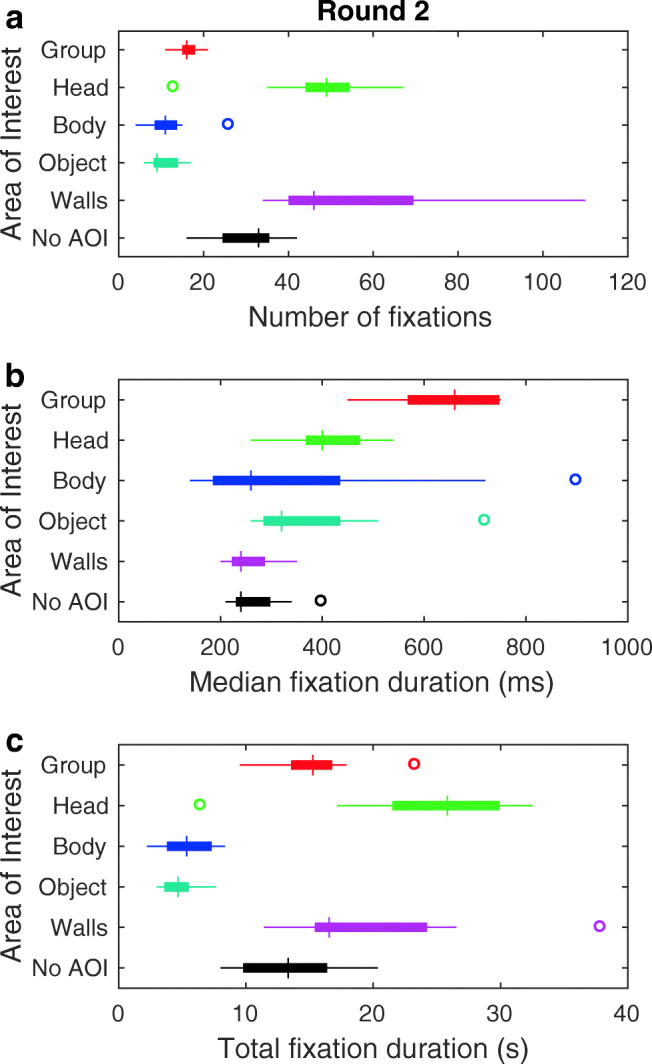
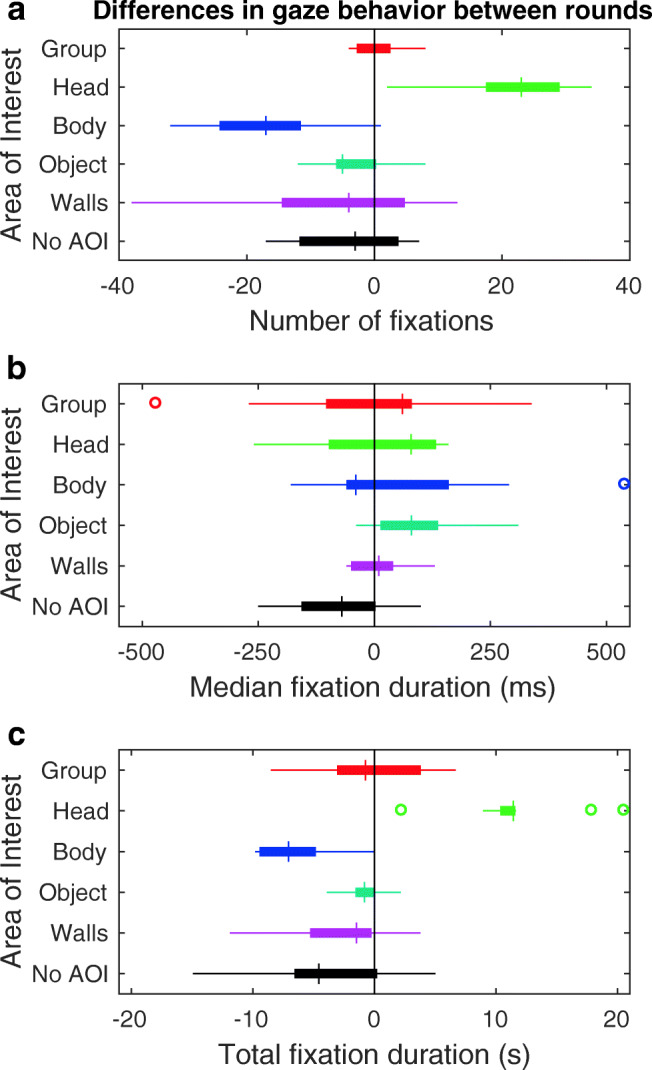
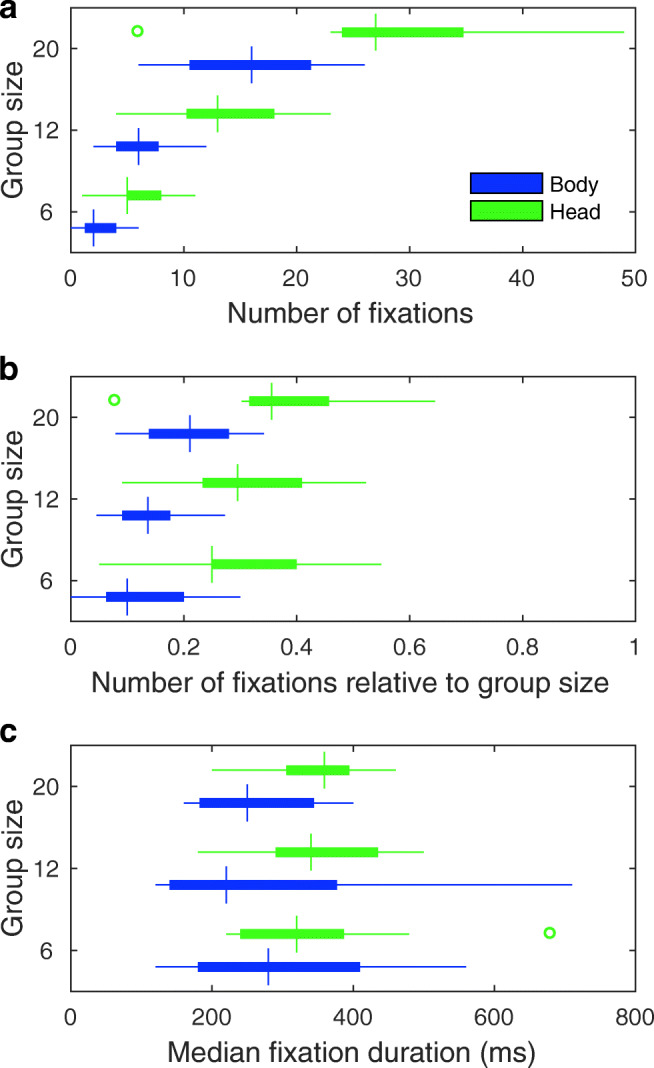
Human crowds provide an interesting case for research on the perception of people. In this study, we investigate how visual information is acquired for (1) navigating human crowds and (2) seeking out social affordances in crowds by studying gaze behavior during human crowd navigation under different task instructions. Observers (n = 11) wore head-mounted eye-tracking glasses and walked two rounds through hallways containing walking crowds (n = 38) and static objects. For round one, observers were instructed to avoid collisions. For round two, observers furthermore had to indicate with a button press whether oncoming people made eye contact. Task performance (walking speed, absence of collisions) was similar across rounds. Fixation durations indicated that heads, bodies, objects, and walls maintained gaze comparably long. Only crowds in the distance maintained gaze relatively longer. We find no compelling evidence that human bodies and heads hold one's gaze more than objects while navigating crowds. When eye contact was assessed, heads were fixated more often and for a total longer duration, which came at the cost of looking at bodies. We conclude that gaze behavior in crowd navigation is task-dependent, and that not every fixation is strictly necessary for navigating crowds. When explicitly tasked with seeking out potential social affordances, gaze is modulated as a result. We discuss our findings in the light of current theories and models of gaze behavior. Furthermore, we show that in a head-mounted eye-tracking study, a large degree of experimental control can be maintained while many degrees of freedom on the side of the observer remain.

Keywords: Gaze; Human crowds; Social affordances; Social interaction; Task; Wearable eye tracking.


Figures

Fig. 1
Fig. 1
Schematic overview of the lab center with the starting positions of the three groups of walkers (orange arrowheads, with group leaders in green arrowheads) and observer (light blue arrowhead). Arrowheads point into the walking direction. The black arrows indicate the route of the observer. Headquarters (HQ) indicate where the eye-tracking glasses were fitted. Obstacles are marked in yellow. Each group of walkers is characterized by its number. The corridors were 40-45 m in length, and roughly 2.25 m wide
Fig. 2
Fig. 2
Two corridors of the lab center in which the present study was conducted. The top panel depicts the tipped trashcan as described in Setup lab center, photographed from the starting position of group 3 (see Fig. 1). The bottom panel depicts the largest group of walkers in the background, photographed from the corner closest to the observer starting position (see Fig. 1). The photograph is taken from the back to protect the privacy of the walkers
Fig. 3
Fig. 3
Duration of rounds 1 and 2 as a performance measure of hallway navigation while avoiding collisions. Each round took between 95 and 125 s, i.e., roughly 1.5 to 2 min. Round duration is defined as the time between the start of the first fixation and the end of the last fixation that fall completely within the round start and end times as coded by both video coders. Each dot represents one observer. The black line corresponds to unity. Dotted lines indicate the 25th, 50th (median), and 75th percentile. The bold dashed line indicates the mean
Fig. 4
Fig. 4
Measures of observers’ gaze behavior in round 1. Panels depict box and whisker plots for a the number of fixations b median fixation duration, and c total fixation duration. Box and whisker plots are organized by area of interest. Medians are indicated by the vertical bars. Boxes cover the 25th to 75th percentiles (inter-quartile range; IQR). Whiskers extend from the 25th and 75th percentile to cover all participant data lying within 1.5 times the IQR from the 25th and 75th percentile, respectively. Any participant data lying outside this range are identified by an open circle. The ‘No AOI’ encompasses all fixations not on any of the other AOIs (e.g., to the floor)
Fig. 5
Fig. 5
Measures of observers’ gaze behavior to people in rounds 1 and 2. Box and whisker plots indicate the relative total fixation duration to people (sum of fixations to the group, head and body) for each round. Medians are indicated by the vertical bars. Boxes cover the 25th to 75th percentiles (inter-quartile range; IQR). Whiskers extend from the 25th and 75th percentile to cover all participant data lying within 1.5 times the IQR from the 25th and 75th percentile, respectively. Any participant data lying outside this range is identified by an open circle. Relative total fixation duration is estimated according to two methods. The top panel depicts the lower-limit estimate of relative total fixation duration to people, which was calculated by dividing the sum of total fixation durations to the group, body, and head AOIs by the total time that people were in view in the scene camera video. The latter was determined as the time between a group entering the scene camera video and the last person of a group leaving the scene camera video. This is considered a lower limit estimate, as a relative total fixation duration of 1 can only be obtained by one continuous fixation on a group for the entire duration it is in view. However, the eye-tracking data also contains fast phases (saccades) and/or data loss. As such, another estimate was also calculated. The bottom panel depicts the upper-limit estimate of relative total fixation duration to people, calculated by dividing the total fixation durations to the group, body, and head AOIs by an estimated maximum time people could be looked at. This estimated maximum time was calculated by first determining the proportion of eye-tracking data that contained fixations, compared to fast phases and/or data loss for the entire eye-tracking recording. This proportion was then multiplied by the total time people were in view in the scene camera video. If for example people are in view for 50 s, and the proportion of eye-tracking data that contained fixations was 0.8, the estimated maximum time people could be looked at was 40 s
Fig. 6
Fig. 6
Measures of observers’ gaze behavior in round 2. Panels depict box and whisker plots for a the number of fixations, b median fixation duration, and c total fixation duration. Box and whisker plots are organized by area of interest. Medians are indicated by the vertical bars. Boxes cover the 25th to 75th percentiles (inter-quartile range; IQR). Whiskers extend from the 25th and 75th percentile to cover all participant data lying within 1.5 times the IQR from the 25th and 75th percentile, respectively. Any participant data lying outside this range is identified by an open circle. The ‘No AOI’ encompasses all fixations not on any of the other AOIs (e.g., to the floor)
Fig. 7
Fig. 7
Difference in measures of observers’ gaze behavior between rounds. Panels depict box and whisker plots for the per-participant difference between rounds 1 and 2 for a the number of fixations, b median fixation duration, and c total fixation duration. Differences are calculated by subtracting the value obtained in round 1 (collision avoidance only) from the value obtained in round 2 (dual task collision avoidance and eye-contact assessment). This means that positive numbers indicate increases in round 2 with respect to round 1. Negative numbers indicate decreases in round 2 with respect to round 1. Box and whisker plots are organized by area of interest. Medians are indicated by the vertical bars. Boxes cover the 25th to 75th percentiles (inter-quartile range; IQR). Whiskers extend from the 25th and 75th percentile to cover all participants lying within 1.5 times the IQR from the 25th and 75th percentile, respectively. The black vertical line indicates the no-difference point between round 1 and 2. The ‘No AOI’ encompasses all fixations not on any of the other AOIs (e.g., to the floor)
Fig. 8
Fig. 8
Measures of observers’ gaze behavior to bodies and heads as a function of group size. Panels depict box and whisker plots for the a number of fixations, b number of fixations relative to group size, and c median fixation duration to the body and head as a function of group size. Medians are indicated by the vertical bars. Boxes cover the 25th to 75th percentiles (inter-quartile range; IQR). Whiskers extend from the 25th and 75th percentile to cover all participant data lying within 1.5 times the IQR from the 25th and 75th percentile, respectively. Any participant data lying outside this range is identified by an open circle
Fig. 9
Fig. 9
Gaze direction in azimuth and elevation components (in Fick coordinates, see Haslwanter (1995)) with respect to the center of the scene camera of the Tobii Pro Glasses 2 (see https://www.tobiipro.com/product-listing/tobii-pro-glasses-2-sdk/). The left panels depict azimuth and elevation for the left eye. Right panels depict azimuth and elevation for the right eye. Top panels represent the 2D-histogram of gaze directions during fixations, where brighter colors indicate a higher frequency of occurrence. Bottom panels depict the same histograms, but depicted as a 3D view. All fixations from all participants were pooled for this figure. Per-participant analyses of gaze direction yield the same pattern; only the maximum of the histogram is shifted slightly per participant
Fig. 10
Fig. 10
Threshold for fixation classification as a function of time for one example recording. The red line depicts the velocity threshold determined using a moving window technique as was used for the data analysis in the present study. The black line depicts the velocity threshold determined without using a moving window as has been used in previous work (Hooge & Camps, 2013)
Fig. 11
Fig. 11
Example eye-tracking data with fixation-classification results for a 10-s episode of one recording. a Horizontal gaze position in pixels of the scene camera video. The parts marked in red represent the fixations that were classified by our moving window technique. b Vertical gaze position in pixels of the scene camera video. The parts marked in red represent the fixations that were classified by our moving window technique. c Gaze velocity in pixels per ms. The parts marked in red represent the fixations that were classified by our moving window technique. d Fixations classified with (marked in red) and without (marked in black) the moving window technique. The fixations classified without the moving window technique were obtained by determining one velocity threshold based on the gaze velocities obtained during the entire recording

References

    1. Argyle, M. (1972). Eye-contact and the direction of gaze. In The psychology of interpersonal behavior. Harmondsworth: Penguin Books.
    1. Atkinson, A.P., Heberlein, A.S., & Adolphs, R. (2011). Are people special? A brain’s eye view. In R.B. Adams, N. Ambady, K. Nakayama, & S. Shimojo (Eds.) The science of social vision. Oxford: Oxford University Press.
    1. Benjamins, J.S., Hessels, R.S., & Hooge, I.T.C. (2018). GazeCode: Open-source software for manual mapping of mobile eye-tracking data. In ETRA ’18: 2018 symposium on eye tracking research and applications (pp. 1–4). New York: ACM Press.
    1. Berton, F., Hoyet, L., Olivier, A.-H., & Pettré, J. (2018). Gaze behaviour during collision avoidance between walkers: A preliminary study to design an experimental platform. VH-CIE@IEEEVR - IEEE virtual humans and crowds for immersive environments, the IEEE conference on virtual reality, pp. 1–5.
    1. Bindemann M, Burton AM, Hooge ITC, Jenkins R, de Haan EHF. Faces retain attention. Psychological Bulletin & Review. 2005;12(6):1048–1053. - PubMed

LinkOut - more resources