. 2020 Mar;24(5):3091-3107.
doi: 10.1111/jcmm.14971. Epub 2020 Jan 28.

Novel mitochondrion-targeting copper(II) complex induces HK2 malfunction and inhibits glycolysis via Drp1-mediating mitophagy in HCC

Affiliations

Novel mitochondrion-targeting copper(II) complex induces HK2 malfunction and inhibits glycolysis via Drp1-mediating mitophagy in HCC

Mengmeng Li et al. J Cell Mol Med. 2020 Mar.

Abstract

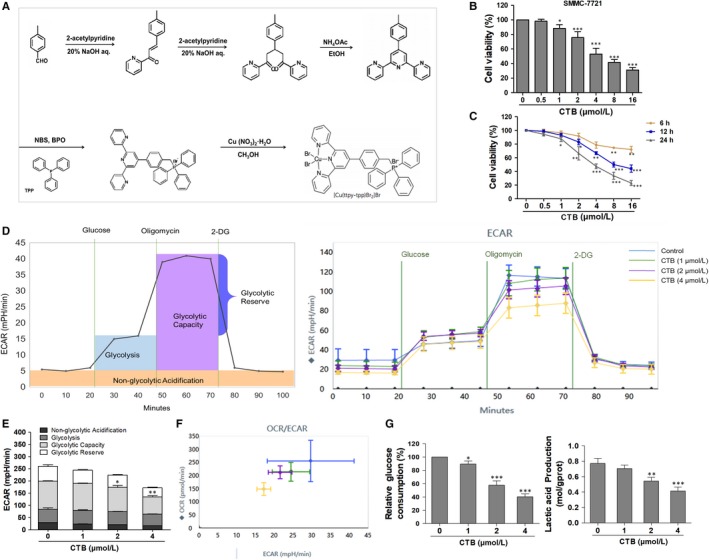
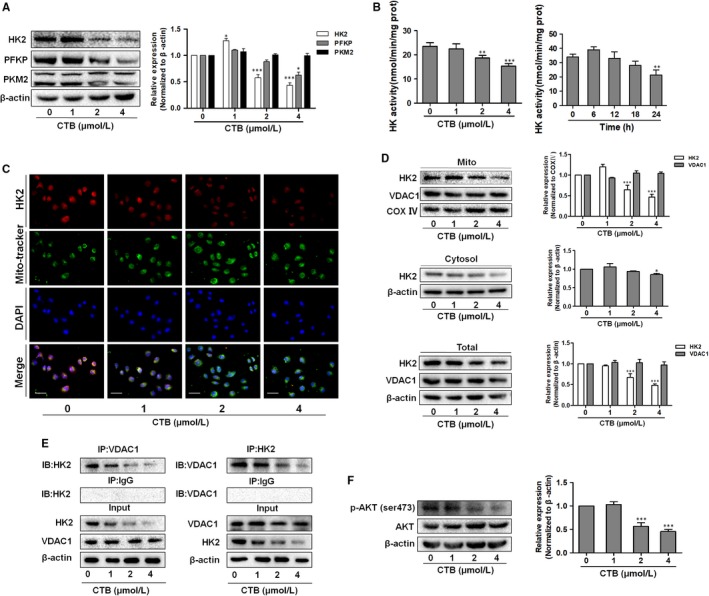
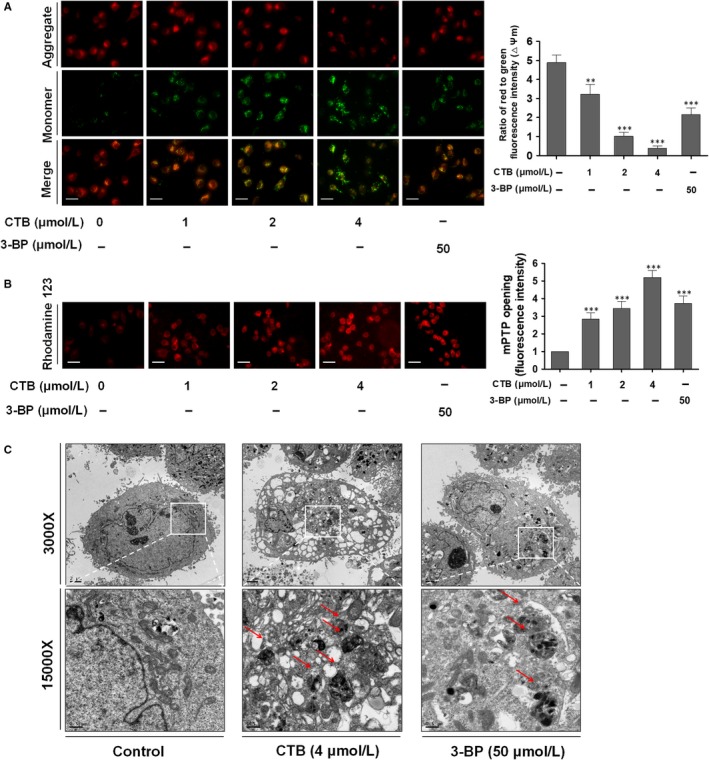
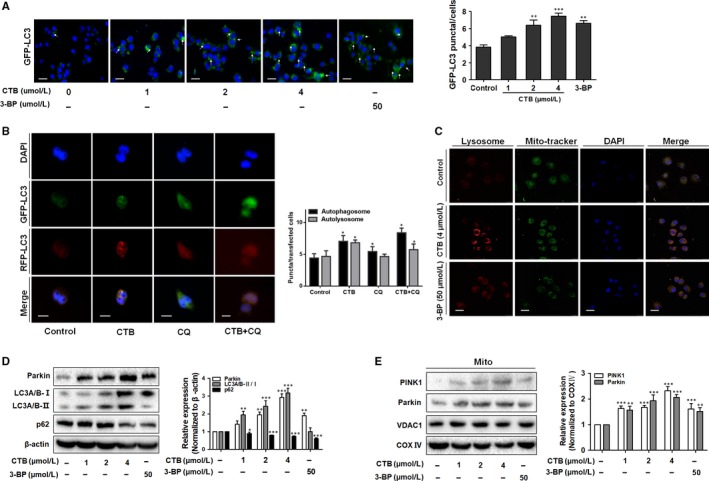
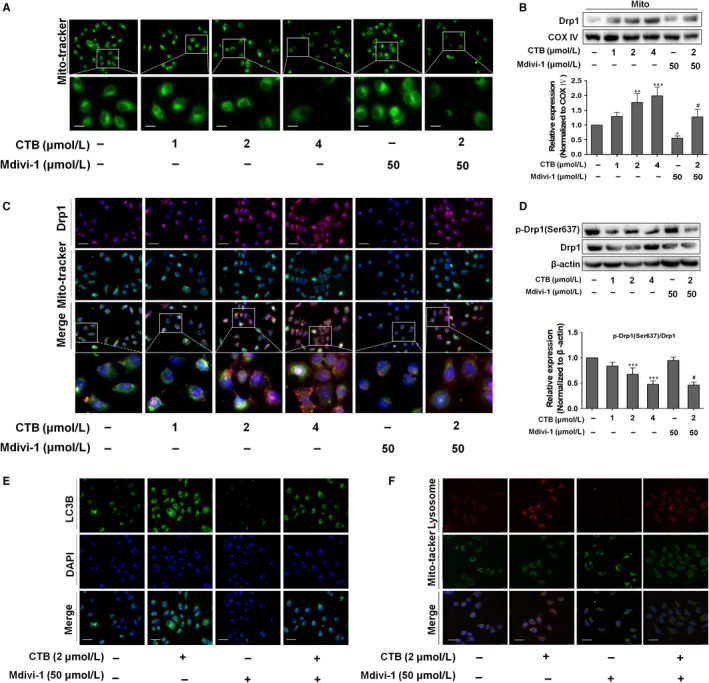
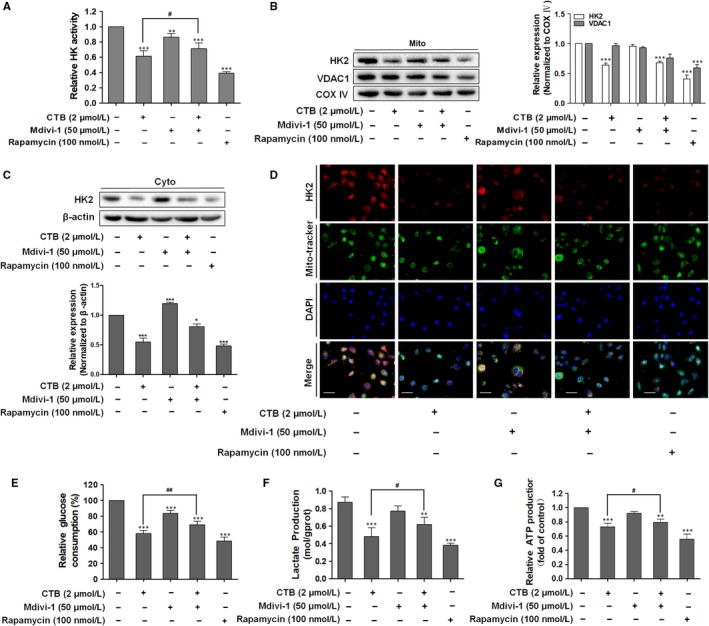
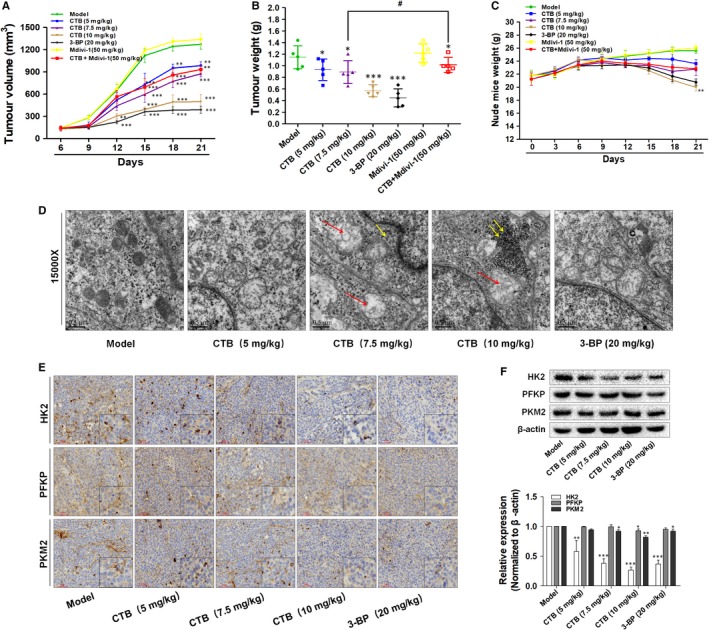
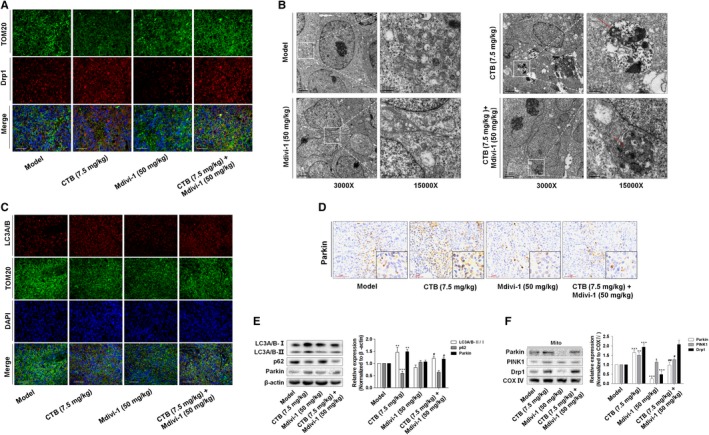
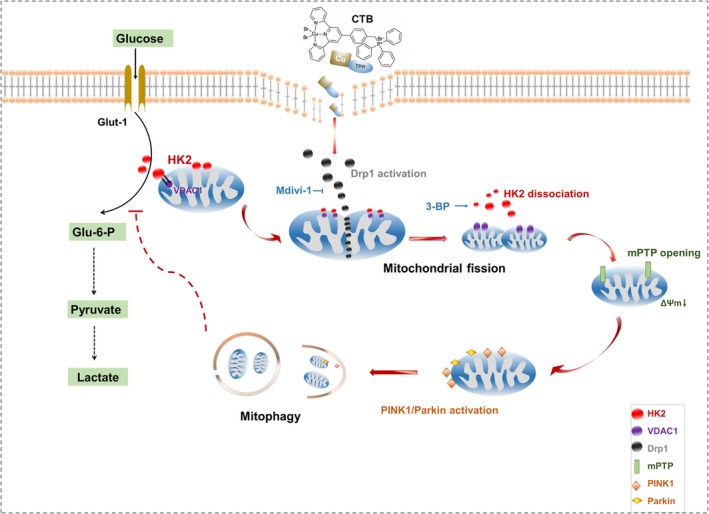
[Cu(ttpy-tpp)Br2 ]Br (abbreviated as CTB) is a novel mitochondrion-targeting copper(II) complex synthesized by our research group, which contains tri-phenyl-phosphonium (TPP) groups as its lipophilic property. In this study, we explored how CTB affects mitochondrial functions and exerts its anti-tumour activity. Multiple functional and molecular analyses including Seahorse XF Bioanalyzer Platform, Western blot, immunofluorescence analysis, co-immunoprecipitation and transmission electron microscopy were used to elucidate the underlying mechanisms. Human hepatoma cells were subcutaneously injected into right armpit of male nude mice for evaluating the effects of CTB in vivo. We discovered that CTB inhibited aerobic glycolysis and cell acidification by impairing the activity of HK2 in hepatoma cells, accompanied by dissociation of HK2 from mitochondria. The modification of HK2 not only led to the complete dissipation of mitochondrial membrane potential (MMP) but also promoted the opening of mitochondrial permeability transition pore (mPTP), contributing to the activation of mitophagy. In addition, CTB co-ordinately promoted dynamin-related protein 1 (Drp1) recruitment in mitochondria to induce mitochondrial fission. Our findings established a previously unrecognized role for copper complex in aerobic glycolysis of tumour cells, revealing the interaction between mitochondrial HK2-mediated mitophagy and Drp1-regulated mitochondrial fission.

Keywords: copper complex; dynamin-related protein 1; glycolysis; hexokinase 2; mitophagy.


Conflict of interest statement

The authors declare no potential conflicts of interest.

Figures

Figure 1
Figure 1
[Cu(ttpy‐tpp)Br2]Br (CTB) inhibited cells viability and repressed glycolysis in HCC cells. (A) The tripyridine ligand (ttpy) was synthesized first, and the TPP was introduced to synthesize the ligand ttpy‐tpp, and then, the coordination reaction with Cu (II) was carried out, and the product [Cu(ttpy‐tpp)Br2]Br was purified. (B) SMMC‐7721 cells were treated with concentrations of CTB (0, 0.5, 1, 2, 4, 8 and 16 μmol/L), and cells viability was determined by the MTT assay. (C) SMMC‐7721 cells were treated with concentrations of CTB (0, 0.5, 1, 2, 4, 8 and 16 μmol/L) at different time (6, 12, 24 h). (D) Measurement of extracellular acidification rate (ECAR) using the XFe24 Extracellular Flux Analyzer. (E) Glycolytic variations (glycolysis, glycolytic capacity and glycolytic reserve) were summarized from raw data. (F) Metabolic phenotypes were assessed by the ratio of OCR/ECAR. (G) Glucose consumption was detected using a glucose assay kit. Production of lactic acid was assayed by Lactic Acid Production Detection kit. Data were presented as mean ± SD (n = 5); significance: *P < .05, **P < .01 and ***P < .001 vs control
Figure 2
Figure 2
CTB inhibited the expression of HK2 and promoted dissociation of hexokinase 2 from the mitochondria. SMMC‐7721 cells were treated with indicated concentrations of CTB (0, 1, 2 and 4 μmol/L). (A) Protein levels of HK2, PFKP and PKM2 were measured by Western blot analysis. (B) HK activity was detected via Hexokinase Activity Detection Kit at different time (0, 6, 12, 18, 24 h). (C) Representative fluorescence microscope images of SMMC‐7721 cells labelled with DAPI, HK2 antibody and Mito‐Tracker Green. Scale bar: 50 μm. (D) Mitochondrial and cytosolic fractions were isolated and subjected to Western blot analysis for the expression of HK2. (E) Immunoprecipitation assay showed the interaction of HK2 and VDAC1. (F) Protein levels of p‐AKT and AKT were measured by Western blot analysis. Data were presented as mean ± SD (n = 3); significance: *P < .05, **P < .01 and ***P < .001 vs control
Figure 3
Figure 3
mPTP opening was induced by HK2 separation from mitochondria. SMMC‐7721 cells were treated with indicated concentrations of CTB (0, 1, 2 and 4 μmol/L) or 3‐BP (50 μmol/L) for 24 h. (A) The mitochondrial membrane potential (ΔΨm) was measured by JC‐1 staining. Scale bar: 50 μm. (B) mPTP opening was viewed by Rhodamine 123. Scale bar: 50 μm. (C) Observation of mitochondrial structure by transmission electron microscopy
Figure 4
Figure 4
Mitophagy was activated by mPTP opening that induced by HK2 separation from mitochondria. (A) Cells expressing GFP‐LC3 were plated in complete media that was replaced with either CTB or 3‐BP for 24 h and analysed for LC3 dots. Scale bar: 100 μm. (B) Cells were transiently transfected with tandem fluorescent mRFP‐GFP‐tagged LC3 plasmid (RFP‐GFP‐LC3). Scale bar: 2 μm. (C) Representative images of colocalization of lysosomes and mitochondria using Mito‐Tracker Red and Lyso‐Tracker green staining. Scale bar: 20 μm. (D) Western blot analysis showed the protein expression of LC3A/B‐Ⅰ/Ⅱ and p62. (E) Western blot analysis showed the protein expression of Pakin and PINK1. Data were presented as mean ± SD (n = 3); significance: *P < .05, **P < .01 and ***P < .001 vs control
Figure 5
Figure 5
CTB induced mitochondrial fission via the regulation of Drp1, contributing to the mitophagy and disruption of mitochondrial structure. SMMC‐7721 cells were treated with indicated concentrations of CTB (0, 1, 2 and 4 μmol/L) or Mdivi‐1(50 μmol/L) for 24 h. (A) Mitochondrial fission was detected by Mito‐Tracker Green with fluorescence microscope. The boxed area under each micrograph was enlarged to determine mitochondria fragmentation. Scale bar: 10 μm. (B) Drp1 expression in mitochondria fraction was analysed by Western blot analysis. (C) Immunostaining showed the activation and location of Drp1 in SMMC‐7721 cells labelled with DAPI, Drp1 antibody and Mito‐Tracker Green. Scale bar: 50 μm. (D) Protein levels of p‐Drp1 and Drp1 were measured by Western blot analysis. Scale bar: 50 μm. (E) SMMC‐7721 cells expressing GFP‐LC3 were plated in complete media that was replaced with either CTB (4 μmol/L) or Mdivi‐1 (50 μmol/L) for 24 h and analysed for LC3 dots. Scale bar: 50 μm. (F) Representative images of colocalization of lysosomes and mitochondria. Scale bar: 25 μm. Data were presented as mean ± SD (n = 3); significance: *P < .05, **P < .01 and ***P < .001 vs control; # P < .05, ## P < .01 and ### P < .001 vs CTB treatment
Figure 6
Figure 6
The Drp1‐dependent fission and mitophagy facilitated HK2 separation from the mitochondria and the inhibition of glycolysis. SMMC‐7721 cells were treated with indicated concentrations of CTB (0, 1, 2 and 4 μmol/L), Mdivi‐1 (50 μmol/L) or rapamycin (100 nmol/L) for 24 h. (A) HK activity was detected by Hexokinase Activity Detection Kit. (B‐C) Mitochondrial and cytosolic fractions were isolated. Western blot analysis showed the protein expression of HK2. (D) Representative fluorescence microscope images of SMMC‐7721 cells labelled with DAPI, HK2 antibody and Mito‐Tracker Green. Scale bar: 50 μm. (E) Glucose consumption was detected by glucose assay kit. (F) Production of lactic acid was assayed by Lactic Acid Production Detection kit. (G) ATP content was detected by the ATP Assess Kit. Data were presented as mean ± SD (n = 5); significance: *P < .05, **P < .01 and ***P < .001 vs control; # P < .05, ## P < .01 and ### P < .001vs CTB treatment
Figure 7
Figure 7
CTB inhibits the growth of HCC xenograft tumour in vivo. Nude mice with HCC cells xenograft were randomly divided into groups when tumour volume reached 150 mm3. (A) Tumour volumes were measured every three days and calculated using the formula: length × width2 × 0.5. (B) Tumour weights comparison, obtained on the final day of sacrifice in mice. (C) Body weights were recorded every three days. (D) Observation of tissues by transmission electron microscopy. swollen mitochondria (red arrow); accumulation of glycogen (yellow arrow). Scale bar: 0.5 μm. (E) Tumour tissues were subjected to immunohistochemistry staining with indicated antibodies to detect the change of HK2, PFKP and PKM2. Scale bar: 50 μm. (F) Western blot analysis showed the protein expression of HK2, PFKP and PKM2. Data were presented as mean ± SD (n = 8); significance: *P < .05, **P < .01 and ***P < .001 vs model; # P < .05, ## P < .01 and ### P < .001 vs CTB treatment
Figure 8
Figure 8
CTB‐regulated mitochondrial fission was closely related to the mitophagy in vivo. (A) Image of mitochondria and Drp1 colocalization were viewed with fluorescence microscope (Blue: DAPI; Green: TOM20; Red: Drp1). Scale bar: 100 μm. (B) Observation of mitophagy by transmission electron microscopy. Autophagosome (red arrow). Scale bar: 0.5 or 2 μm. (C) The detection of LC3A/B activation by fluorescence microscopy (Blue: DAPI; Green: TOM20; Red: LC3A/B). Scale bar: 100 μm. (D) Immunohistochemical analysis of Parkin in tumour tissues. Scale bar: 50 μm. (E) Western blot analysis showed the protein expression of LC3A/B, p62 and Parkin. (F) Western blot analysis showed the protein expression of Drp1, Parkin and PINK1 in mitochondrial debris of tumour tissue. Data were presented as mean ± SD (n = 8); significance: *P < .05, **P < .01 and ***P < .001 vs model; # P < .05, ## P < .01 and ### P < .001 vs CTB treatment
Figure 9
Figure 9
Schematic diagram of the damage mechanism of CTB on mitochondrial function and glycolysis in hepatoma cells

References

    1. Zong WX, Rabinowitz JD, White E. Mitochondria and cancer. Mol Cell. 2016;61:667‐676. - PMC - PubMed
    1. Ribas V, Garcia‐Ruiz C, Fernandez‐Checa JC. Mitochondria, cholesterol and cancer cell metabolism. Clin Transl Med. 2016;5:22. - PMC - PubMed
    1. Beyoglu D, Imbeaud S, Maurhofer O, et al. Tissue metabolomics of hepatocellular carcinoma: tumor energy metabolism and the role of transcriptomic classification. Hepatology. 2013;58:229‐238. - PMC - PubMed
    1. Lee M, Yoon JH. Metabolic interplay between glycolysis and mitochondrial oxidation: The reverse Warburg effect and its therapeutic implication. World J Biol Chem. 2015;6:148‐161. - PMC - PubMed
    1. Thamrongwaranggoon U, Seubwai W, Phoomak C, et al. Targeting hexokinase II as a possible therapy for cholangiocarcinoma. Biochem Biophys Res Comm. 2017;484:409‐415. - PubMed

Publication types

MeSH terms