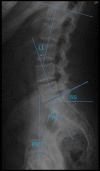
Analysis of the Relationship Between Modic Change and Spinopelvic Parameters in the Sagittal Plane
- PMID: 31994493
- PMCID: PMC7003667
- DOI: 10.12659/MSM.919667
Analysis of the Relationship Between Modic Change and Spinopelvic Parameters in the Sagittal Plane
Abstract
BACKGROUND This study explored relationship between Modic change and spinopelvic parameters in the sagittal plane. MATERIAL AND METHODS We divided 80 patients into 4 groups: 60 subjects diagnosed with Modic changes (MC) were enrolled in the MC groups (MC1, MC2, and MC3) with each MC type consisting of 20 subjects, and 60 healthy subjects were enrolled in the control group. Spinopelvic parameters in the sagittal plane were calculated to assess their associations with MC. Multivariate logistic regression was used to explore possible risk factors for MC. RESULTS PI and LL in the MC groups were significant smaller than in the control group (p<0.05). PI, SS, and PT were significantly correlated with LL with a correlation coefficient of 0.75PI, 0.71SS and 0.69PT (p<0.05). Multivariate logistic regression of the significant variables showed that PI (less than 43.2°) is an independent significant risk factor for MC. ROC analysis showed that moderate diagnostic value was obtained for the significant variable, with an area under the curve (AUC) of 0.80 (p>0.05). CONCLUSIONS We concluded that PI is risk factor for MC, and smaller PI is associated with higher incidence of MC.
Figures


Similar articles
-
Relationship Between Modic Changes and Sagittal Balance Parameters in the Cervical Spine.Med Sci Monit. 2018 Sep 2;24:6102-6106. doi: 10.12659/MSM.909773. Med Sci Monit. 2018. PMID: 30173243 Free PMC article.
-
The impact of spinopelvic morphology on the short-term outcome of pedicle subtraction osteotomy in 104 patients.J Neurosurg Spine. 2017 Jul;27(1):74-80. doi: 10.3171/2016.11.SPINE16601. Epub 2017 Apr 28. J Neurosurg Spine. 2017. PMID: 28452632
-
Comparison of sagittal spinopelvic alignment in Chinese adolescents with and without idiopathic thoracic scoliosis.Spine (Phila Pa 1976). 2012 May 20;37(12):E714-20. doi: 10.1097/BRS.0b013e3182444402. Spine (Phila Pa 1976). 2012. PMID: 22166928
-
Spinopelvic Compensatory Mechanisms for Reduced Hip Motion (ROM) in the Setting of Hip Osteoarthritis.Spine Deform. 2019 Nov;7(6):923-928. doi: 10.1016/j.jspd.2019.03.007. Spine Deform. 2019. PMID: 31732003 Review.
-
Relationship Between Lumbar Lordosis and Pelvic Incidence in the Adolescent Patient: Normal Cohort Analysis and Literature Comparison.Spine Deform. 2018 Sep-Oct;6(5):529-536. doi: 10.1016/j.jspd.2018.02.002. Spine Deform. 2018. PMID: 30122388 Review.
Cited by
-
The role of pelvic coronal parameters in determining sagittal balance: a prospective radiographic analysis of pelvic spinopelvic alignment in Chinese asymptomatic Han adolescents.Front Pediatr. 2025 Apr 14;13:1565338. doi: 10.3389/fped.2025.1565338. eCollection 2025. Front Pediatr. 2025. PMID: 40297555 Free PMC article.
-
Correlation between sagittal balance and thoracolumbar elastic energy parameters in 42 spines subject to spondylolisthesis or spinal stenosis and 21 normal spines.Heliyon. 2024 Sep 26;10(19):e38469. doi: 10.1016/j.heliyon.2024.e38469. eCollection 2024 Oct 15. Heliyon. 2024. PMID: 39430542 Free PMC article.
-
The triadic relationship between spinal posture, loading, and degeneration.Front Bioeng Biotechnol. 2025 Mar 18;13:1444540. doi: 10.3389/fbioe.2025.1444540. eCollection 2025. Front Bioeng Biotechnol. 2025. PMID: 40171041 Free PMC article.
-
Study and analysis of the correlation between lumbar spondylolisthesis and Modic changes.Front Surg. 2024 Feb 7;11:1296275. doi: 10.3389/fsurg.2024.1296275. eCollection 2024. Front Surg. 2024. PMID: 38384739 Free PMC article.
-
Correlation of Modic Changes with Sagittal Lumbopelvic Parameters.J Pain Res. 2021 Dec 19;14:3877-3885. doi: 10.2147/JPR.S345098. eCollection 2021. J Pain Res. 2021. PMID: 34984029 Free PMC article.
References
-
- Costanzo G, Zoccali C, Maykowski P, et al. The role of minimally invasive lateral lumbar interbody fusion in sagittal balance correction and spinal deformity. Eur Spine J. 2013;23(Suppl 6):699–704. - PubMed
-
- Manwaring JC, Bach K, Ahmadian AA, et al. Management of sagittal balance in adult spinal deformity with minimally invasive anterolateral lumbar interbody fusion: A preliminary radiographic study. J Neurosurg Spine. 2014;20:515–22. - PubMed
-
- Modic MT, Masaryk TJ, Ross JS, et al. Imaging of degenerative disk disease. Radiology. 1988;168:177–86. - PubMed
-
- Modic MT, Steinberg PM, Ross JS, et al. Degenerative disk disease: Assessment of changes in vertebral body marrow with MR imaging. Radiology. 1988;166:193–99. - PubMed
MeSH terms
LinkOut - more resources
Full Text Sources
Research Materials
Miscellaneous

