

Brain MRI Predicts Worsening Multiple Sclerosis Disability over 5 Years in the SUMMIT Study
- PMID: 31994814
- PMCID: PMC7194808
- DOI: 10.1111/jon.12688
Brain MRI Predicts Worsening Multiple Sclerosis Disability over 5 Years in the SUMMIT Study
Abstract
Background and purpose: Brain MRI-derived lesions and atrophy are related to multiple sclerosis (MS) disability. In the Serially Unified Multicenter MS Investigation (SUMMIT), from Brigham and Women's Hospital (BWH) and University of California, San Francisco (UCSF), we assessed whether MRI methodologic heterogeneity may limit the ability to pool multisite data sets to assess 5-year clinical-MRI associations.
Methods: Patients with relapsing-remitting (RR) MS (n = 100 from each site) underwent baseline brain MRI and baseline and 5-year clinical evaluations. Patients were matched on sex (74 women each), age, disease duration, and Expanded Disability Status Scale (EDSS) score. MRI was performed with differences between sites in both acquisition (field strength, voxel size, pulse sequences), and postprocessing pipeline to assess brain parenchymal fraction (BPF) and T2 lesion volume (T2LV).
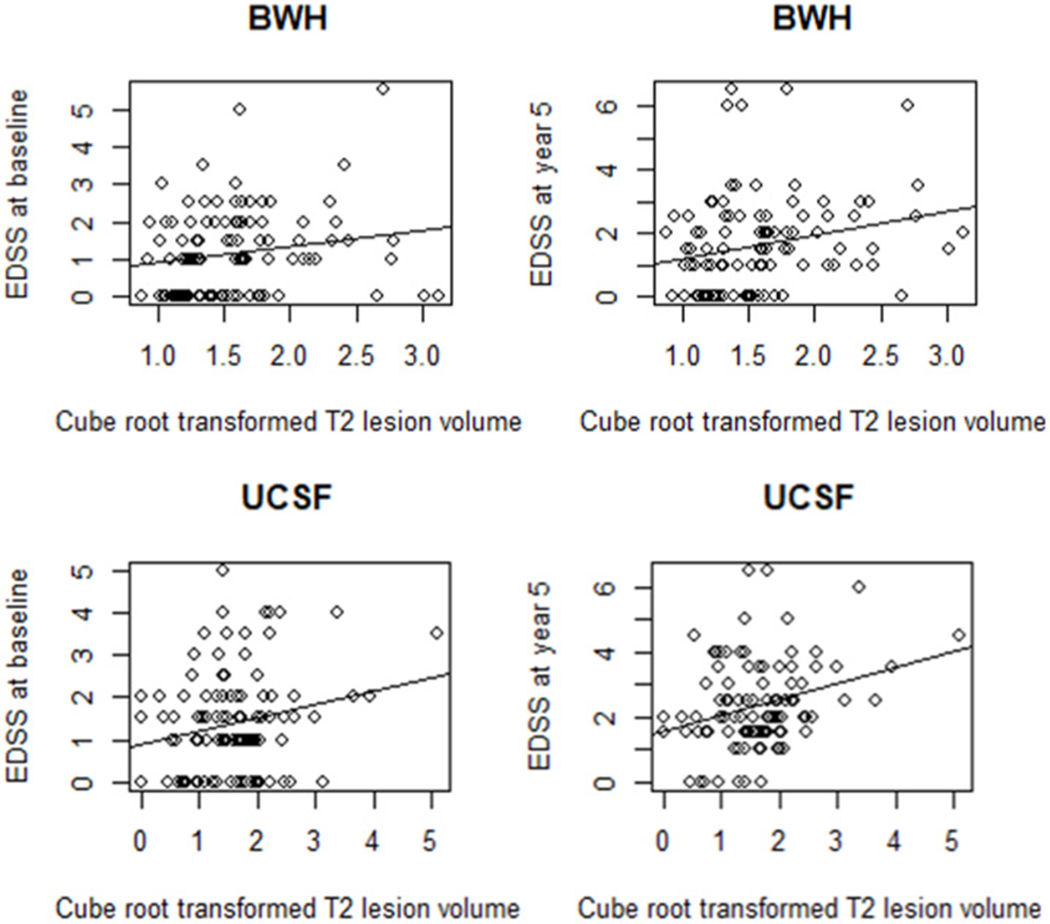
Results: The UCSF cohort showed higher correlation than the BWH cohort between T2LV and disease duration. UCSF showed a higher inverse correlation between BPF and age than BWH. UCSF showed a higher inverse correlation than BWH between BPF and 5-year EDSS score. Both cohorts showed inverse correlations between BPF and T2LV, with no between-site difference. The pooled but not individual cohort data showed a link between a lower baseline BPF and the subsequent 5-year worsening in disability in addition to other stronger relationships in the data.
Conclusions: MRI acquisition and processing differences may result in some degree of heterogeneity in assessing brain lesion and atrophy measures in patients with MS. Pooling of data across sites is beneficial to correct for potential biases in individual data sets.
Keywords: MRI; Multiple sclerosis; brain; disability; multicenter study; neuroimaging.
© 2020 by the American Society of Neuroimaging.
Figures

References
-
- Ceccarelli A, Bakshi R, Neema M. MRI in multiple sclerosis: a review of the current literature. Curr Opin Neurol 2012;25:402–9. - PubMed
-
- Tauhid S, Neema M, Healy BC, Weiner HL, Bakshi R. MRI phenotypes based on cerebral lesions and atrophy in patients with multiple sclerosis. J Neurol Sci 2014;346:250–4. - PubMed
