. 2020 Jan 29:9:e51493.
doi: 10.7554/eLife.51493.

Bacterial interspecies interactions modulate pH-mediated antibiotic tolerance

Affiliations

Bacterial interspecies interactions modulate pH-mediated antibiotic tolerance

Andrés Aranda-Díaz et al. Elife. .

Abstract

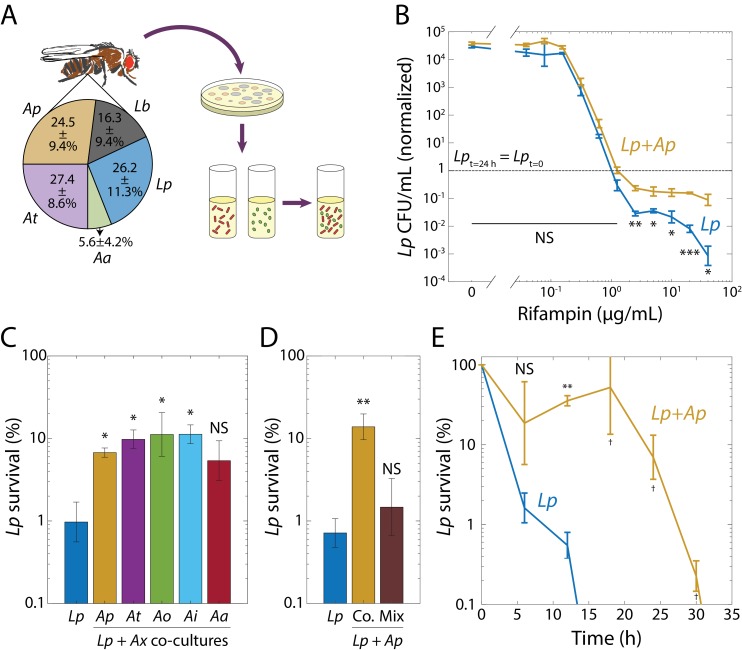
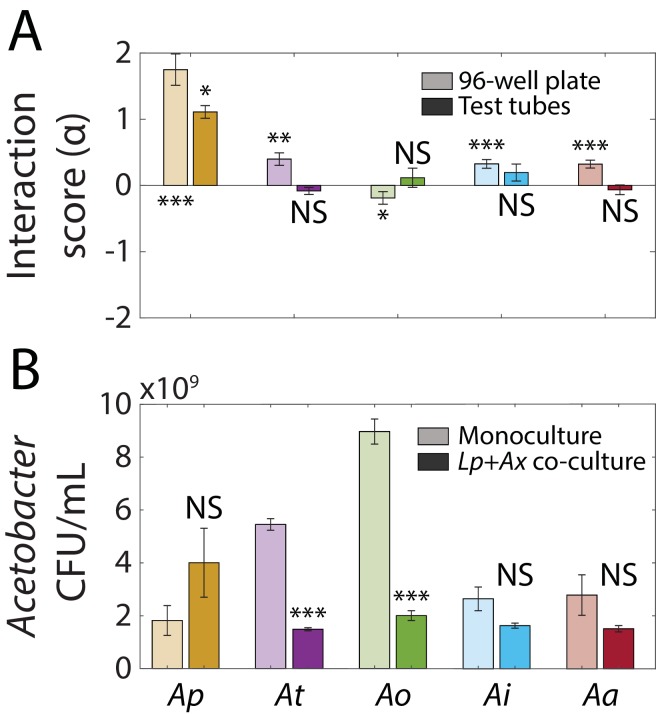
Predicting antibiotic efficacy within microbial communities remains highly challenging. Interspecies interactions can impact antibiotic activity through many mechanisms, including alterations to bacterial physiology. Here, we studied synthetic communities constructed from the core members of the fruit fly gut microbiota. Co-culturing of Lactobacillus plantarum with Acetobacter species altered its tolerance to the transcriptional inhibitor rifampin. By measuring key metabolites and environmental pH, we determined that Acetobacter species counter the acidification driven by L. plantarum production of lactate. Shifts in pH were sufficient to modulate L. plantarum tolerance to rifampin and the translational inhibitor erythromycin. A reduction in lag time exiting stationary phase was linked to L. plantarum tolerance to rifampicin, opposite to a previously identified mode of tolerance to ampicillin in E. coli. This mechanistic understanding of the coupling among interspecies interactions, environmental pH, and antibiotic tolerance enables future predictions of growth and the effects of antibiotics in more complex communities.

Keywords: Drosophila melanogaster; Lactobacillus plantarum; antibiotic tolerance; ecology; gut microbiota; infectious disease; interspecies interactions; microbiology; rifampin.


Conflict of interest statement

AA, BO, RD, TT, ZH, ZG, WL, KH No competing interests declared

Figures

Figure 1.
Figure 1.. Interspecies interactions in synthetic communities derived from the fruit fly gut microbiome induce rifampin tolerance.
(A) Synthetic community construction scheme. Relative abundances of the dominant species in the D. melanogaster gut microbiome determined from 16S rRNA sequencing. All reads mapped to two Lactobacillus species: L. plantarum (Lp) and L. brevis (Lb), and to three Acetobacter species: A. pasteurianus (Ap), A. tropicalis (At), and A. aceti (Aa). Values are mean ± standard deviation (S.D.), n = 18. Mean and S.D. were weighed by the total number of reads for each fly. Strains were isolated in agar plates and grown in liquid culture. Synthetic communities were then built by co-culturing individual species in liquid culture. (B) When grown with Ap, Lp survived after 24 h at rifampin concentrations above the MIC. Viable cell plating counts of Lp after growth in rifampin for 24 h normalized to the counts at the start of the experiment (t = 0, 3 × 105 and 4 × 105 CFU/mL in monoculture and co-culture, respectively). Dashed line indicates where the population at t = 24 h would have the same size as at t = 0. Error bars are S.D. for each condition, n = 3. p-values are from a Student’s two-sided t-test of the difference of the co-culture from the monoculture (*: p<4×10⁻³, **: p<8×10⁻⁴, ***: p<8×10⁻⁵, equivalent to *: p<0.05/n, **: p<0.01/n, ***: p<1×10⁻³/n, where n = 12 is the number of comparisons; NS: not significant). (C) Protection of Lp at supra-MIC concentrations of rifampin is elicited by all Acetobacter species tested. CFU/mL of Lp grown in monoculture (Lp) or in co-culture with Ap, AtAorientalis (Ao), A. indonesiensis (Ai), and Aa, and then treated with 20 µg/mL rifampin for 24 h normalized to counts at the start of the experiment (t = 0). Error bars are S.D. for each condition, n = 3. p-values are from a Student’s two-sided t-test of the difference from the monoculture (*: p<0.01, equivalent to *: p<0.05/n, where n = 5 is the number of comparisons; NS: not significant). (D) Ap-mediated survival of Lp at rifampin concentrations above the MIC is history-dependent, requiring co-culturing before exposure as compared with mixing. CFU/mL of Lp grown in monoculture, in co-culture with Ap (Co.), or mixed with Ap without subsequent growth in the absence of antibiotic (Mix), and treated with 20 µg/mL rifampin for 24 h normalized to counts at the start of the experiment (t = 0). Error bars are S.D. for each condition, n = 3. p-vValues are from a Student’s two-sided t-test of the difference from the monoculture (**: p<5×10⁻³, equivalent to **: p<0.01/n, where n = 2 is the number of comparisons; NS: not significant). (E) The time to killing of Lp under rifampin treatment is extended in the presence of an Acetobacter. CFU/mL of Lp grown in monoculture and co-cultured with Ap, and treated with 50 µg/mL rifampin, normalized to counts at the start of the experiment (t = 0). Error bars are S.D. for each condition, n = 3. p-values are from a Student’s two-sided t-test of the difference from the monoculture at the corresponding timepoint (**: p<2×10⁻³, equivalent to **: p<0.01/n, where n = 5 is the number of comparisons; : measurement below limit of detection; NS: not significant). Values off the graph were below the limit of detection of the assay.
Figure 1—figure supplement 1.
Figure 1—figure supplement 1.. Growth curves of monocultures of the primary species in the fruit fly gut microbiota measured with a plate reader (Materials and methods).
Data were normalized by the initial OD (t = 0) for each curve. Lactobacillus plantarum, Lp; L. brevis, Lb; Acetobacter pasteurianus, Ap; and A. tropicalis, At. Shaded regions are standard deviation, n = 16. Data points were taken every 8.3 min.
Figure 1—figure supplement 2.
Figure 1—figure supplement 2.. Changes in the survivability of Lactobacillus plantarum (Lp) when co-cultured with Acetobacter pasteurianus (Ap) are not due to increased survivability of Ap, inoculum size, or Lp growth in rifampin.
(A) Ap has similar MICs in monoculture and in co-culture with Lp, and dies at supraMIC concentrations. Viable cell plating counts of Ap after growth in rifampin for 48 h were normalized to counts at the start of the experiment (t = 0, 5 × 105 and 1.3 × 105 CFU/mL in monoculture and co-culture, respectively) to highlight the concentration at which growth is completely inhibited. Note that the monoculture experiences partial growth inhibition at a lower concentration than the co-culture, and that in the absence of antibiotic, Ap grows more in co-culture with Lp than as a monoculture. Error bars are standard deviation (S.D.) for each condition, n = 3. The highest concentration of rifampin tested was 40 µg/mL. b) Inoculum size did not change the MIC of rifampin in Lp monocultures. Viable cell plating counts of Lp after growth in rifampin for 48 h were determined from different initial cell densities (numbers in colors, CFU/mL at t = 0). Error bars are S.D. for each condition, n = 3. (C) Inoculum size did not change the survivability of Lp to supraMIC concentrations of rifampin. Viable cell plating counts of Lp after growth in rifampin for 48 h were normalized to the initial cell density (t = 0), same data as in (B). Error bars are S.D. for each condition, n = 3. (D) Single-cell imaging demonstrated that Ap-induced tolerance of Lp was not due to growth under rifampin treatment. Representative phase-microscopy images of Lp in monoculture and co-cultured with Ap on an MRS agar pad containing 50 µg/mL rifampin.
Figure 2.
Figure 2.. Lp growth during stationary phase in Acetobacter co-cultures is associated with an increase in pH and a decrease in lactate concentration.
(A) Co-culturing Lp with Ap, At, or Ai resulted in increased Lp cell density after 48 hr. Co-culturing with Ao or Aa did not significantly increase Lp cell density by 48 hr. Error bars are standard deviation (S.D.) for each condition, n = 3. p-values are from a Student’s two-sided t-test of the difference from the monoculture (*: p<0.01, **: p<2×10⁻³, equivalent to *: p<0.05/n, **: p<0.01/n, where n = 5 is the number of comparisons; NS: not significant). (B) Co-culturing Lp with Ap resulted in higher Lp cell density in stationary phase, as well as faster growth and shorter lag for Ap. Shaded regions indicate S.D., n = 3. Inset: zoom-in on region inside dashed box highlighting increase in carrying capacity in co-culture. (C) L- and D-lactate accumulated to much higher levels in Lp monocultures than in co-cultures after 48 h of growth, suggesting that Acetobacter spp. consumed Lp-produced lactate. Lactate concentration was measured enzymatically from culture supernatants at 48 hr. Error bars are S.D. for each condition, n = 3. p-values are from a Student’s two-sided t-test of the difference from the monoculture (**: p<2×10⁻³, ***: p<2×10⁻⁴, equivalent to **: p<0.01/n, ***: p<1×10⁻³/n, where n = 5 is the number of comparisons; : measurement below limit of detection). (D) The increase in Lp cell density in stationary phase is associated with an Acetobacter-dependent increase in pH early in stationary phase. pH was measured with the pH-sensitive dye 2’,7-bis-(2-carboxyethyl)−5-(and-6)-carboxyfluorescein over time (Materials and methods). Shaded regions indicate S.D., n = 3. Data points were taken every 8.3 min.
Figure 2—figure supplement 1.
Figure 2—figure supplement 1.. Interaction scores of Lactobacillus plantarum (Lp) and Acetobacter spp.
(A) Interaction score for Lp and Acetobacter spp. calculated using OD (Equation 1) measured after 48 h of growth in a 96-well plate (light colors) or in test tubes (dark colors). Error bars indicate standard deviation (S.D.), n = 5 for 96-well plates, n = 3 for test tubes. P-values are from a Student’s two-sided t-test of the hypothesis that the score is 0 using the mean OD of individual samples (monocultures and co-cultures) to calculate the mean and S.D. by propagation of error (*: p<5×10⁻³, **: p<1×10³, ***: p<1×10⁻⁴, equivalent to *: p<0.05/n, **: p<0.01/n, ***: p<1×10⁻³/n, where = 10 is the number of comparisons). (B) Co-culturing with Lp did not significantly increase Ap cell density, but did significantly decrease At and Ao cell densities after 48 hr. Error bars are S.D. for each condition, n = 3. p-values are from a Student’s two-sided t-test of the difference from the monoculture (***: p<2×10⁻⁴, equivalent to ***: p<1×10⁻³/n, where n = 5 is the number of comparisons).
Figure 2—figure supplement 2.
Figure 2—figure supplement 2.. Lactate accumulates in L. plantarum (Lp) monocultures and co-cultures, and Acetobacter-driven consumption of lactate reverses the initial pH decrease.
(A) Lactate is accumulated in Lp monocultures and in co-cultures with Ap, Ao and Aa before entering stationary phase. L- and D-lactate concentration was measured enzymatically from the supernatants of 20 h monocultures of Lp or co-cultures of Lp with Acetobacter species (Materials and methods). Error bars are standard deviation (S.D.) for each condition, n = 3. p-values are from a Student’s two-sided t-test of the difference from the monoculture (**: p<3×10⁻³, ***: p<3×10⁻⁴, equivalent to **: p<0.01/n, ***: p<1×10⁻³/n, where n = 3 is the number of comparisons). (B) pH in stationary phase of co-cultures of Lp is higher than monoculture. pH meter readings (Materials and methods) of saturated Lp monocultures and co-cultures with Acetobacter species. Error bars are S.D. for each condition, n = 3. p-values are from a Student’s two-sided t-test of the difference from the monoculture (***: p<2×10⁻⁴, equivalent to ***: p<1×10⁻³/n, where n = 5 is the number of comparisons).
Figure 2—figure supplement 3.
Figure 2—figure supplement 3.. L. plantarum (Lp) intracellular pH is higher in stationary phase when grown with Acetobacter pasteurianus (Ap).
(A) Intracellular pH of Lp decreases upon entry to stationary phase in monoculture but not in co-culture with Ap. A strain of Lp containing a plasmid expressing the pH-sensitive GFP pHluorin (LppH) was grown in monoculture, co-cultured with Ap, or mixed with Ap at the start of the experiment. Fluorescence emission (at 509 nm) was measured at an excitation wavelength of 475 nm over time, and is correlated with pH. Shaded regions indicate standard deviation (S.D.), n = 3. Cultures of the parent strain without pHluorin (Lp, dashed lines) and MRS alone (gray) were included as controls. Data points were taken every 8.3 min. (B) Intracellular pH increases in co-cultures of LppH and Ap after 48 h of growth. Fluorescence (emission at 509 nm) was measured for two excitation wavelengths (405 and 475 nm) after resuspending pHluorin-harboring cells in PBS. The ratiometric signal scales with pH. Error bars are S.D., n = 3. p-values are from a Student’s two-sided t-test of the difference from the monoculture (***: p<0.001).
Figure 3.
Figure 3.. An increase in extracellular pH in stationary phase releases growth inhibition in Lp monocultures and shortens lag phase.
(A) Lp growth is inhibited by low pH. Logarithm of OD (blue) and pH measured using BCECF (orange) after 48 h of growth in MRS at various starting pH values. Error bars are standard deviation (S.D.), n = 4. (B) Instantaneous growth rate in MRS is strongly linked to pH. Each curve was initialized at a different starting pH and represents 48 h of growth. Arrowheads indicate direction of time. Shaded regions are S.D., n = 4. Data points were taken every 8.3 min. (C) Maximal growth rate in MRS increases with increasing initial pH. Error bars are S.D., n = 4. (D) Increasing the pH of a saturated, spent Lp culture from 3.77 to 7 allows growth, although not as much as fresh MRS. Error bars are S.D., n = 3. Data points were taken every 8.3 min. (E) Increasing the pH of an Lp monoculture at t = 30 h from 4 to 7 to mimic the pH increase in Lp-Ap co-culture (top) leads to a shorter lag phase (bottom). Lag time was calculated by fitting growth curves to the Gompertz equation. Error bars are S.D., n = 3. p-values are from a Student’s two-sided t-test of the difference from the control (***: p<5×10⁻⁴, equivalent to ***: p<1×10⁻³/n, where n = 2 is the number of comparisons; NS: not significant).
Figure 3—figure supplement 1.
Figure 3—figure supplement 1.. Growth of L. plantarum (Lp) in stationary phase is limited by the acidity of the medium.
(A–B) Growth of Lp depends on the initial pH of the medium and it stops at a common pH of ~3.7. Logarithm of (A) OD or (B) pH (measured with the pH-sensitive dye BCECF) over time for cultures of Lp in MRS at various starting pH values (colors). Shaded regions are standard deviation (S.D.), n = 4. Data points were taken every 8.3 min. (C) Lp-spent media can support growth of bulk Lp culture when taken from pH 3.77 to pH 7 and it supports faster growth rates and higher carrying capacity when supplemented with glucose at pH 7. Error bars are S.D., n = 3. Data points were taken every 8.3 min. (D) Lp-conditioned medium supports growth of Ap to higher OD than fresh medium and Ap-conditioned medium supports growth of Lp to lower OD than fresh medium. Error bars are S.D., n = 3. p-values are from a Student’s two-sided t-test of the difference from growth in fresh MRS (***: p<0.001). (E) Increasing the pH of an Lp monoculture at t = 30 h from 4 to 7 to mimic the pH increase in Lp-Ap co-culture (left panel) does not lead to significant increase in CFU/mL with respect to a control. A 48-hr-old culture with no changes in pH was used as a control (Ctrl.). Error bars are S.D. for each condition, n = 3. p-values are from a Student’s two-sided t-test of the difference between the cultures (NS, not significant, p>0.0167).
Figure 4.
Figure 4.. Co-cultures of Lp and Acetobacter species undergo shorter lag phases.
(A) Calculating the logarithm of OD normalized by OD at t = 0 reveals that co-cultures of Lp and various Acetobacter species (Ax) experience more rapid transitions from stationary phase to exponential growth than monocultures of Lp. Shaded regions indicate standard deviation (S.D.), n = 5. Inset: zoom-in of region inside dashed box highlighting lag differences. Data points were taken every 8.3 min. (B) Co-culture lag times are significantly shorter than Lp monoculture lag times. Lag times were obtained by fitting the growth curves in (A) to the Gompertz equation. Error bars are S.D. for each condition, n = 5. p-values are from a Student’s two-sided t-test of the difference from the monoculture (***: p<2×10⁻⁴, equivalent to ***: p<1×10⁻³/n, where n = 5 is the number of comparisons). (C) Mixing Lp monocultures with Ap monocultures (Mix) yields growth curves with a similar lag phase than those of Lp monocultures. Shaded regions indicate S.D., n = 5. Inset: zoom-in on region inside dashed box highlighting lag differences. Data points were taken every 8.3 min. (D) Mixed Lp-Ap cultures do not experience significantly shorter lag times than Lp monocultures. Lag times were obtained by fitting the curves in (C) to the Gompertz equation. Error bars are S.D. for each condition, n = 5. p-values are from a Student’s two-sided t-test of the difference from the monoculture (***: p<5×10⁻⁴, equivalent to ***: p<1×10⁻³/n, where n = 2 is the number of comparisons; NS: not significant). (E) Single-cell microscopy demonstrates that a decrease in the duration of lag phase of Lp was responsible for the lag-time decrease in co-culture. Representative phase microscopy images of Lp in monoculture and co-cultured with Ap on an MRS agar pad. The only Ap cell visible in these images is indicated with an arrow. Size bar = 5 µm. (F) The instantaneous elongation rate of single Lp cells increases faster in co-culture than in monoculture. Phase-contrast images were segmented and cells were classified as Lp or Ap based on their aspect ratio. Lines are the mean and shaded regions are the standard error for an Lp monoculture (nLp,0 h = 465, nLp,9.5 h = 27,503) or a co-culture with Ap (nLp,0 h = 448, nLp,9.5 h = 58,087, nAp,0 h = 47, nAp,9.5 h = 146). Images were taken every 5 min.
Figure 4—figure supplement 1.
Figure 4—figure supplement 1.. The growth rate of L. plantarum (Lp) co-cultures is similar to that of an Lp monoculture.
Maximum growth rate of Lp in monoculture or co-cultures with Acetobacter species (Ax) obtained by fitting growth curves to the Gompertz Equation 1. Species names are abbreviated as in Supplementary Figure 2—figure supplement 1. Error bars are S.D., n = 5. p-values are from a Student’s two-sided t-test of the difference from the monoculture (**: p<2×10⁻³, ***: p<2×10⁻⁴, equivalent to **: p<0.01/n, ***: p<1×10⁻³/n, where n = 5 is the number of comparisons ; NS: not significant).
Figure 4—figure supplement 2.
Figure 4—figure supplement 2.. Morphological differences permit differentiation of L. plantarum (Lp) from Acetobacter pasteurianus (Ap) in phase-contrast images.
(A-C) Representative phase-contrast images (top) enable quantification of width versus length (bottom) of individual cells in 48 h monocultures of Lp (A) or Ap (B) and in co-cultures of both species (C). (D–F) Representative phase-contrast images are overlaid with fluorescence images (top) for quantification of width versus length (bottom) of 48 h monocultures of mCherry-tagged Lp (D) or GFP-tagged Ap (E), and co-cultures of both species (F). (G-I) Morphology enables differentiation of Lp and Ap in phase microscopy images. Length (G), width (H), and aspect ratio (length/width, I) for monocultures in (A) and (B). Gray dots are individual cells, black circle is the mean, and error bars are standard deviation. (J) ROC curve for a classifier of Lp and Ap using the aspect ratio as a threshold. Curves shown correspond to the true-positive rate (sensitivity) of Lp and false-positive rate (1-specificity) of Ap classified as Lp for data in (A) and (B) (light blue) or (F) (purple). Circles show the optimal compromise points, with log10 (aspect ratio) of 0.164 and 0.162 for light blue and purple, respectively. Inset: zoom-in of region inside dashed box.
Figure 5.
Figure 5.. Tolerance to rifampin is modulated by pH.
(A) The duration of lag phase of bulk cultures of Lp depends on the time spent in stationary phase. Lp monocultures grown for various times from OD = 0.02, and co-cultures with Ap, were diluted into fresh medium. Lag time was calculated by fitting growth curves to the Gompertz equation. Error bars are standard deviation (S.D.), n = 12. p-values are from a Student’s two-sided t-test of the difference with respect to the 48 h culture (***: p<2.5×10⁻⁴, equivalent to ***: p<1×10⁻³/n, where n = 4 is the number of comparisons). (B) Culturing Lp as a monoculture for a shorter time leads to higher cell survival. Viable cell plating counts of Lp after growth in 20 µg/mL rifampin for 24 h normalized to the counts at the start of the experiment (t = 0). Error bars are S.D. for each condition, n = 3. p-values are from a Student’s two-sided t-test of the difference between the cultures (***: p<1×10⁻³). (C) Neutralization of pH in stationary phase in Lp monocultures is sufficient to induce tolerance. Increasing the pH of an Lp monoculture at t = 30 h or t = 40 h to 7 to mimic the pH increase in co-cultures of Lp with Acetobacter species (upper panel) increased cell survival (CFU/mL normalized to counts at the start of the experiment, t = 0) after treatment with 20 µg/mL rifampin for 24 h (lower panel). A 48-h-old culture with no changes in pH was used as a control (Ctrl.). Error bars are S.D. for each condition, n = 3. p-values are from a Student’s two-sided t-test of the difference between the cultures (**: p<5×10⁻³, equivalent to **: p<0.01/n, where n = 2 is the number of comparisons). (D) Acidification of Lp co-cultures with Ap during the exponential-to-stationary phase transition or in late stationary phase sensitizes Lp to rifampin. Decreasing the pH of an Lp co-culture with Ap at t = 30 h or t = 40 h to 3.7 to mimic the pH of an Lp monoculture (upper panel) increased survival (CFU/mL normalized to counts at the start of the experiment, t = 0) after treatment with 20 µg/mL rifampin for 24 h (lower panel). Error bars are S.D. for each condition, n = 3. p-values are from a Student’s two-sided t-test of the difference between the cultures (***: p<5×10⁻⁴, equivalent to ***: p<1×10⁻³, where = 2 is the number of comparisons). : values below the limit of detection. (E) The dynamics of killing in Lp co-culture with Acetobacter species differs quantitatively according to species and from Lp monoculture (blue), indicating that the Acetobacter species induce rifampin tolerance to different degrees. CFU/mL of Lp in monoculture and in co-culture with Acetobacter species, and treated with 50 µg/mL rifampin, normalized to counts at the start of the experiment (t = 0). Error bars are S.D. for each condition, n = 3. (F) The timing of the pH change in Acetobacter co-culture predicts the extent of protection against 50 µg/mL rifampin. Neutralization of pH in Lp monocultures at 40 h of growth (to mimic Lp+Aa co-cultures) elicits longer protection against rifampin than neutralization at 30 hr. A small increase in pH (from 3.85 to 4.5) at 30 h (to mimic Lp+Ao co-cultures) provides protection comparable to complete neutralization. CFU/mL were normalized to counts at the start of the experiment (t = 0). Error bars are S.D. for each condition, n = 3. (G) Lp survival to erythromycin is ~10 times higher after 24 h of treatment with erythromycin at supraMIC concentrations for 48-h-old monocultures of Lp than for 20-h-old Lp monocultures. Viable cell plating counts of Lp after growth in erythromycin for 24 h normalized to cell counts at the start of the experiment (t = 0). Error bars are S.D., n = 3. p-values are from a Student’s two-sided t-test of the difference between the two samples at a given time point (*: p<4×10⁻³, **: p<8×10⁻⁴ equivalent to *: p<0.05/n, **: p<0.01/n, where n = 12 is the number of comparisons; NS: not significant). (H) Shifting the pH of an Lp monoculture at 30 h to 4 or 7, followed by 18 h of growth before treatment with 2 µg/mL erythromycin, mimics the survival dynamics of a 48-h-old or 20-h-old culture in stationary phase, respectively. CFU/mL of Lp monocultures were normalized to counts at the start of the experiment (t = 0). Error bars are S.D. for each condition, n = 3.

References

    1. Aagaard J, Gasser T, Rhodes P, Madsen PO. MICs of ciprofloxacin and trimethoprim for Escherichia coli: influence of pH, inoculum size and various body fluids. Infection. 1991;19:S167–S169. doi: 10.1007/BF01643691. - DOI - PubMed
    1. Abranches J, Martinez AR, Kajfasz JK, Chávez V, Garsin DA, Lemos JA. The molecular alarmone (p)ppGpp mediates stress responses, vancomycin tolerance, and virulence in Enterococcus faecalis. Journal of Bacteriology. 2009;191:2248–2256. doi: 10.1128/JB.01726-08. - DOI - PMC - PubMed
    1. Adamowicz EM, Flynn J, Hunter RC, Harcombe WR. Cross-feeding modulates antibiotic tolerance in bacterial communities. The ISME Journal. 2018;12:2723–2735. doi: 10.1038/s41396-018-0212-z. - DOI - PMC - PubMed
    1. Argemi X, Hansmann Y, Christmann D, Lefebvre S, Jaulhac B, Jehl F. In vitro activity of daptomycin against Enterococcus faecalis under various conditions of growth-phases, inoculum and pH. PLOS ONE. 2013;8:e64218. doi: 10.1371/journal.pone.0064218. - DOI - PMC - PubMed
    1. Balaban NQ, Helaine S, Lewis K, Ackermann M, Aldridge B, Andersson DI, Brynildsen MP, Bumann D, Camilli A, Collins JJ, Dehio C, Fortune S, Ghigo JM, Hardt WD, Harms A, Heinemann M, Hung DT, Jenal U, Levin BR, Michiels J, Storz G, Tan MW, Tenson T, Van Melderen L, Zinkernagel A. Definitions and guidelines for research on antibiotic persistence. Nature Reviews Microbiology. 2019;17:441–448. doi: 10.1038/s41579-019-0196-3. - DOI - PMC - PubMed

Publication types

MeSH terms

Substances