. 2020 Jan 29:9:e51636.
doi: 10.7554/eLife.51636.

SIRT6 is a DNA double-strand break sensor

Affiliations

SIRT6 is a DNA double-strand break sensor

Lior Onn et al. Elife. .

Abstract

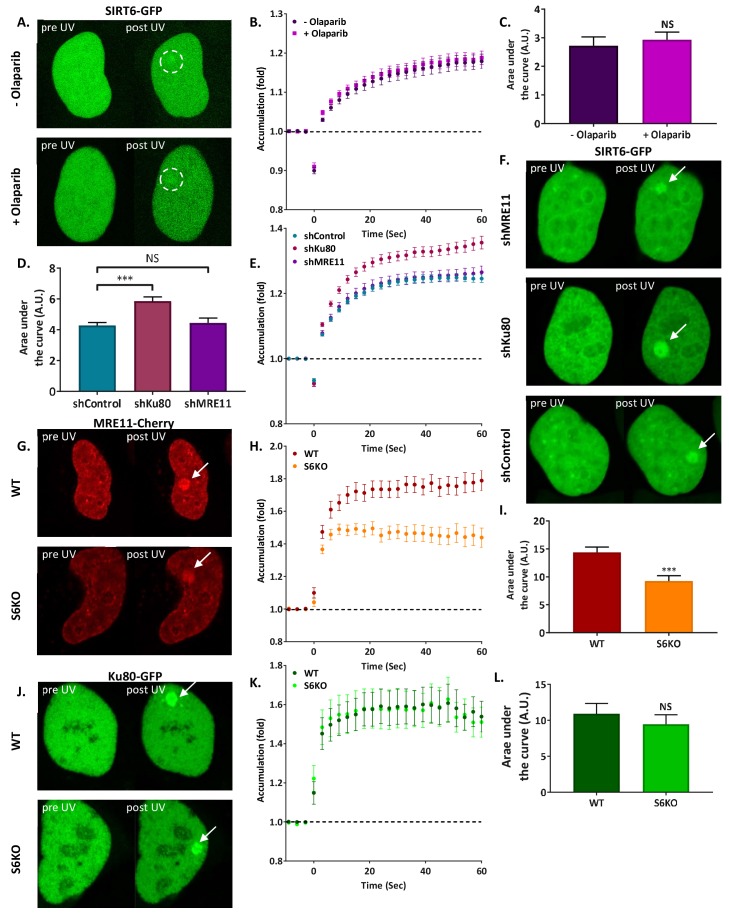
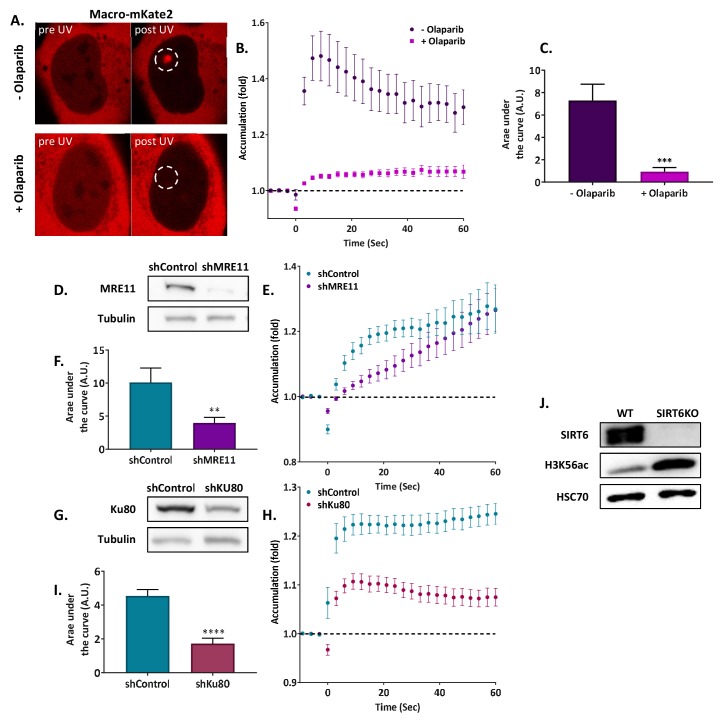
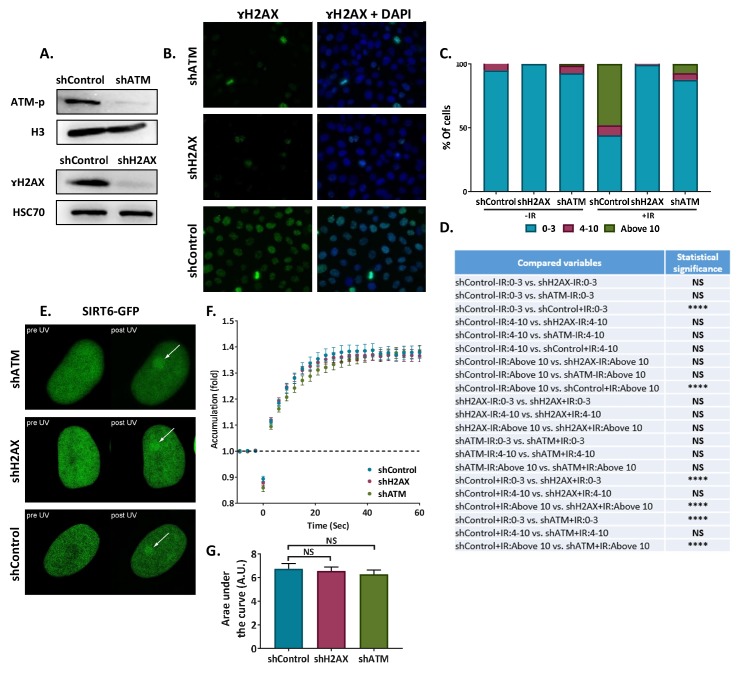
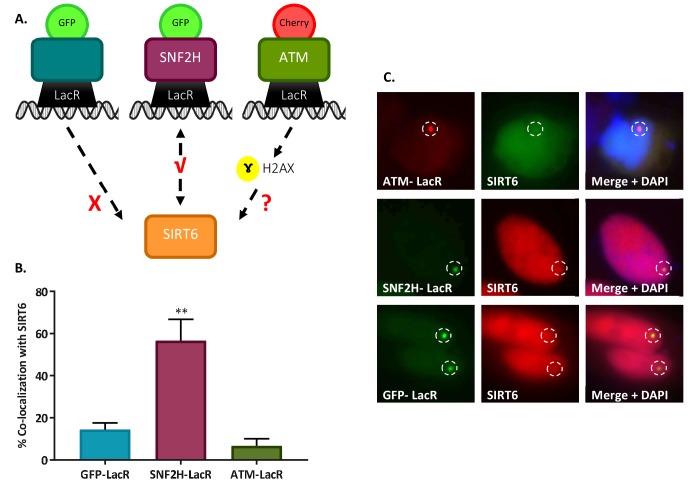
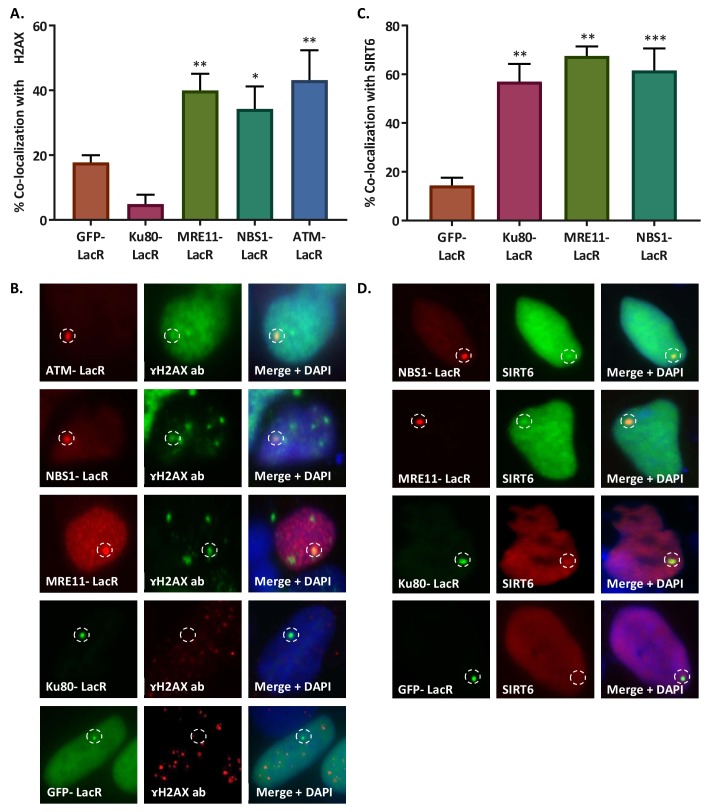
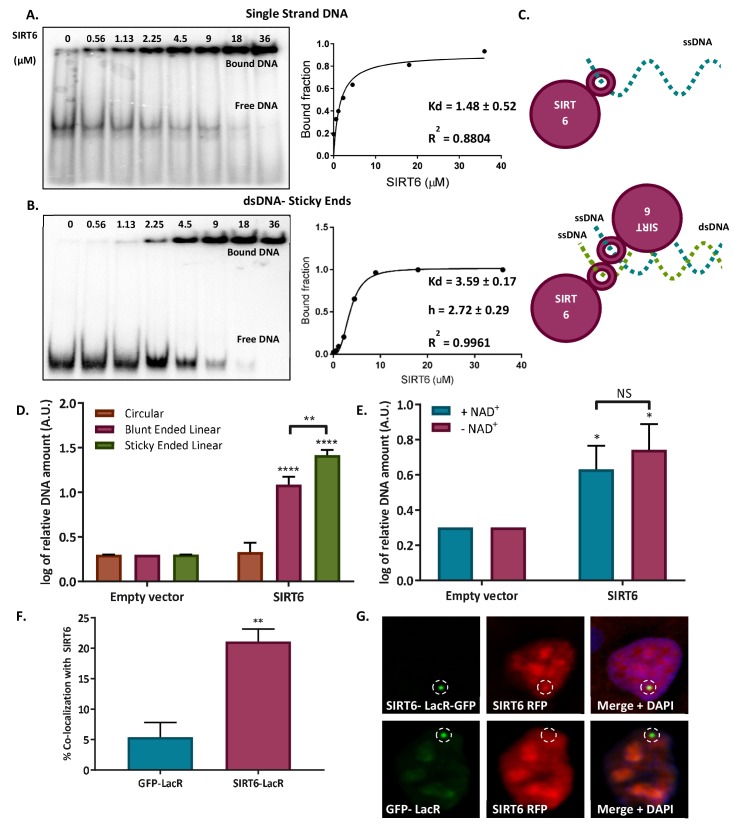
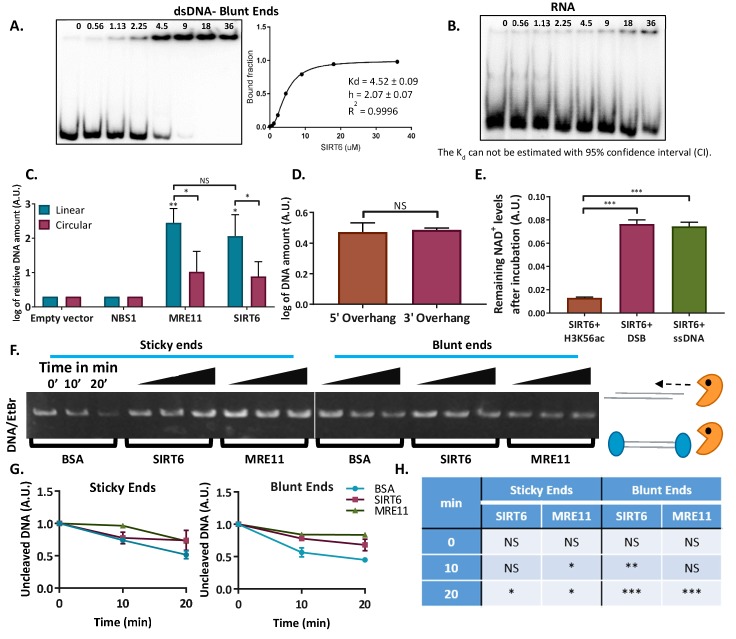
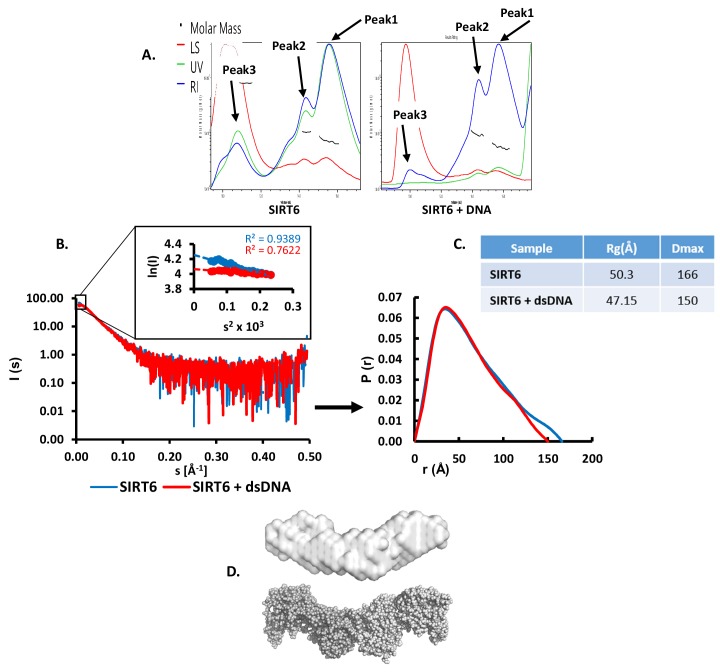
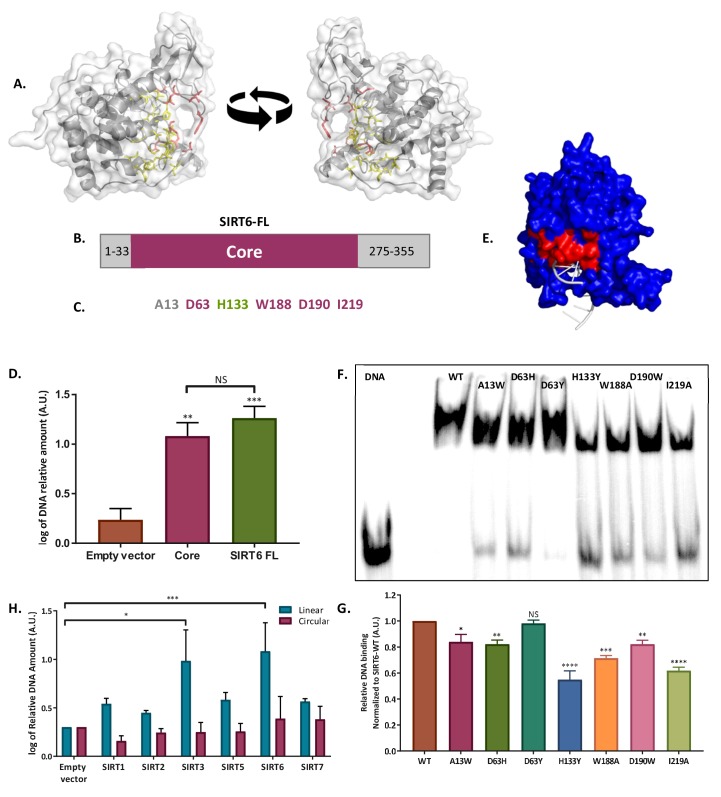
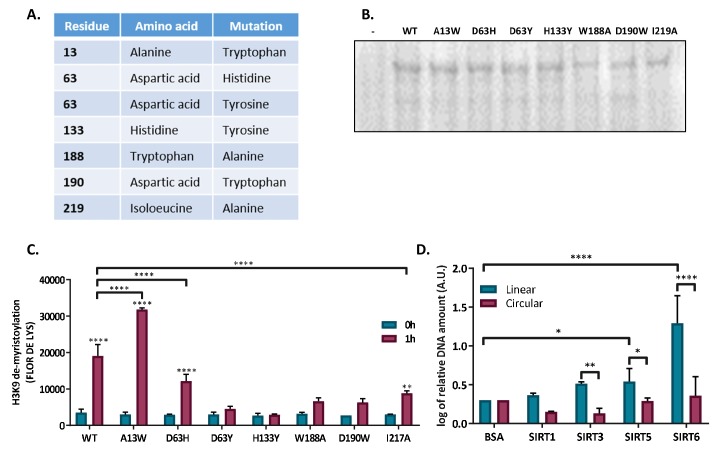
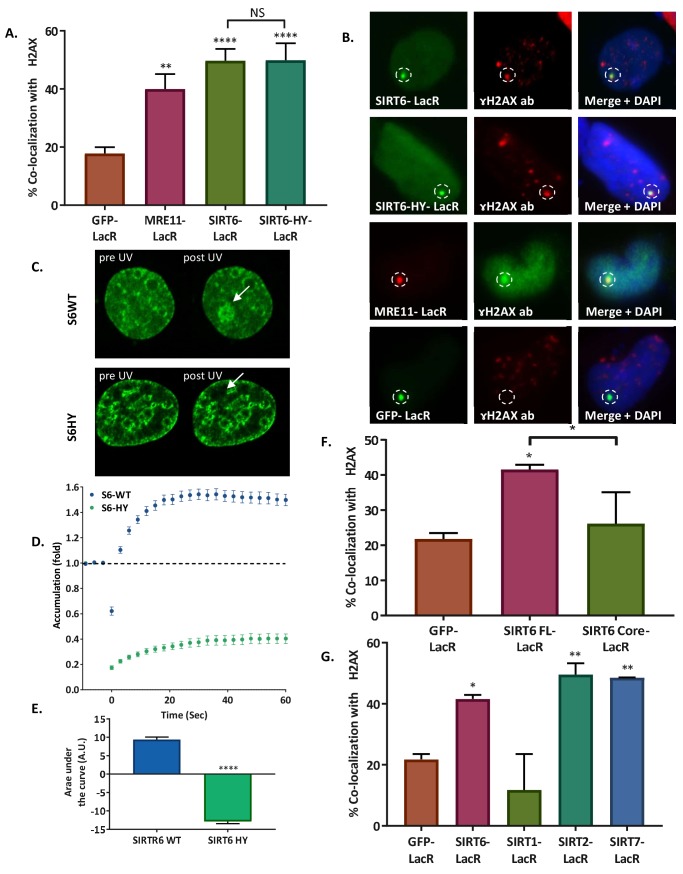
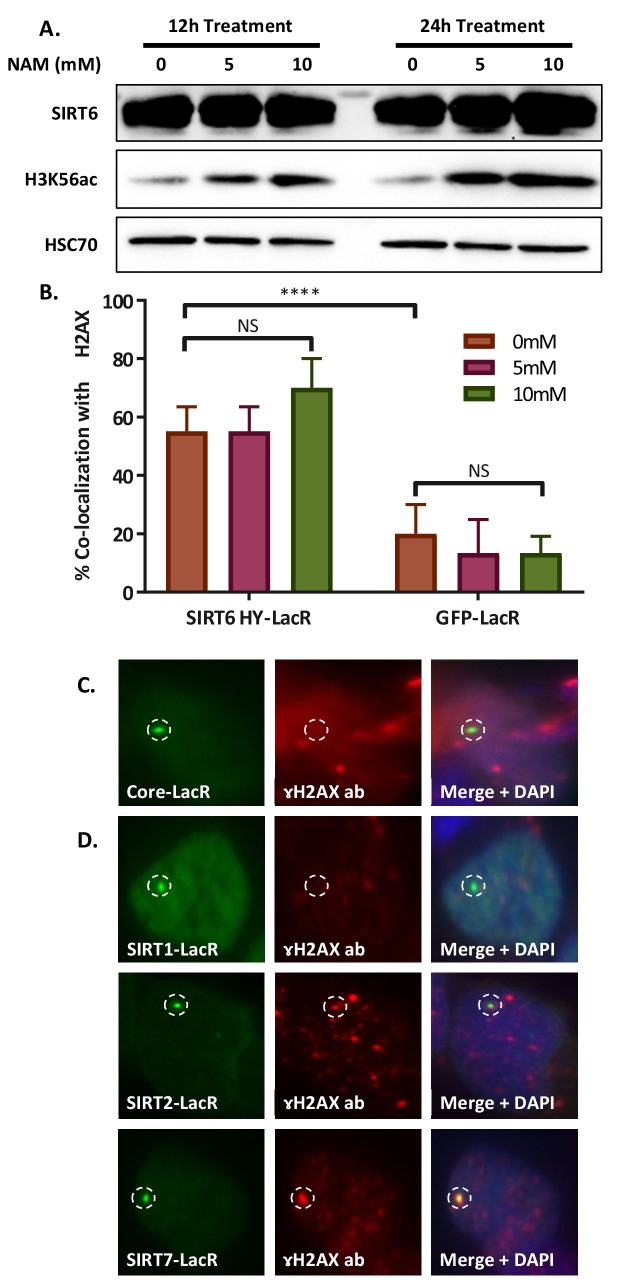
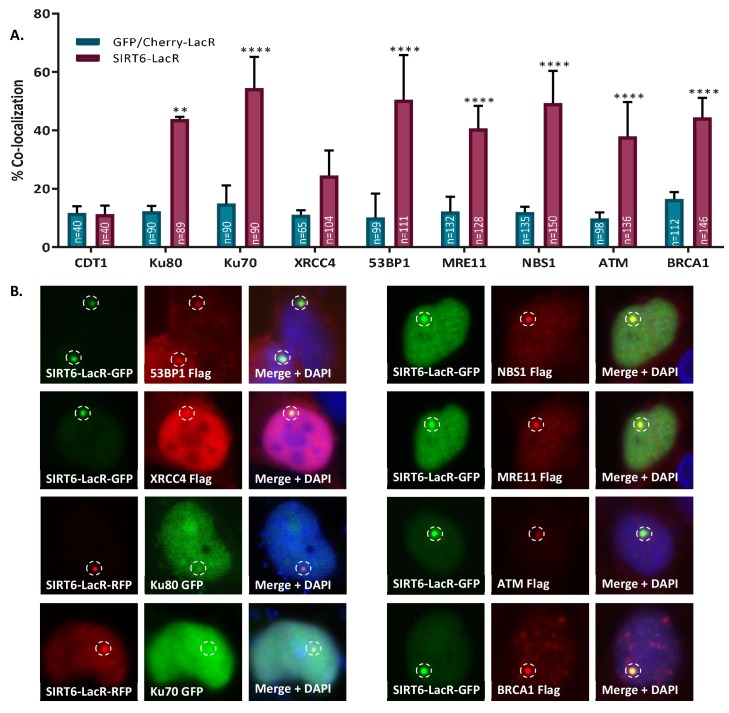
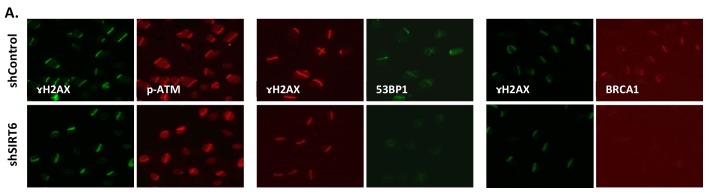
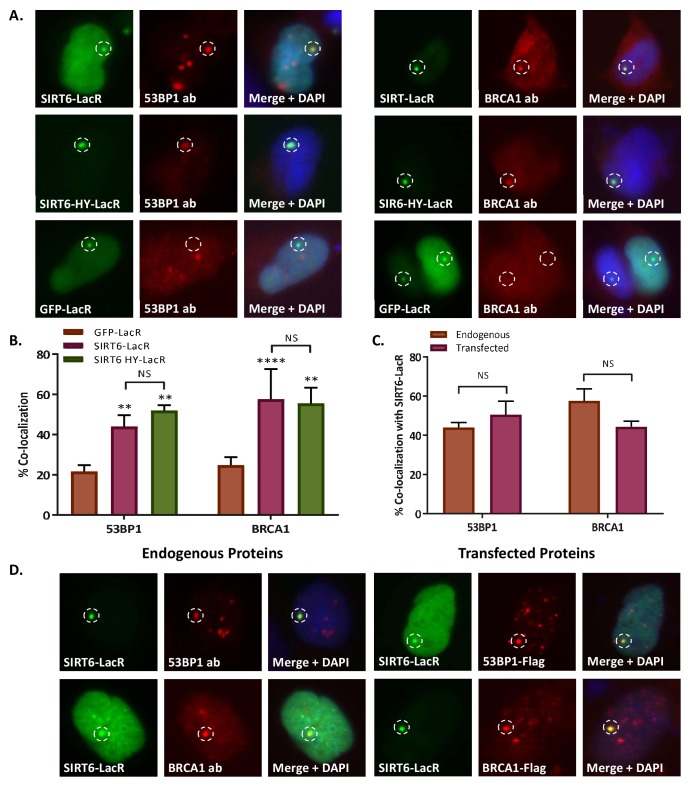
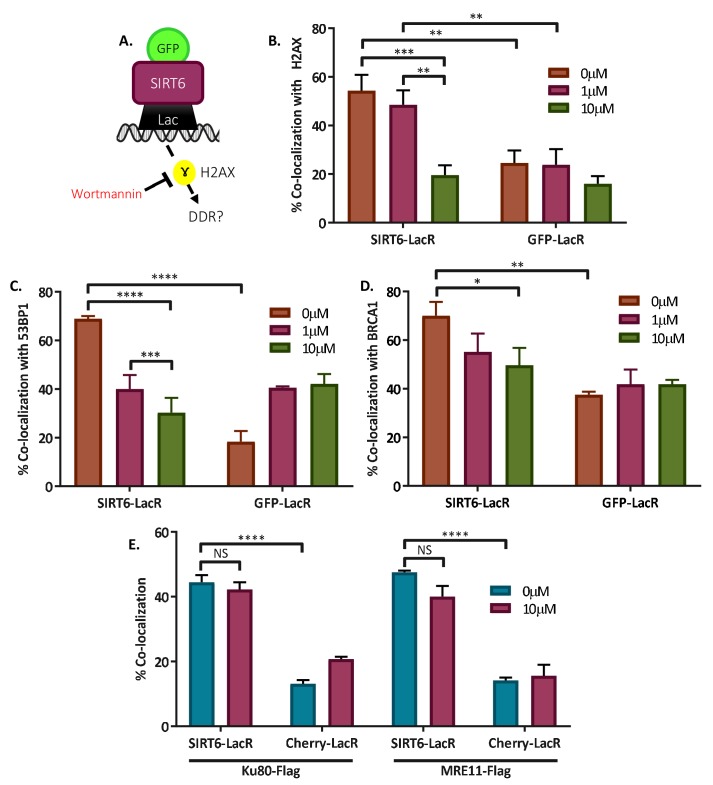
DNA double-strand breaks (DSB) are the most deleterious type of DNA damage. In this work, we show that SIRT6 directly recognizes DNA damage through a tunnel-like structure that has high affinity for DSB. SIRT6 relocates to sites of damage independently of signaling and known sensors. It activates downstream signaling for DSB repair by triggering ATM recruitment, H2AX phosphorylation and the recruitment of proteins of the homologous recombination and non-homologous end joining pathways. Our findings indicate that SIRT6 plays a previously uncharacterized role as a DNA damage sensor, a critical factor in initiating the DNA damage response (DDR). Moreover, other Sirtuins share some DSB-binding capacity and DDR activation. SIRT6 activates the DDR before the repair pathway is chosen, and prevents genomic instability. Our findings place SIRT6 as a sensor of DSB, and pave the road to dissecting the contributions of distinct DSB sensors in downstream signaling.

Keywords: DNA damage; DNA repair; DSB; SIRT6; cell biology; human; sensor.

Plain language summary

DNA is a double-stranded molecule in which the two strands run in opposite directions, like the lanes on a two-lane road. Also like a road, DNA can be damaged by use and adverse conditions. Double-strand breaks – where both strands of DNA snap at once – are the most dangerous type of DNA damage, so cells have systems in place to rapidly detect and repair this kind of damage. There are three confirmed sensors for double-strand break in human cells. A fourth protein, known as SIRT6, arrives within five seconds of DNA damage, and was known to make the DNA more accessible so that it can be repaired. However, it was unclear whether SIRT6 could detect the double-strand break itself, or whether it was recruited to the damage by another double-strand break sensor. To address this issue, Onn et al. blocked the three other sensors in human cells and watched the response to DNA damage. Even when all the other sensors were inactive, SIRT6 still arrived at damaged DNA and activated the DNA damage response. To find out how SIRT6 sensed DNA damage, Onn et al. examined how purified SIRT6 interacts with different kinds of DNA. This revealed that SIRT6 sticks to broken DNA ends, especially if the end of one strand slightly overhangs the other – a common feature of double-strand breaks. A closer look at the structure of the SIRT6 protein revealed that it contains a narrow tube, which fits over the end of one broken DNA strand. When both strands break at once, two SIRT6 molecules cap the broken ends, joining together to form a pair. This pair not only protects the open ends of the DNA from further damage, it also sends signals to initiating repairs. In this way, SIRT6 could be thought of acting like a paramedic who arrives first on the scene of an accident and works to treat the injured while waiting for more specialized help to arrive. Understanding the SIRT6 sensor could improve knowledge about how cells repair their DNA. SIRT6 arrives before the cell chooses how to fix its broken DNA, so studying it further could reveal how that critical decision happens. This is important for medical research because DNA damage builds up in age-related diseases like cancer and neurodegeneration. In the long term, these findings can help us develop new treatments that target different types of DNA damage sensors.


Conflict of interest statement

LO, MP, SI, GC, DS, SK, IS, ZS, ME, FE, BA, DT No competing interests declared

Figures

Figure 1.
Figure 1.. SIRT6 arrives at sites of damage independently of other repair factors.
(A–C) Imaging and AUC for SIRT6-GFP in cells with or without Olaparib. (A) Live imaging recruitment upon UV laser-induced damage (LID) shown by SIRT6-GFP in U2OS +/– Olaparib. Representative experiment examining SIRT6 recruitment to LID (n[+Ola]=23, n[–Ola]=23). (B) SIRT6 accumulation in same experiment as panel (A). (C) Average area under the curve (AUC) for cells +/– Olaparib in three replicate experiments. Error bars are the standard error of the mean (SEM) (n[+Ola]=38, n[–Ola]=39, p>0.05). (D–F) Imaging and AUC for SIRT6-GFP accumulation in shControl, shKu80 or shMRE11 Hela cells. (D) Average AUC from three experiments. Error bars are the SEM (shControl: n = 50; shKu80: n = 50, p<0.0005; shMRE11: n = 52, p>0.05). Accumulation of SIRT6-GFP (E) and imaging (F) from a representative experiment examining SIRT6 recruitment after LID (n[shControl]=28; n[shKu80]=30, n[shMRE11]=30). (G–I) MRE11-Cherry accumulation in response to LID in SIRT6 WT and KO U2OS cells. MRE11-Cherry imaging (G) and accumulation (H) in a representative experiment (n[WT]=20, n[KO]=16). (I) Mean AUC for three replicate experiments. Error bars are the SEM (n[WT]=36, n[KO]=33, p<0.0005). (J–L) Ku80-GFP accumulation in response to LID in SIRT6 WT and KO U2OS cells. Ku80-GFP imaging (J) and accumulation (K) in a representative experiment (n[WT]=17, n[KO]=17). (L) Mean AUC for three replicate experiments. Error bars are the SEM (n[WT]=33, n[KO]=33, p>0.05).
Figure 1—figure supplement 1.
Figure 1—figure supplement 1.. SIRT6 arrivesatsites of damage independently of other repair factors.
(A, B) Effect of LID on Macro-domain mKate2 in U2OS +/- Olaparib. (n[+Ola]=10, n[-Ola]=10). (C) Average AUC of Macro-mKat2 in U2OS +/- Olaparib for three replicated experiments (error bars are SEM) (n[+Ola]=25, n[–Ola]=25, p<0.0005). (D) Blot of shControl and shMRE11 Hela cells. (E) Effect of LID on NBS1-Cherry in shControl (n = 10) and shMRE11 Hela cells (n = 10). (F) Average AUC for three replicate experiments +/- SEM (n[shControl]=29, n[shMRE11]=30, p<0.005)). (G) Protein blot of shControl and shKu80 Hela cells. (H) Effect of LID on Ku70-GFP accumulation in shControl (n = 10) and shKu80 Hela cells (n = 10). (I) Average AUC for three replicate experiments. Error bars are SEM (n[shControl]=33, n[shKu80]=31, p<0.0001). (J) Blot of WT and SIRT6KO cells.
Figure 1—figure supplement 2.
Figure 1—figure supplement 2.. SIRT6 arrivesatsites of damage independently of other repair factors.
(A) Blot of shATM, shH2AX and shcControl Hela cells. (B) Immunofluorescence of γH2AX in sh-Hela cells upon irradiation (IR). (C) Quantification of γH2AX foci in Control (n[–IR]=283, n[+IR]=301), shH2AX (n[–IR]=284, n[+IR]=322) and shATM (n[–IR]=299, n[+IR]=385) Hela cells. The bar chart shows the percentages of cells with 0–3, 4–10 or more than 10 foci per nucleus (+/- IR, average of six experiments). (D) Statistical analysis of the γH2AX foci quantification experiment depicted in panel (C) (*, p < 0.05; **, p <0.005, ***, p < 0.0005). (E,F) Representative experiment showing SIRT6-GFP accumulation in response to LID in shH2AX (n = 10), shATM (n = 10) or shControl (n = 10) cells. (G) Average AUC for three replicate experiments. Error bars are SEM (shControl: n = 30; shH2AX: n = 30, p>0.05; shATM: n = 30, p>0.05).
Figure 2.
Figure 2.. SIRT6 is not recruited by signaling.
(A) Schematic representation of the ‘Tethering assay’. Recruitment can occur through DDR signaling (ATM-LacR-Cherry) or through direct protein–protein interaction (SNF2H-LacR-GFP). (B, C) Recruitment of SIRT6-GFP/SIRT6-Cherry to LacO sites by ATM-LacR-Cherry (n = 30, p>0.05), SNF2H-LacR-GFP (n = 85, p<0.005) and GFP-LacR (n = 85). The bar chart in panel (B) depicts averages for3–6 experiments. Error bars are SEM.
Figure 2—figure supplement 1.
Figure 2—figure supplement 1.. SIRT6 is not recruited by signaling.
(A, B) Initiation of DDR by ATM-LacR-Cherry (n = 33, p<0.005), NBS1-LacR-Cherry (n = 82, p<0.05), MRE11-LacR-Cherry (n = 136, p<0.005) and Ku80-LacR-GFP (n = 52, p>0.05) in the tethering system. Co-localization percentage with γH2AX (compared to GFP-LacR (n = 310)) (A) and immunofluorescence (B) are shown. (C, D) Recruitment of SIRT6-GFP/SIRT6-Cherry to LacO sites by NBS1-LacR-Cherry (n = 87, p<0.0005), MRE11-LacR-Cherry (n = 31, p<0.005), Ku80-LacR-GFP (n = 45, p<0.005) and GFP-LacR (n = 85). Co-localization percentage with SIRT6 (compared to GFP-LacR (C) and immunoflorescence (D) are shown. Averages are for 3–5 experiments. Error bars show the SEM.
Figure 3.
Figure 3.. SIRT6 binds DNA with no intermediates.
(A–B) Gel retardation assay of 32 P-5' end-labeled single-strand DNAs and sticky ended dsDNAs as a function of increasing concentrations of SIRT6-His (ssDNA, Kd = 1.48 ± 0.52; sticky dsDNA, Kd = 3.59 ± 0.17). (C) Suggested model of SIRT6 binding to ssDNA as a monomer or open ssDNA ends of dsDNA as a dimer. (D) Ability of SIRT6-Flag to bind to the DNA of circular, blunt-ended and sticky-ended cleaved plasmids. The bar chart depicts averages for three replicate experiments (error bars show SEM), after logarithmic transformation. (E) SIRT6-Flag DNA-binding ability for an open-ended +plasmid +/- NAD. Data are averages from four experiments, with error bars representing SEM (after logarithmic transformation). (F, G) Dimerization of SIRT6 at the LacO site, represented by the recruitment of SIRT6-Cherry by SIRT6-LacR-GFP (n = 181, p<0.005) or GFP-LacR (n = 104). Data are averages from four experiments, with error bars representing SEM.
Figure 3—figure supplement 1.
Figure 3—figure supplement 1.. SIRT6 binds DNA with no intermediates.
(A) Gel retardation assay of 32 P-5′ end-labeled dsDNAs with blunt ends as a function of increasing concentrations of SIRT6-His. (B) Gel retardation assay of 32 P-5′ end-labeled RNAs as a function of increasing concentrations of SIRT6-His. Kd could not have been calculated with a 95% confidence interval (CI). (C) DNA-binding ability of SIRT6-Flag, MRE11-Flag and NBS1-Flag for circular and linear plasmids, assessed by a DNA-binding assay. Data are means for 3–9 experiments (with error bars representing SEMs) after logarithmic transformation. (D) SIRT6-Flag DNA-binding ability for plasmids with a 3′ over-hang and a 5′ over-hang assessed by a DNA-binding assay. Log of averages of three experiments (with error bars representing SEMs). (E) Relative amount of NAD+ remaining after consumption by SIRT6 in the presence of DNA alone or with an acetylated peptide (H3K56ac). (F, G) Protection of sticky-ended and blunt-ended plasmids by BSA, SIRT6 and MRE11 against Exonuclease 1 in different time points. Data in panel (G) are means (with error bars showing +/- SEM) from three experiments. (H) Statistical analysis of the end protection: amounts of uncleaved DNA remaining in the presence of SIRT6 or MRE11 compared to BSA (as a control) after 0, 10 or 20 min (*, p <0.05; **, p <0.005; ***, p <0.0005).
Figure 3—figure supplement 2.
Figure 3—figure supplement 2.. SIRT6 binds DNA with no intermediates.
(A) SEC-MALS analysis of SIRT6 or of SIRT6 with a dsDNA 10-bp oligo with 3-bp overhanging ends on both sides. For SIRT6: Peak1 protein mass (calculated by UV) = 66.7 ± 3.3 kDa, protein mass (calculated by RI) = 70.7 ± 3.5 kDa; Peak2 protein mass (calculated by UV) = 114.3 ± 5.7 kDa, protein mass (calculated by RI) = 103.8 ± 4.9 kDa; Peak3 protein mass (calculated by UV) = 609.7 ± 14.6 kDa, protein mass (calculated by RI) = 833.6 ± 16.4 kDa. For SIRT6 +DNA: Peak1 protein mass (calculated by UV) = 52.5 ± 3.1 kDa, protein mass (calculated by RI) = 55.7 ± 3.2 kDa; Peak2 protein mass (calculated by UV) = 99.4 ± 3.8 kDa, protein mass (calculated by RI) = 94.6 ± 3.5 kDa; Peak3 protein mass (calculated by UV) = extremely high, protein mass (calculated by RI) = 9224 ± 258 kDa. (B) X-ray scattering profile (right) and the distance distribution function (left) of SIRT6 (blue) and SIRT6 bound to dsDNA (red). (C) Overall parameters for small angle X-ray scattering of SIRT6 alone and of SIRT6 bound to dsDNA determined from the distance distribution function P(r). Rg is the radius of gyration, and Dmax is the maximum dimension of the particle. (D) SAXS structure of SIRT6 (grey surface). Ab initio models were reconstructed from SAXS data using the computer program DAMMIN (Svergun, 1999) and were averaged by the computer program DAMAVER (Volkov and Svergun, 2003). The crystal structure of SIRT6 tetramer (grey spheres) was extracted from the crystal structure of SIRT6 (pdb id: 3PKI) and compared with the obtained SAXS model in PyMOL (http://www.pymol.org).
Figure 4.
Figure 4.. SIRT6 binds DSB through its core domain.
(A) Predicted DNA-binding site based on the published SIRT6 structure, (http://dnabind.szialab.org/). Highlighted in yellow are the predicted DNA-binding amino acids in the SIRT6 core domain; red highlights show the tunnel-forming amino acids that were mutated. (B) Schematic representation of the SIRT6 core domain. (C) List of amino acids that are predicted to participate in the ‘tunnel-like’ structure. (D) DNA binding of an open-ended plasmid by full-length SIRT6 (p<0.0005) and by the SIRT6-core domain (p<0.005). Data are the log of averages from three experiments (with error bars respresenting SEMs). (E) SIRT6 ssDNA-binding prediction, based on the known SIRT6 structure with bound ssDNA. (F, G) Gel retardation assay of 32 P-5′ end-labeled ssDNAs with SIRT6-MBP mutants. Data are averages from three experiments (with error bars representing SEMs). (H) Ability of Flag-tagged mammalian Sirtuins to bind the DNA of circular and linear plasmids. Data are averages from 4–7 experiments (with error bars representing SEMs) (*, p <0.05; **, p <0.005; ***, p <0.0005).
Figure 4—figure supplement 1.
Figure 4—figure supplement 1.. SIRT6 binds DSB through itscore domain.
(A) List of generated SIRT6 point mutations in the SIRT6 tunnel structure. (B) Ponceau staining of SIRT6-MBP point mutants. (C) Catalytic activity of SIRT6-MBP mutants, assessed by H3K9 de-myristolation in a FLUOR DE LYS assay. (D) Ability of His-tagged mammalian Sirtuins to bind the DNA circular and linear plasmids. Data are logs of the averages from 4–7 experiments (with error bars representing SEMs) (*, p<0.05; **, p<0.005; ***, p<0.0005).
Figure 5.
Figure 5.. SIRT6 can initiate the DNA damage response.
(A, B) Initiation of the DDR, measured by co-localization of MRE11-LacR-Cherry (n = 136, p<0.005), SIRT6-LacR-GFP (n = 243, p<0.0001) or SIRT6 HY-LacR-GFP (n = 71, p<0.0001), compared to GFP-LacR (n = 310). Data are means for 4–9 experiments (error bars are SEMs). (C, D) Live imaging upon laser-induced damage (LID) of SIRT6-WT-GFP (n = 20) or SIRT6-HY-GFP (n = 20) in SIRT6 KO U2OS cells (n = 20). (D) Accumulation over time in 3 s intervals. (E) Average area under the curve of for three LID experiments (error bars are SEMs) (n[S6-WT]=40, n[S6-HY]=39, p<0.0001). (F) Initiation of DDR by full-length SIRT6-LacR-GFP (n = 127, p<0.005), Core-LacR-GFP (n = 66, p>0.05) or GFP-LacR (n = 64). Data are averages from 3–4 experiments (error bars show SEMs). (G) Initiation of DDR by SIRT6-LacR-GFP (n = 127, p<0.05), SIRT1-LacR-GFP (n = 44, p>0.05), SIRT2-LacR-GFP (n = 67, p<0.005), SIRT7-LacR-GFP (n = 68, p<0.005) or GFP-LacR (n = 64). Data are averages from 3–10 experiments (error bars show SEMs).
Figure 5—figure supplement 1.
Figure 5—figure supplement 1.. SIRT6 can initiatetheDNA damage response.
(A) Western blot of nuclear protein fraction of LacO containing U2OS cells after 12 or 24 hr treatment with 0, 5 or 10 mM nicotinamide (NAM) added to their media. (B) Co-localization percentage with γH2AX of SIRT6 HY-LacR-GFP and GFP-LacR after 24 hr of treatment with NAM at three concentrations (*, p<0.05; **, p<0.005; ***, p<0.0005). (C) Immunofluorescence (IF) of co-localization of Core-LacR-GFP (n = 66, p>0.05). Experiment quantification appears in Figure 5C. (D) IF of co-localization of SIRT1-LacR-GFP (n = 44, p>0.05), SIRT2-LacR-GFP (n = 67, p<0.005) and SIRT7-LacR-GFP (n = 68, p<0.005). Experiment quantification appears in Figure 5D.
Figure 6.
Figure 6.. SIRT6 can recruit enzymes of both the NHEJ and HR repair pathways.
(A, B) Percentage repair enzymes that are co-localized with SIRT6-LacR-GFP/Cherry at LacO sites. IF with Flag antibody. Data are averages for 3–6 experiments (with error bars representing SEMs) (*, p<0.05; **, p<0.005; ***, p<0.0005; ****, p<0.00005).
Figure 6—figure supplement 1.
Figure 6—figure supplement 1.. SIRT6 can recruit enzymes of boththeNHEJ and HR repair pathways.
(A) Laser-induced damage imaged by IF 30 min after damage. The images show recruitment of p-ATM, 53BP1 or BRCA1 in shControl or shSIRT6 U2OS.
Figure 6—figure supplement 2.
Figure 6—figure supplement 2.. SIRT6 can recruit enzymes of boththeNHEJ and HR repair pathways.
(A, B) Co-localization of 53BP1 and BRCA1 with SIRT6-LacR-GFP (53BP1: n = 247, p<0.005; BRCA1: n = 223, p<0.005) and HY-LacR-GFP (53BP1: n = 113, p<0.005; BRCA1: n = 122, p<0.005), compared with GFP-LacR (53BP1: n = 130; BRCA1: n = 157). The data shown in panel (B) are averages from 3–5 experiments (error bars are SEMs). (C, D) Comparison of co-localization of endogenous 53BP1 (n = 247) and BRCA1 (n = 223) and transfected 53BP1-Flag (n = 111) and BRCA1-Flag (n = 146) with SIRT6-LacR-GFP, assessed by IF.
Figure 6—figure supplement 3.
Figure 6—figure supplement 3.. SIRT6 can recruit enzymes of boththeNHEJ and HR repair pathways.
(A) Schematic representation of the Tethering assay with inhibition of signaling using Wortmannin. (B–D) Co-localization of γH2AX (B), 53BP1 (C), and BRAC1 (D) with SIRT6-LacR-GFP or GFP/Cherry-LacR after 24 hr with or without Wortmannin. Data are averages for three experiments (error bars are SEMs). (B) Co-localization with γH2AX (0 μM: n[SIRT6] = 43, n[GFP] = 41; 1 μM: (n[SIRT6] = 42, n[GFP] = 42; 10 μM: (n[SIRT6] = 42, n[GFP]=41). (C) Co-localization with 53BP1 (0 μM: n[SIRT6] = 32, n[GFP] = 32; 1 μM: n[SIRT6] = 30, n[GFP] = 32; 10 μM: n[SIRT6] = 33, n[GFP] = 31). (D) Co-localization with BRCA1 (0 μM: n[SIRT6] = 30, n[GFP] = 32; 1 μM: n[SIRT6] = 31, n[GFP] = 31; 10 μM: n[SIRT6] = 32, n[GFP] = 31). (E) Co-localization of Ku80-Flag or MRE11-Flag with SIRT6-LacR-GFP or GFP/Cherry-LacR after 24 hr with or without Wortmannin. Data are averages for three experiments (error bars are SEMs). For Ku80-Flag — 0 μM: n[SIRT6] = 45, n[Cherry] = 53; 10 μM: n[SIRT6] = 45, n[Cherry] = 58. For MRE11-Flag — 0 μM: n[SIRT6] = 50, n[Cherry] = 56; 10 μM: n[SIRT6] = 60, n[Cherry] = 51. *, p<0.05; **, p<0.005; ***, p<0.0005; ****, p<0.00005).
Author response image 1.
Author response image 1.. Aspartate basepairing with DNA bases and backbone.
Author response image 2.
Author response image 2.. Scheme of Laser Induced damage (LID) experiment.
Author response image 3.
Author response image 3.. Western blot of Hela cells after attempt to create PARP1 KO using a CRISPR-Cas9 system.
Author response image 4.
Author response image 4.. Co-localization analysis.
(A) LacR-ATM with SIRT6-GFP: Both are nuclear proteins that are usually found evenly spread across the entire nucleus. While we can see a sharp peak where the ATM-LacR focus is located, we do not see a peak of SIRT6-GFP at the same cellular location, which means there is no co-localization of the two proteins in this image. (B) LacR-SNF2H with SIRT6-RFP: A clear peak in the graph of the SNF2H-LacR is accompanied by a clear peak of the SIRT6-RFP, meaning positive co-localization. Since the red signal is much weaker than the green, the SIRT6 peak is much smaller than the SNF2H one. (C) LacR-Ku80 with SIRT6-RFP: In this case the SIRT6-RFP signal is much stronger that the Ku80-LacR GFP signal; however, we can still observe clear peaks at the same location. (D) LacR-GFP with SIRT6-RFP: In this negative control condition, there are no parallel peaks in the graph. However, when looking at the merged image we see that both cells are”yellow”. This just means that both signals are equally as strong (as can be seen in the graph as well) and that both proteins are spread throughout the entire nucleus; however, this is not a co-localization. (E-F) LacR-SIRT6 with 53BP1: When comparing endogenous 53BP1 (E) to the exogenous (F), we can see that using an endogenous antibody usually gives a “cleaner” higher peak with less background; however, in both cases the co-localization is clear.
Author response image 5.
Author response image 5.. IF for ɤH2AX in in SIRT6-LacR-GFP expressing U2OS cells.
“New” vs. “Old” cells.

References

    1. Akabayov B, Akabayov SR, Lee S-J, Tabor S, Kulczyk AW, Richardson CC. Conformational dynamics of bacteriophage T7 DNA polymerase and its processivity factor, Escherichia coli thioredoxin. PNAS. 2010;107:15033–15038. doi: 10.1073/pnas.1010141107. - DOI - PMC - PubMed
    1. Andres SN, Schellenberg MJ, Wallace BD, Tumbale P, Williams RS. Recognition and repair of chemically heterogeneous structures at DNA ends. Environmental and Molecular Mutagenesis. 2015;56:1–21. doi: 10.1002/em.21892. - DOI - PMC - PubMed
    1. Arosio D, Cui S, Ortega C, Chovanec M, Di Marco S, Baldini G, Falaschi A, Vindigni A. Studies on the mode of ku interaction with DNA. Journal of Biological Chemistry. 2002;277:9741–9748. doi: 10.1074/jbc.M111916200. - DOI - PubMed
    1. Bartek J, Lukas J. DNA repair: damage alert. Nature. 2003;421:486–488. doi: 10.1038/421486a. - DOI - PubMed
    1. Bartek J, Lukas J. DNA damage checkpoints: from initiation to recovery or adaptation. Current Opinion in Cell Biology. 2007;19:238–245. doi: 10.1016/j.ceb.2007.02.009. - DOI - PubMed

Publication types