Meta-Analysis
. 2020 Jan 23;61(1):2.
doi: 10.1167/iovs.61.1.2.

Topographic Variation of the Growth Rate of Geographic Atrophy in Nonexudative Age-Related Macular Degeneration: A Systematic Review and Meta-analysis

Affiliations
Meta-Analysis

Topographic Variation of the Growth Rate of Geographic Atrophy in Nonexudative Age-Related Macular Degeneration: A Systematic Review and Meta-analysis

Liangbo L Shen et al. Invest Ophthalmol Vis Sci. .

Abstract

Purpose: To determine the impact of topographic locations on the progression rate of geographic atrophy (GA).

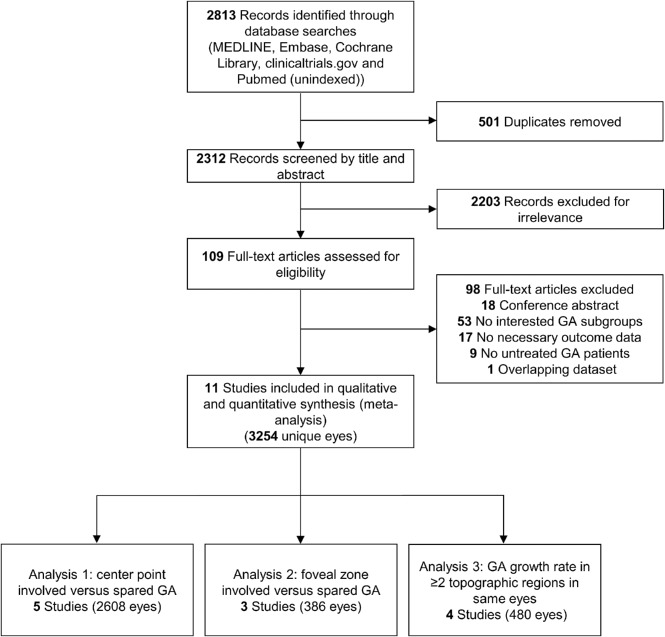
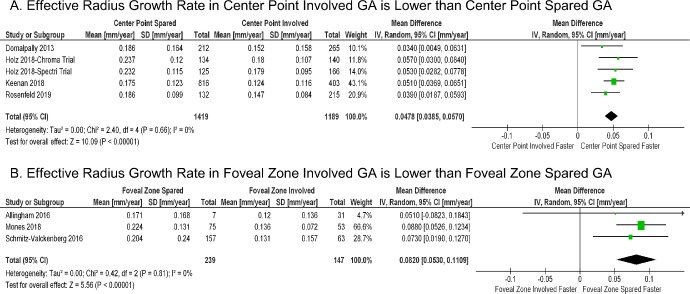
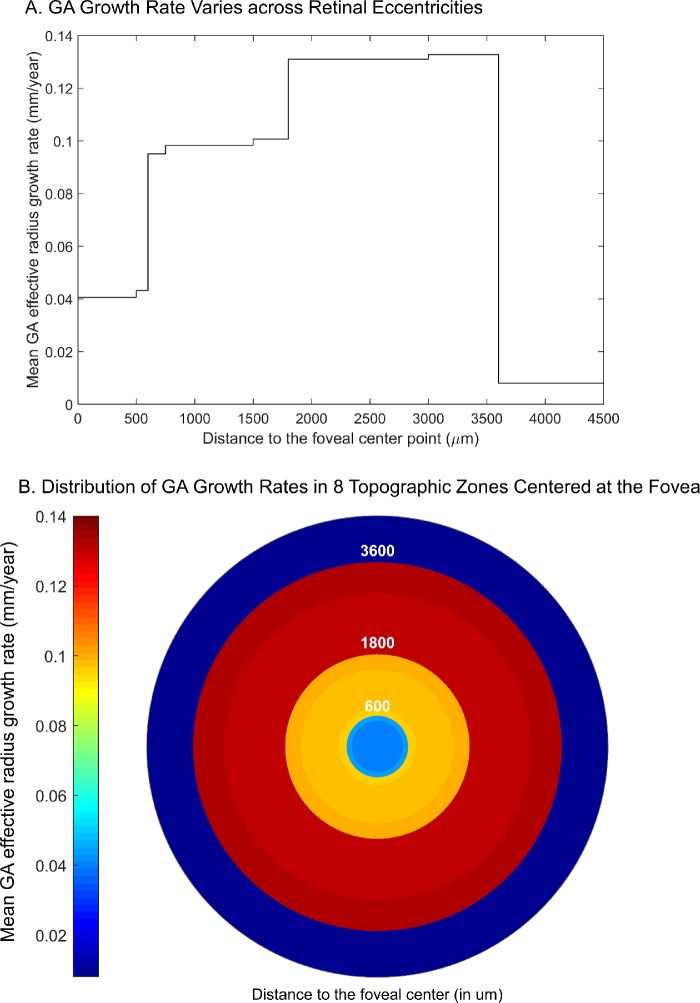
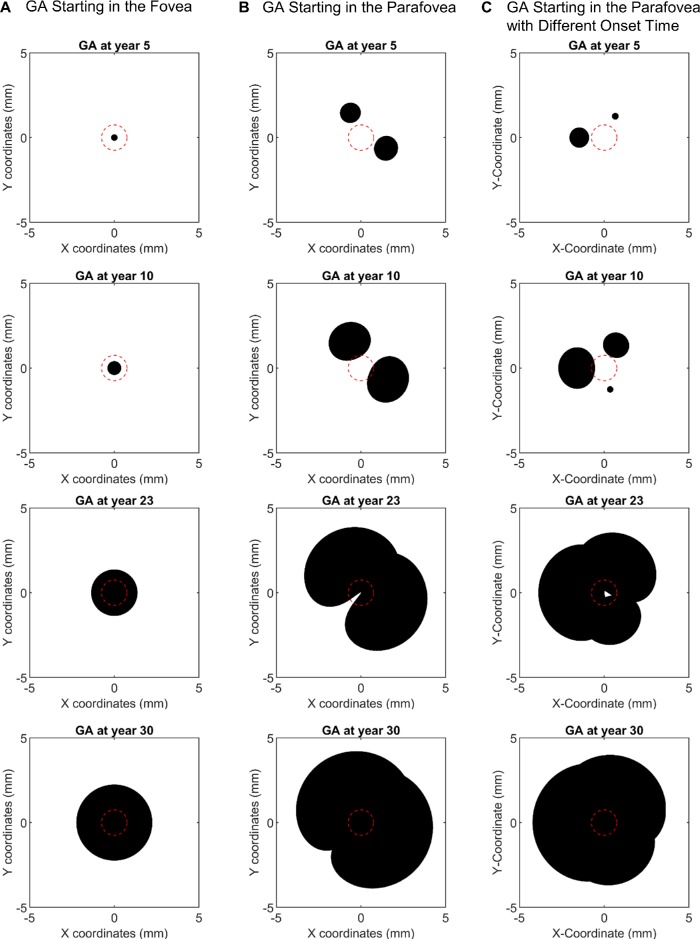
Methods: We searched in five literature databases up to May 3, 2019, for studies that evaluated the growth rates of GA lesions at different retinal regions. We performed random-effects meta-analyses to determine and compare the GA effective radius growth rates in four location groups defined by two separate classification schemes: (1) macular center point involved (CPI) or spared (CPS) in classification 1, and (2) foveal zone involved (FZI) or spared (FZS) in classification 2. We then estimated the GA growth rate in eight topographic zones and used the data to model the GA expansion.

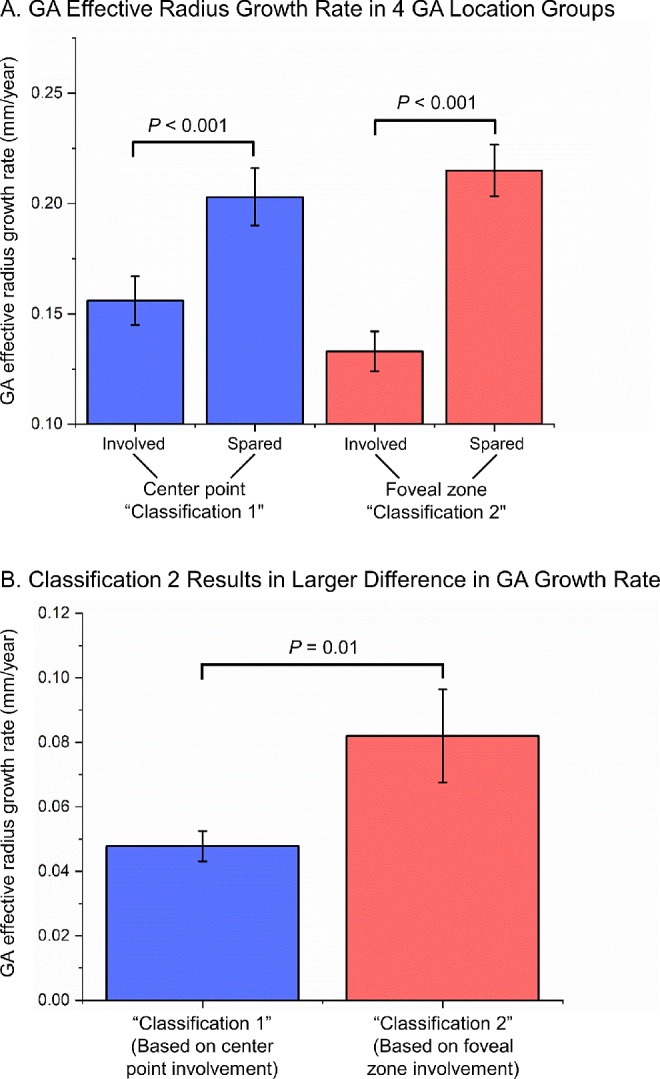
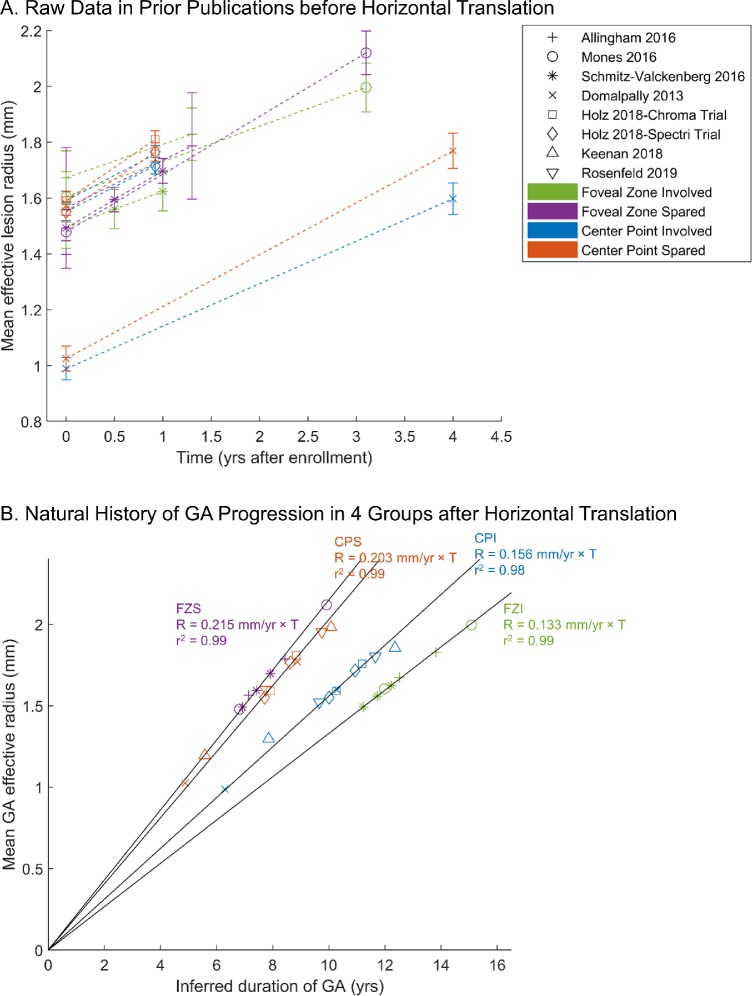
Results: We included 11 studies with 3254 unique eyes. In studies that used classification 1, the effective radius growth rate was 30.1% higher in the CPS group (0.203 ± 0.013 mm/year) than in the CPI group (0.156 ± 0.011 mm/year) (P < 0.001). This trend became significantly more prominent in classification 2, where the growth rate was 61.7% higher in the FZS group (0.215 ± 0.012 mm/year) than in the FZI group (0.133 ± 0.009 mm/year) (P < 0.001). The estimated GA effective radius growth rates in eight retinal zones fit a Gaussian function, and the modeling of GA expansion gave rise to various GA configurations comparable to clinical observations.

Conclusions: This study indicates that the GA progression rate varies significantly across different retinal locations. Our analysis may shed light on the natural history and underlying mechanism of GA progression.


Conflict of interest statement

Disclosure: L.L. Shen, None; M. Sun, None; S. Khetpal, None; H.K. Grossetta Nardini, None; L.V. Del Priore, Astellas Institute for Regenerative Medicine(C)

Figures

Figure 1.
Figure 1.
Preferred Reporting Items for Systematic Reviews and Meta-Analyses flowchart of identification and screening of studies. Note that one study (the geographic atrophy progression study) reported data for both analyses 1 and 3.
Figure 2.
Figure 2.
Random-effects meta-analysis comparing the effective radius growth rates (mm/year) of GA lesions with different lesion locations. (A) In GA location classification 1, the effective radius growth rate in the center point spared group is 0.048 mm/year faster than in the center point involved group (P < 0.001). (B) Similarly, in GA location classification 2, the effective radius growth rate in the foveal zone spared group is 0.082 mm/year faster than in the foveal zone involved group (P < 0.001). The diamond represents the overall effect estimate (width of the diamond represents the 95% CIs). For each individual study, different data marker sizes indicate weight, and the lines represent the 95% CIs. SD, standard deviation; CI, confidence interval.
Figure 3.
Figure 3.
(A) GA effective radius growth rates (mm/year) in four GA location groups. The GA effective radius growth rate in each group was calculated from a random-effects meta-analysis shown in Supplementary Figure S4. The P values between the pair in classification 1 (i.e., classifying GA lesions based on center point involvement) and between the pair in classification 2 (i.e., classifying GA lesions based on foveal zone involvement) are from Figure 2 and are statistically significant. (B) The mean difference in the GA effective radius growth rate between the pair in classification 2 (0.082 ± 0.014 mm/year in red bar) is 70.8% larger than the mean difference between the pair in classification 1 (0.048 ± 0.005 mm/year in blue bar) (P = 0.01 from t-test). The error bar represents the standard error.
Figure 4.
Figure 4.
GA effective radius as a function of time in four GA location groups. The shape of the markers represents the corresponding study, and the color represents one of the four GA location groups. (A) Raw data in prior publications (error bars = standard errors). Note that the initial sizes of GA ranged from 0.99 mm to 1.67 mm in effective radius (3.07–8.79 mm2 in area) among all studies, suggesting that these initial time points represent differing stages of disease. (B) After the introduction of translation factors (expressed in years in Table 1) to correct for different entry times of patients into each clinical study, cumulative datasets in each group fit along a straight line with a very high r2, suggesting that the GA effective radius enlarges linearly over time in each GA location group. In the GA location classification 1, the GA growth rate in the CPS group (0.203 ± 0.013 mm/year) is 30.1% higher than that in the CPI group (0.156 ± 0.011 mm/year). In comparison, the GA growth rate in the FZS group (0.215 ± 0.012 mm/year) is 61.7% higher than the growth rate in the FZI group (0.133 ± 0.009 mm/year) using the GA location classification 2.
Figure 5.
Figure 5.
The GA effective radius growth rate varies across different topographic zones. (A) Using the previously reported GA growth rates in different retinal zones (Table 2), we estimated the weighted mean GA effective radius growth rates in eight topographic zones in the retina (numerical data shown in Supplementary Table S4) and plotted the growth rate as a function of retinal eccentricity (µm). Interestingly, the GA effective radius growth rate appears to increase continuously within the macula (i.e., from 0 to ∼3000 µm from the foveal center) and then drops outside the macula. Note, there is a 3.2-fold difference between the maximum and minimum GA growth rate within the macula. (B) Heat map shows the variation of GA effective radius growth rate in eight topographic zones with different radii (µm) centered at the foveal center.
Figure 6.
Figure 6.
Images showing the modeling of GA expansion in three scenarios. The modeling is based on the Gaussian function between the GA effective radius growth rate and the distance to the foveal center shown in Supplementary Figure S9B. The origin of the coordinates represents the foveal center. The center red circle represents the foveal island with a radius of 0.75 mm. (A) GA lesions starting at the foveal center would grow symmetrically and remain as a circular shape over the elapsed time (from top to bottom images). (B) Two GA lesions starting in the parafovea (1.5 mm away from the foveal center) would first become small circular/oval lesions. Over the elapsed time, the two lesions would grow into kidney-shaped lesions, merge into a horseshoe-shaped lesion, and eventually cover the entire macula. (C) Three GA lesions with different onset times (5 years apart) starting in the parafovea would grow into a ring-shaped lesion with foveal sparing and eventually cover the entire fovea. The predicted shapes of GA lesions are similar to previously reported lesion shapes. Video clips showing continuous expansion of GA lesions in the 3 scenarios are provided in Supplementary Movies S1–S3.

Similar articles

Cited by

References

    1. Blair CJ. Geographic atrophy of the retinal pigment epithelium: a manifestation of senile macular degeneration. Arch Ophthalmol. 1975; 93: 19–25. - PubMed
    1. Wong WL, Su X, Li X, et al. . . Global prevalence of age-related macular degeneration and disease burden projection for 2020 and 2040: a systematic review and meta-analysis. Lancet Glob Health. 2014; 2: e106–e116. - PubMed
    1. Fleckenstein M, Mitchell P, Freund KB, et al. . . The progression of geographic atrophy secondary to age-related macular degeneration. Ophthalmology. 2018; 125: 369–390. - PubMed
    1. Lindner M, Boker A, Mauschitz MM, et al. . . Directional kinetics of geographic atrophy progression in age-related macular degeneration with foveal sparing. Ophthalmology. 2015; 122: 1356–1365. - PubMed
    1. Sunness JS, Gonzalez-Baron J, Applegate CA, et al. . . Enlargement of atrophy and visual acuity loss in the geographic atrophy form of age-related macular degeneration. Ophthalmology. 1999; 106: 1768–1779. - PubMed